Fig. 1
Exemplary DSC signal–time curves obtained in arterial vessels (a), gray matter (b), and white matter (c)
The challenge is now to transform the measured signal changes into valid measures of perfusion. Kinetic models relate the tracer concentrations in arterial blood C a(t) and tissue C t(t) to CBF, CBV, and MTT (Buxton 2009a). For an arbitrary arterial concentration–time course C a(t) (arterial input function, AIF), the tissue concentration–time course C t(t) (output function) depends on the local cerebral blood flow (CBF) as follows:
![$$ Ct(t)=Ca(t)\otimes \left[CBF\cdot r(t)\right] $$](/wp-content/uploads/2016/10/A174_2013_954_Chapter_Equ1.gif)
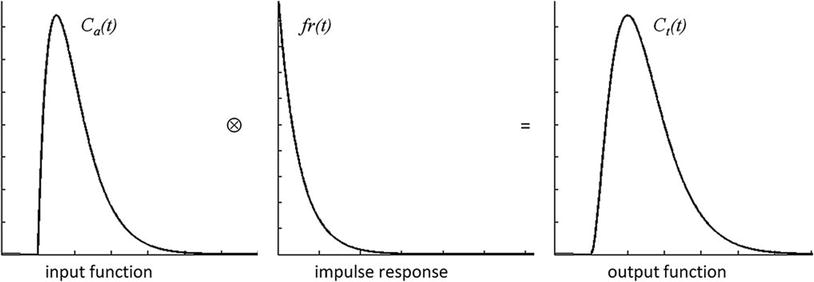
where r(t) is the local residue function and ⊗ indicates convolution. The r(t) can be considered as the fraction of contrast agent molecules entering the tissue at time t = 0 and still being present at a time t > 0. Thus, the residue function is a monotonically decreasing function with r ( t = 0) = 1; it contains the complexities concerning details of contrast agent distribution and kinetics. For a single well-mixed compartment, r(t) is usually assumed to decay exponentially. The product CBF ⋅ r ( t ) is also denoted as impulse response. Figure 2 illustrates the result of the convolution of idealized representations of an arterial concentration–time curve and an impulse response to yield an idealized tissue concentration–time curve.
![$$ Ct(t)=Ca(t)\otimes \left[CBF\cdot r(t)\right] $$](/wp-content/uploads/2016/10/A174_2013_954_Chapter_Equ1.gif)
(1)
Based on Eq. (1) it can be shown that the peak of the impulse response is determined by CBF, while the area under the impulse response corresponds to the partition coefficient λ, which for common MR contrast agents can be considered as the distribution volume of the tracer, corresponding to CBV for intravascular agents (Buxton 2009a). According to the central volume theorem, the mean transit time MTT is given by CBV/CBF (Meier and Zierler 1954).
Using dynamic susceptibility contrast, it is relatively straightforward to calculate a relative CBV (rCBV) from the area under the measured signal–time curve. Because it is quite insensitive to the actual shape of the AIF, this quantity is considered to be a quite robust measure of rCBV as long as the relation between tissue concentration and signal intensity is the same throughout the brain (Buxton 2009a; Calamante et al. 2000). rCBV values are frequently normalized to healthy-appearing white matter to facilitate comparison between patients. Cerebral blood flow is much more difficult to obtain since for intravascular tracers the transit time is very short and thus the influence of CBF on the tissue concentration–time curve is rather subtle. Therefore, the bolus arrival time (BAT), the time to peak (TTP), and the relative mean transit time (rMTT), i.e., the full width at half maximum of the signal–time curve, are frequently used as surrogate markers of perfusion (Ostergaard 2004).
In order to obtain quantitative perfusion parameters from bolus tracking data, a deconvolution of the tissue concentration–time curve C t(t) with the arterial concentration–time curve C a(t) (arterial input function, AIF) needs to be performed. However, unlike PET—where tracer concentrations are measurable quantities—the MR signal is only indirectly related to the contrast agent concentration. Usually, it is assumed that the change in the transverse relaxation rate ΔR 2* is linearly related to the tissue concentration of contrast agent (Rosen et al. 1990; Hendrick and Haacke 1993):

with a proportionality constant k. There are strong indications that this assumption of a linear relationship between the transverse relaxation rate and the concentration of the contrast agent is too simple (Blockley et al. 2008), because the mechanisms of signal loss in magnetically inhomogeneous media are highly complex (Blockley et al. 2008; Kjolby et al. 2006) and also depend on the vascular architecture (Johnson et al. 2000). Differential T2 and T2* relaxation behavior even allows to derive information on vessel diameter, size, and density (Kiselev 2005; Kiselev et al. 2005; Lemasson et al. 2013; Boxerman et al. 1995). Moreover, the contrast mechanisms within blood vessels and tissue are different (Kiselev 2001), and water exchange between tissue compartments actually needs to be taken into account (Landis et al. 2000; Li et al. 2010; Yankeelov et al. 2003). Nevertheless, Eq. (2) is usually employed to calculate tissue and arterial concentration–time curves from the measured MR signal with the echo time TE:


(2)

(3)
For an absolute quantification of CBV, CBF, and MTT, the arterial input function, i.e., the arterial concentration–time curve C a(t), needs to be measured with high accuracy, and in this respect, several additional difficulties occur. Usually, the AIF is measured in large arterial vessels crossing the imaging plane. However, because of the need for a high imaging speed, the spatial resolution is usually not sufficient to obtain pure blood voxels. This implies that partial volume effects most likely confound arterial signal intensity. At high arterial contrast concentrations, a complete signal loss may occur inside large arterial vessels especially if EPI with long TE is used for data acquisition, which additionally distorts the AIF. While the AIF merely serves as a global scaling factor for CBV quantification, estimates of the local AIF would actually be required for valid measurement of CBF. This is related to the observation that any broadening and delay in the arterial input confounds the measured CBF (Calamante 2005; Calamante et al. 2004; Duhamel et al. 2006; Ko et al. 2007). Even with an appropriate AIF, valid CBF measurement with DSC remains a challenge. Given the fact that the influence of CBF on the measured tissue concentration–time curve is rather weak, the deconvolution process is very delicate and sensitive to noise (Ostergaard 2004, 2005; Ostergaard et al. 1996a, b). Hence, absolute quantification of perfusion parameters is rarely performed in clinical practice; instead, relative perfusion measures are normalized to healthy appearing WM or contralateral tissue. Therefore, valid comparisons for multicenter or longitudinal studies are hardly possible.
Additional difficulties arise from recirculation and extravasation of contrast agent to the tissue. While recirculation may cause a second broader and smaller peak about 30–60 s after the first pass of the bolus, extravasation prevents the signal from returning to baseline values. Therefore, a gamma-variate function is frequently fitted to the initial part of the signal–time curve (Belliveau et al. 1991; Boxerman et al. 1997) to remove the influence of recirculation and increase the reliability of CBV measurement. However, contrast agent extravasation, as in tumor areas with disrupted blood–brain barrier, causes more severe problems. Gd-DTPA outside the vasculature enhances T1 relaxation of tissue water, counteracting the susceptibility-induced signal loss in T2* weighted images, which may lead to an underestimation of CBV (Rosen et al. 1990; Knopp et al. 1999; Quarles et al. 2009; Uematsu and Maeda 2006; Essig et al. 2002). However, if the contrast agent outside the vasculature causes significant susceptibility gradients, an overestimation of CBV is likewise possible (Bjornerud et al. 2011). There are several methods to account for contrast agent leakage in DSC-based CBV measurement. One practical possibility to reduce the influence of T1 relaxation is the administration of a pre-bolus of contrast agent in order to saturate the tissue in the leakage area (Paulson and Schmainda 2008; Boxerman et al. 2012). More elaborate approaches comprise double echo acquisitions (Uematsu and Maeda 2006; Paulson and Schmainda 2008; Miyati et al. 1997; Heiland et al. 1999; Vonken et al. 2000) or sophisticated data analysis (Rosen et al. 1990; Quarles et al. 2005, 2009; Bjornerud et al. 2011; Uematsu et al. 2000; Johnson et al. 2004), which also provides information on vessel permeability and seems to reveal a benefit when compared to the application of a pre-bolus alone (Boxerman et al. 2012). Valid quantification of perfusion using DSC, especially in areas with contrast agent leakage, is a matter of intense research. Since the blood–brain barrier in tumors is frequently disrupted, new developments would be highly relevant.
In spite of these issues, DSC-MRI is by far the most frequently used perfusion imaging method, as it is easy to perform and yields robust information on tissue perfusion, i.e., rCBV.
2.1.2 Dynamic Contrast-Enhanced MRI
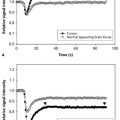
A qualitatively similar approach to perfusion imaging relies on the acquisition of a time series of T1 weighted images during bolus application (Fig. 3). This method is termed dynamic contrast-enhanced (DCE) imaging and allows quantification of vessel permeability, which is merely a confounding factor in DSC-based perfusion imaging. Generally, DCE-MRI requires the acquisition of a time series of T1 weighted images over several minutes to observe the wash-in and washout of contrast agent in extravascular extracellular space. Qualitative or semiquantitative measurements of leakage-related parameters are relatively easy to perform. The slope of the wash-in and washout portions of the time course can be evaluated within the regions of interest, allowing the distinction of tumor (fast rise) and radiation necrosis (slow rise) (McGehee et al. 2012). Also, semiquantitative parametric maps of the wash-in and washout slopes, maximal enhancement, and arrival time can easily be created. Integration of the initial area under the DCE tissue concentration curve (initial AUC) yields a more quantitative parameter (Li et al. 2012; Sourbron et al. 2009; Sourbron 2010) without the need for a sophisticated model. However, the influence of underlying physiologic processes like vessel permeability, extravascular extracellular volume, and blood flow is rather unclear (Donahue et al. 1996).


Fig. 3
Typical DCE signal–time curves obtained in arterial vessels (a), gray matter (b), and white matter (c)
Similar to the DSC method, quantitative DCE-based perfusion measurements are quite elaborate (Yankeelov and Gore 2009; Sourbron and Buckley 2012, 2013). Quantitative approaches require complex pharmacokinetic models, a quantitative relation between MR signal and contrast agent concentration, as well as an appropriate AIF. Pharmacokinetic models describe the distribution and elimination of contrast agents within and from the tissue with respect to the underlying physiology. Most frequently, a two-compartment model is used based on the pioneering work of Kety (1951). This model describes the tissue as consisting of an intravascular space (plasma volume v p) and an extravascular extracellular space (EES, volume v e) (Fig. 4). The distribution of the contrast agent is characterized by arterial delivery and venous elimination rates k a and k e as well as distribution and redistribution rate constants k 12 and k 21, which describe the diffusion into EES. Commonly measured parameters are the volume transfer constant K trans between blood plasma and EES
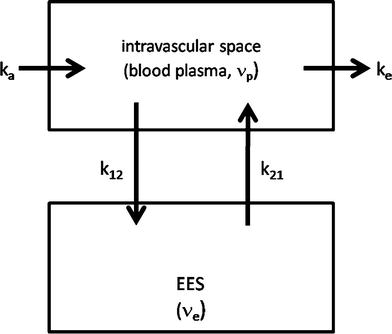


Fig. 4
Two-compartment model: Contrast agent is delivered to the intravascular space with a rate constant k a and is eliminated with a rate constant k e. The CA diffuses into and outside of the extravascular extracellular (EES) space with a distribution rate constant k 12 and a redistribution rate constant k 21

(4)
(with extraction fraction E and hematocrit Hct), the EES volume fraction v e, and the rate constant between EES and blood plasma k ep = K trans/v e. However, the interpretation of K trans depends on the physiological conditions: when the vessel permeability is much higher than blood flow (flow-limited condition), K trans corresponds to the blood plasma flow per unit volume of tissue; when blood flow is much higher than vessel permeability (permeability-limited condition), K trans corresponds to the permeability surface area product per unit volume of tissue (Sourbron and Buckley 2011).
First quantitative approaches were hampered by a rather low temporal resolution of T1 weighted imaging data and therefore only allowed to obtain K trans and v e as primary parameters for tissue characterization (Tofts and Kermode 1991; Tofts 1997; Tofts et al. 1999; Larsson et al. 1990; Brix et al. 1991). As technical progress permitted T1 weighted imaging with sufficiently high temporal resolution, advanced models have been developed which additionally allow measurement of CBV and CBF (Sourbron and Buckley 2012; Henderson et al. 2000; Pradel et al. 2003; Brix et al. 2004; Larsson et al. 2009; Li et al. 2012; Sourbron et al. 2009). Comprehensive reviews on these methods are given by Yankeelov and Gore (2009) as well as Sourbron and Buckley (2012, 2013), Sourbron (2010).
The majority of DCE-based MRI experiments are based on a model originally developed by Tofts (Tofts and Kermode 1991). According to that, the intravascular signal contribution is neglected and the relation between the contrast agent concentrations in tissue C t(t) and blood plasma C p ( t ) is described by (Yankeelov and Gore 2009; Tofts et al. 1999)


(5)
Inclusion of a plasma compartment with a volume v p yields the extended Tofts model (Sourbron and Buckley 2012; Brix et al. 2004):


(6)
Estimates of perfusion parameters are usually obtained by multiparametric nonlinear fitting of these equations to measured concentration–time curves. Besides that, a large number of different approaches have been developed. A recent comprehensive review of a variety of currently existing models for DCE-based perfusion measurement is given in Sourbron and Buckley (2013).
Similar to the DSC method, the measured T1 weighted MRI signal needs to be converted to contrast agent concentration before quantitative evaluations can be performed. Usually, a linear relation between the change in the longitudinal relaxation rate R 1 (= 1/T 1 ) and contrast agent concentration is assumed (Landis et al. 2000; Yankeelov and Gore 2009):

with the contrast agent relaxivity r 1 and the precontrast relaxation rate R 10. This assumption regards biological tissue as a single well-mixed compartment or at least requires a fast exchange of water between all tissue compartments. However, there are indications that water exchange is not fast enough in the presence of contrast agent (Donahue et al. 1996; Parkes and Tofts 2002; Schwarzbauer et al. 1997). Accounting for the water exchange rates between different tissue compartments even allows determination of intravascular or extravascular intracellular lifetimes of water molecules (Yankeelov and Gore 2009). Since a high temporal resolution is needed, R 1 ( t ) cannot be measured directly. Instead, R 1 ( t ) is determined from the T1 weighted signal–time curve s(t) and a precontrast measurement of tissue R 10 where the exact formula depends on the imaging sequence. For a saturation recovery sequence with time delay TD , the tissue concentration curve is calculated according to


(7)

(8)
Precontrast T1 mapping is frequently performed using the variable flip angle approach because it allows fast imaging with whole brain coverage (Yankeelov and Gore 2009; Li et al. 2012; Roberts et al. 2006; Harrer et al. 2004). However, this method needs careful spoiling or correction for the influence of residual magnetization to be accurate. At field strengths of 3 T and above, additional mapping of the local flip angle is required (Preibisch and Deichmann 2009). Therefore, saturation or inversion recovery methods are also frequently used (Larsson et al. 2008; Deichmann 2005; Henderson et al. 1999; Zhu and Penn 2005).
Also, a valid AIF, i.e., the plasma concentration of contrast agent C p ( t ), needs to be determined for quantitative perfusion measurements. In this respect, similar limitations as in DSC imaging apply, e.g., with respect to partial volume effects, broadening, and delays (Yankeelov and Gore 2009). However, unlike in DSC imaging, the linearity of signal change inside vessels is of less concern since there is no complication due to complete signal loss at high contrast agent concentrations.
The major drawback of DCE-MRI in comparison to DSC-based perfusion imaging is the significantly reduced signal change, which results in rather low SNR in the calculated parameter maps. In practice, it is also much more demanding to achieve a reasonable spatial coverage and temporal resolution with T1 weighted imaging methods, and it is more difficult to choose an appropriate method from the large variety of different approaches (see Sourbron and Buckley 2013 for a recent review).
2.2 Endogenous Tracer Methods: Arterial Spin Labeling
Arterial spin labeling is an alternative agglomeration of methods for measurement of cerebral blood flow which uses magnetically labeled water in blood vessels as endogenous diffusible tracer. The basic idea is to acquire two data sets, one with labeling of inflowing blood and one without. The difference signal is proportional to the delivered magnetization and hence to blood flow. Because labeled water acts as a freely diffusible tracer with accordingly prolonged tissue transit times, CBF derived from arterial spin labeling (ASL) is principally more robust than CBF derived from bolus tracking based on intravascular tracers (Buxton 2009b). Figure 5 depicts the basic order of events for the two fundamental types of pulsed (PASL) and continuous arterial spin labeling (CASL).
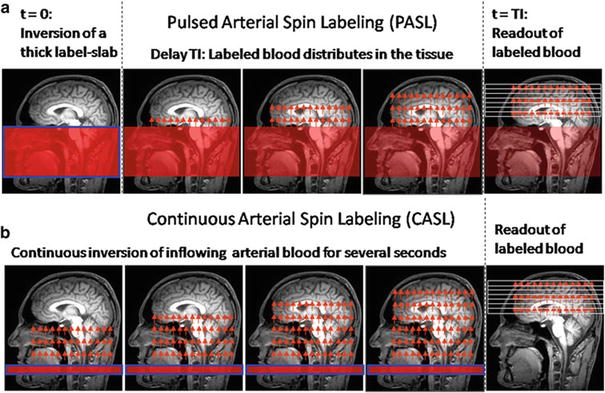

Fig. 5
Schematic order of events for pulsed (a) and continuous (b) arterial spin labeling (ASL)
In the PASL labeling condition, a thick slab proximal to the imaging volume of interest (blue framed slab in (a)) is usually inverted at time t = 0 by a short RF pulse. After a delay time (inversion time, T1, typically ≈1.5 s), which allows labeled blood to distribute within the imaging volume, labeled images are acquired. CASL approaches use extended labeling periods where inflowing blood is inverted continuously by long RF pulses (several seconds) in a thin slice in the neck area. Labeled images are acquired after termination of the labeling pulse. A recent development is the pseudocontinuous ASL (pCASL) approach, where series of short RF and gradient pulses achieve more efficient labeling (compared to PASL) and reduced specific absorption rate (SAR) and magnetization transfer effects (compared to CASL) (Silva and Kim 1999; Wu et al. 2007; Helle et al. 2012). Remarkably, it is also possible to selectively label individual arterial vessels, which enables imaging of vascular territories (Helle et al. 2012; Golay et al. 2005; Paiva et al. 2007; van Laar et al. 2008).
Qualitative perfusion images can easily be derived because the difference between labeled and unlabeled images is proportional to CBF, but absolute quantification is again quite difficult. A good introduction to ASL is given by Buxton (2009b) and a number of recent reviews cover all possible methodological issues (Wu et al. 2010; Deibler et al. 2008; Golay and Petersen 2006; Golay et al. 2004; Williams 2006; Parkes 2005; Petersen et al. 2006a, b) with regard to ASL-based CBF quantification.
Generally, care needs to be taken with regard to the control experiments because the labeling pulse, though applied off resonance, may nevertheless affect the magnetization within the imaging volume mainly via magnetization transfer effects (McLaughlin et al. 1997; Pekar et al. 1996; Zhang et al. 1992). Since the signal change inferred by blood flow only is on the order of about 1 %, even small effects may introduce large errors. To control for magnetization transfer effects, an equivalent off-resonant RF pulse needs to be applied during the control condition without labeling the inflowing spins. A number of techniques have been developed for all types of ASL methods, even though the effect is much more severe in CASL due to the long duration of its labeling pulse (Buxton 2009b). PASL approaches mainly vary by different placement of the control RF pulse (Edelman et al. 1994; Kwong et al. 1995; Wong et al. 1997; Kim 1995), while some CASL techniques even use separate labeling coils in the neck (Shen and Duong 2011; Paiva et al. 2008; Talagala et al. 2004). In PASL, slice profile effects due to the close proximity of the labeling slab and the imaging slice are also a problem and are usually diminished by a gap between labeling and imaging slice. Because the ASL difference signal change is so small, suppression of the static tissue signal (background suppression) in the imaging slices was found to be beneficial (Garcia et al. 2005; Mani et al. 1997; Ye et al. 2000).
Major confounding factors are transit delays Δt between the labeling plane and the imaging slice (Zhang et al. 1992; Wong et al. 1997; Alsop and Detre 1996; Buxton et al. 1998), the bolus duration T (Buxton 2009b; Wong et al. 1998; Luh et al. 1999), and relaxation effects (Buxton 2009b). The transit delay Δ t may vary across the brain by several tenth of milliseconds (Wong et al. 1997) causing systematic errors even in qualitative CBF maps. An effective means to reduce the influence of transit delays in CASL is to insert a delay after the end of the labeling pulse (Alsop and Detre 1996); for PASL, the inversion time needs to be longer than the longest Δt. In CASL, the duration of the arterial bolus is well defined by the duration of the labeling RF pulse. In PASL, however, the thickness of the labeling slab determines the amount of labeled blood, and the bolus duration thus depends on global flow (Buxton 2009b). In order to create a bolus with a well-defined duration, saturation pulses can be applied to the labeling slab after an inversion time TI 1 (Wong et al. 1998; Luh et al. 1999). The most complex effect is caused by water exchange between vessels and tissue. Initially, when labeled water is delivered to the tissue, relaxation of water spins occurs within the vessels with the arterial longitudinal relaxation time T 1A, while after exchange—within the brain parenchyma—the tissue relaxation time T 1t applies. This is difficult to model, especially since the exchange time T ex (on the order of a few tenth of seconds) is not well known (Buxton 2009b).
Quantitative evaluations need to account for these effects. Early approaches used a modified Bloch equation to account for the influence of CBF on the difference signal (Kwong et al. 1992, 1995; Kim 1995; Detre et al. 1992). More recently, tracer kinetic modeling has also been used to derive CBF from ASL data (Buxton et al. 1998). In this approach, the amount of magnetization delivered to the imaging voxel by arterial blood ΔM(t) (i.e., the magnetization difference between control and label condition) is regarded to correspond to the tracer concentration. Based on this presumption, tracer kinetic principles can be applied to describe the influence of physiological processes on ΔM(t) by means of a delivery function c(t), a residue function r(t), and a magnetization relaxation function m(t) (Buxton 2009b; Buxton et al. 1998):
![$$ \varDelta M(t)=2{M}_{0A}\cdot CBF\cdot c(t)\otimes \left[r(t)m(t)\right] $$](/wp-content/uploads/2016/10/A174_2013_954_Chapter_Equ9.gif)
where ⊗ denotes convolution. The equilibrium magnetization of arterial blood M 0A is difficult to measure, but a useful approximation can be obtained from the CSF signal (Chalela et al. 2000). Appropriate definitions of the functions c(t), r(t), and m(t) allow to include the effects of transit delays Δt and delayed water exchange T ex (Buxton 2009b):
![$$ \begin{array}{l}c(t)=\Big\{\begin{array}{l}0 \, 0<t<\varDelta t\hfill \\ {}\alpha {e}^{-t/{T}_{1\mathrm{A}}} \left(\mathrm{PASL}\right) \, \varDelta t<t<\varDelta t+T\hfill \\ {}\alpha {e}^{-t/{T}_{1\mathrm{A}}} \left(\mathrm{CASL}\right) \, \varDelta t<t<\varDelta t+T\hfill \\ {}0 \, \varDelta t<T<t\hfill \end{array}\hfill \\ {}r(t)={e}^{-CBF \cdot t/\lambda}\hfill \\ {}m(t)=\Big\{\begin{array}{l}{e}^{-t/{T}_{1A}} \, t>{T}_{ex}\hfill \\ {}{e}^{-{T}_{ex}/{T}_{1A}}{e}^{-\left(t-{t}_{ex}\right)/{T}_{1t}} \, t>{T}_{ex}\hfill \end{array}\hfill \end{array} $$
” src=”/wp-content/uploads/2016/10/A174_2013_954_Chapter_Equ10.gif”></DIV></DIV><br />
<DIV class=EquationNumber>(10)</DIV></DIV>with bolus length <SPAN class=EmphasisTypeItalicSmallCaps>T</SPAN>, inversion efficiency α (Alsop and Detre <CITE><A href=]() 1996; Zhang et al. 1993), and the longitudinal relaxation times of water in arterial blood and tissue T 1A and T 1 t . Generally, absolute CBF quantification is quite laborious because several time points need to be acquired after the end of the labeling pulses for proper modeling in CASL as well as PASL (Petersen et al. 2006a, b, 2010). This is aggravated by the fact that the SNR of a single difference image is quite low meaning that several (≈50) averages need to be acquired. T 1A of arterial blood is usually assumed from the literature, but mapping of local tissue T 1 is considered to be necessary, especially with CASL because the longer labeling duration allows more time for exchange (Buxton 2009b; Parkes 2005). Reduced inversion efficiency is rather a problem in CASL (Alsop and Detre 1996; Zhang et al. 1993), while proper definition of bolus duration is a bigger issue in PASL (Wong et al. 1998; Luh et al. 1999). There are a number of other difficulties which complicate absolute quantification of CBF via ASL like inhomogeneities of the receiver coil (Wang et al. 2005), T2* relaxation (St Lawrence and Wang 2005), and labeled water within arteries (Petersen et al. 2006a, b). CBF quantification using ASL is an area of active research steadily yielding innovations, e.g., a time efficient strategy for sampling at multiple TI using the Look–Locker approach was proposed by Gunther et al. (2001). However, many refinements with regard to accuracy go along with decreased SNR and reduced stability. Thus, in clinical practice, where measurement time is heavily restricted, qualitative ASL or PASL methods aiming at CBF quantification with a single inversion (Wong et al. 1998; Luh et al. 1999) are most frequently applied.
1996; Zhang et al. 1993), and the longitudinal relaxation times of water in arterial blood and tissue T 1A and T 1 t . Generally, absolute CBF quantification is quite laborious because several time points need to be acquired after the end of the labeling pulses for proper modeling in CASL as well as PASL (Petersen et al. 2006a, b, 2010). This is aggravated by the fact that the SNR of a single difference image is quite low meaning that several (≈50) averages need to be acquired. T 1A of arterial blood is usually assumed from the literature, but mapping of local tissue T 1 is considered to be necessary, especially with CASL because the longer labeling duration allows more time for exchange (Buxton 2009b; Parkes 2005). Reduced inversion efficiency is rather a problem in CASL (Alsop and Detre 1996; Zhang et al. 1993), while proper definition of bolus duration is a bigger issue in PASL (Wong et al. 1998; Luh et al. 1999). There are a number of other difficulties which complicate absolute quantification of CBF via ASL like inhomogeneities of the receiver coil (Wang et al. 2005), T2* relaxation (St Lawrence and Wang 2005), and labeled water within arteries (Petersen et al. 2006a, b). CBF quantification using ASL is an area of active research steadily yielding innovations, e.g., a time efficient strategy for sampling at multiple TI using the Look–Locker approach was proposed by Gunther et al. (2001). However, many refinements with regard to accuracy go along with decreased SNR and reduced stability. Thus, in clinical practice, where measurement time is heavily restricted, qualitative ASL or PASL methods aiming at CBF quantification with a single inversion (Wong et al. 1998; Luh et al. 1999) are most frequently applied.
Get Clinical Tree app for offline access

![$$ \varDelta M(t)=2{M}_{0A}\cdot CBF\cdot c(t)\otimes \left[r(t)m(t)\right] $$](/wp-content/uploads/2016/10/A174_2013_954_Chapter_Equ9.gif)
(9)
The Perfusion Study Group of the International Society for Magnetic Resonance in Medicine (ISMRM) (Perfusion Study Group ISMRM 2013) is currently compiling a consensus paper on MR perfusion imaging, which is supposed to contain recommendations for scan protocols as well as evaluation procedures for a number of applications. This consensus paper is expected to be a huge step toward more standardized MR perfusion imaging methods (Table 1).
Table 1
Overview of MR perfusion imaging methods
Method | Indicators | Imaging | Advantages | Disadvantages |
|---|---|---|---|---|
DSC | (r)CBV (r)CBF (r)MTT AT TTP | Time series of T2*w images (usually EPI) during CA bolus application Acquisition time ≈1–2 min | Implemented on commercial MR systems Relatively easy to perform Robust estimates of relative CBV | Compromised by contrast agent leakage Not easily quantifiable |
DCE | K trans CBV CBF | Time series of T1w images during CA bolus application Acquisition time: several min | Straightforward characterization of vessel permeability | No established standard method Not widely implemented on commercial MR systems Low SNR |
ASL | CBF | Pairs of label/control images (usually EPI) Acquisition time: several min | No contrast application necessary Robust estimate of relative CBF | Low SNR |
3 Clinical Application
3.1 General Aspects
Perfusion imaging in brain tumors is—as of today—not yet part of the imaging modalities included in the response assessment in neuro-oncology (RANO) criteria, where response to treatment in patients with malignant gliomas is determined by post-therapeutic changes in conventional T2 and contrast-enhanced T1 imaging along with clinical parameters (Wen et al. 2010). The omission of the novel functional MRI methods is explained by a lack of standardization and thus impaired comparability of multicenter data; however, further application for individual patient evaluation is strongly recommended, since perfusion imaging is accepted as a standard tool of neuro-oncological diagnostics today.
The technical aspects of perfusion imaging are discussed in detail in the first section of this chapter. In everyday clinical practice, the DSC method is most commonly available, providing perfusion data in under a minute’s measurement time. ASL and DCE methods are less widespread due to technical limitations. A combination of the methods, if available, may provide additional information. However, the patient’s well-being must always be put first: long examinations may be less tolerated by critically ill patients—and motion artifacts due to unease impair data independent of the perfusion imaging method used. A special advantage of ASL methods is the lack of external contrast agent; therefore, they can be applied in patients with contraindications to contrast agent administration, i.e., impaired renal function or severe gadolinium allergy.
Most MRI systems provide an online calculation of DSC-based perfusion maps, with manual masking, smoothing, AIF definition, and ROI placement. While these maps can quickly be inspected and readily transmitted into local PACS systems, they have the drawbacks of being operator dependent and not quantitative. Several approaches for quantitative assessment, e.g., histogram and kurtosis analysis, are available and widely used for scientific evaluation; however, these are mostly in-house developments and only allow offline evaluations.
Perfusion characteristics of brain tumors are most frequently compared with those of normal appearing brain tissue in the same patient, relying on a relative value, e.g., rCBV. A high rate of perfusion is typically defined as higher than normal appearing gray matter. Perfusion heterogeneity is a common feature in brain tumors and the localization of “hot spots,” i.e., focally highest values, is of special interest. While (semi)quantification is feasible, the definition of a threshold value valid across patients is nearly impossible, also due to diverging physiological parameters such as heart rate. Special attention must be paid to “artificially” high perfusion values in vascular structures. A correlation with conventional imaging—where vessels appear as flow voids and tubular enhancements—is therefore indispensable.
A controversial topic in perfusion MRI of brain tumors is the correction for contrast agent leakage in the presence of a disrupted blood–brain barrier (BBB). The development of a leaky BBB is an important step in the malignant transformation of a tumor and BBB changes may also be a relevant effect of tumor therapy. Therefore, the effect of a disrupted BBB and consequent contrast agent leakage on perfusion data must be accounted for when attempting tumor grading or assessing therapy response. In order to achieve comparability of perfusion measurements at different clinical sites, the measurements and post-processing steps must be standardized. While simple techniques to minimize leakage effects, e.g., the preinjection of contrast agent to “saturate” the extracellular space, are easy to perform (for further description of such techniques, see Methods), the standardization of more sophisticated postprocessing algorithms might be favorable (Boxerman et al. 2012; Heiland et al. 2010). Separate information on cerebrovascular parameters (CBV, CBF) and on BBB permeability may be acquired; several possibilities for this are discussed in the “Methods” section of this chapter.
The vast majority of clinical studies have investigated the parameter rCBV—measured by the most robust DSC method—in correlation with other descriptive tumor characteristics and with outcome. Other perfusion parameters like rCBF and permeability have also been introduced to clinical practice with the use of ASL and DCE (Warmuth et al. 2003). First clinical studies using these parameters have largely reproduced previous (rCBV) results in most clinical questions.
Perfusion imaging, when performed and interpreted with care, can play a significant role in major clinical decisions regarding diagnosis, therapy, and follow-up.
3.2 Pathophysiological Background: Neovascularization in Brain Tumors
Neovascularization, i.e., the development of new vessels, is a vital process in the embryonic differentiation processes as well as in later stages of life where wound repair and inflammation, etc. require additional vascular supply. A marking step in the research of tumor pathophysiology was the detection of neovascularization of tumors as part of their malignant transformation (Brem 1976). Once the angiogenic phenotype is switched on in a tumor, its malignancy is definite and its growth exponential. The development of tumor vessels is especially intriguing in brain tumors, as they represent a direct correlate of tumor grade, are largely responsible for symptomatic tumor edema and bleeding, and represent an obstacle to drug delivery. While low-grade tumors grow along preexisting vessels (vascular co-option), higher-grade tumors start to generate own tumor vessels in the process of growing, which are different from normal vessels in appearance and structure. Glioblastoma vessels mainly originate from local endothelial cells (angiogenesis)—after destruction of preexisting vessels—or sometimes from bone marrow-derived endothelial precursor cells (vasculogenesis); further mechanisms include vascular mimicry and the transdifferentiation of GBM cells into endothelial cells (Hardee and Zagzag 2012). Genetic and epigenetic factors include an alteration of oncogenes with upregulation of hypoxia-inducible factor HIF-1α and members of the family of vascular endothelial growth factor (VEGFs); these factors promote the destruction of pericytes and of the extracellular matrix with matrix metalloproteinases; they recruit endothelial cells and promote vascular remodeling and sprouting. The resulting tumor vessels are tortuous, wide, and dense, while their borders are blurred due to incomplete endothelial and pericyte coverage resulting in a breakdown of the blood–brain barrier and increased permeability (Soda et al. 2013).
In neuropathology, description of tumor vascularity is an important criterion for tumor grading with higher vascularity representing a higher grade of malignancy. WHO °II tumors mainly incorporate preexisting vessels, while high-grade gliomas develop new, heterogeneous, and tortuous vessels with higher density (Fig. 6). Higher microvascular density is a prognostic factor for shorter postoperative survival in astroglial brain tumors (Leon et al. 1996; Folkerth 2004).
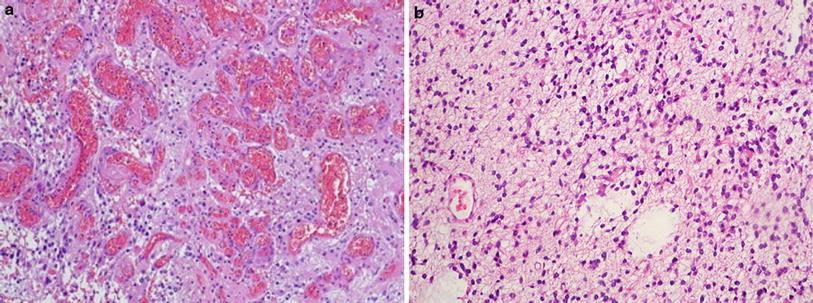

Fig. 6
(a) Histopathological view of pathological tumor vessels in a WHO °II glioma exhibits no pathological tumor vessels (Image glioblastoma specimen. Note the densely packed tortuous vessels with courtesy of Claire Delbridge MD, Department of Neuropathology, incomplete endothelial coating. (b) In contrast, the biopsy specimen of a Klinikum Rechts der Isar, TU Munich)
In histopathological studies combined with previous MR perfusion imaging, tumor regions with high rCBV were found to correlate with a high microvascular density in mouse models as well as in human brain tumor specimens (Cha et al. 2003). Contrast enhancement and permeability measures in MRI reliably characterized the blood–brain barrier and its permeability as seen in histopathology. These findings confirm the theoretical assumption that perfusion imaging represents the variations and changes in tumor microvasculature (Cha 2004).
3.3 Differential Diagnosis of Tumors
The differential diagnosis of the three major groups of malignant intracranial intra-axial tumors—glioma, lymphoma, and metastases—is often difficult in conventional (T2w, T1w) MR imaging. Their features in conventional imaging—typical localization, the presence or absence of hemorrhage, necrosis, and T2 signal intensities—may help differential diagnosis but are not always conclusive. While periventricular localization is typical for lymphomas and metastases are more often cortex associated, each of these entities may appear in another localization—therefore, periventricular or cortical localization is not a distinctive feature. Contrast enhancement and focal necrosis are common in all high-grade brain tumors irrespective of their origin. Therefore, in most cases, conventional imaging does not allow a definite diagnostic statement. However, the intrinsically different histology and vascularization pattern of these entities makes perfusion imaging a useful tool in their differentiation.
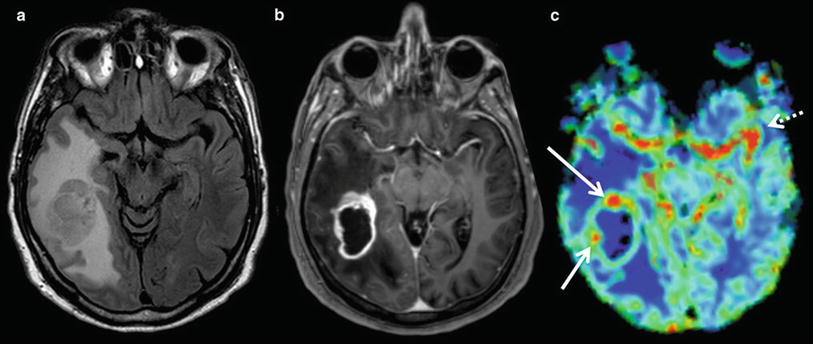
High-grade gliomas are characterized by high cellular density and pleomorphism, mitoses, palisading necrosis, and vascularization. The latter results in very high tumor perfusion, i.e., high rCBV values throughout the tumor (as compared with healthy contralateral tissue), with focal peaks probably representing the most malign tumor foci, the so-called tumor hot spots (Fig. 7). Glial tumors show an extremely infiltrative growth pattern beyond the contrast-enhancing lesion into the peritumoral edema. Consequently, rCBV values are typically elevated beyond the contrast-enhancing lesion in peritumoral regions as well.

