Perfusion Imaging Using Magnetic Resonance Imaging and Computed Tomography in Head and Neck Cancer
Gaurang Shah
Zoran Rumboldt
Yonggang Lu
Amita Shukla-Dave
Harish Poptani
Suresh Mukherji
The superficial and deep cervical fascia divide the suprahyoid and infrahyoid neck into various anatomic compartments called neck spaces (Fig. 60.1A, B), the understanding of which is fundamental to accurate evaluation and staging of various malignant head and neck masses. The most common malignant neoplasm of the head and neck is the squamous cell carcinoma, arising from visceral spaces extending from the nasopharynx to subglottic pathways. Although cross-sectional imaging with computed tomography (CT) and magnetic resonance imaging (MRI) has greatly improved the efficacy of diagnosis, staging, follow-up and posttreatment evaluation, newer imaging techniques like perfusion imaging can give additional information about tumor microvasculature, assess local tumor infiltration, differentiate benign from malignant neck masses, and help differentiate recurrent masses from posttherapeutic changes, monitoring tumor response to surgery and chemoradiation therapy.
Utilizing dynamic imaging with intravenous contrast to assess tissue perfusion is not new; it was proposed in the early 1980s with CT scan techniques. The earlier developments and utility of this technique better characterized and differentiated soft tissue masses1 and better assessed brain perfusion in acute stroke.2 Earliest use of dynamic CT in head and neck was to further characterize vascularity of the soft tissue masses of the neck and to narrow the differential diagnoses.3,4,5,6,7 Dynamic gadolinium-enhanced MRI was utilized in evaluation of the head and neck masses and lymph nodes by the late 1980s, mainly replicating the same results that dynamic contrast–enhanced CT was able to achieve.8,9,10 However, the value of this additional technique was considered less than stellar in establishing vascularity and tissue characteristic of head and neck masses.11
Angiogenesis is a fundamental process in the rapid growth and metastatic spread of a malignant soft tissue mass, including head and neck tumors. High microvascular density of a neoplastic process is associated with increased blood flow and perfusion of the mass.12 With increasing prevalence of malignancy in an aging population, rising success of cancer therapy, and the advent of antiangiogenesis therapy, there was a growing need to monitor therapeutic response with accuracy greater than was possible with conventional morphological imaging with CT and MRI. The advent of multiple-detector CT scanners with a high number of detector rows allows greater anatomic coverage and higher temporal resolution.13 It potentially advanced perfusion CT from a single-slice technique to a volumetric analysis.14 Progressive advancement with 8-row, 16-row, 64-row, and 128-row CT technology enables more accurate and extensive assessment of tissue perfusion15,16 (see Chapters 1, 2 and 9), which correlates well with microvascular density,17 a marker of tumor malignancy. At the same time, introduction of MRI scanners with increased gradients and greater slew rate allows for rapid scanning techniques, lending to increased accuracy and quantitative measurements of perfusion imaging, which could be dynamic susceptibility contrast (DSC) MRI or dynamic contrast–enhanced (DCE) MRI18 (see Chapters 23 and 29). Arterial spin labeling (ASL) is a newer MRI technique that does not require intravenous contrast but instead uses labeled intra-arterial water (by saturation or inversion) as an endogenous tracer to quantify tissue blood perfusion (see Chapter 15).19 This is an involved technique, which is nascent and not widely available in clinical settings; it nevertheless shows great promise.
Dynamic Contrast-Enhanced Computed Tomography
Perfusion CT studies are more suited on multiple-detector CT equipment having eight or more detector rows with helical technique (see Chapters 1 and 9). Currently, 64- or 128-channel helical CT equipment is utilized in cine or burst mode after intravenous administration of iodinated contrast material to continuously record x-ray attenuation of the area of interest during the first passage of contrast.20 The contrast remains mainly in the intravascular compartment during the first passage. The change in tissue attenuation thus corresponds to the degree and severity of angiogenesis and becomes a function of microvascular density. At the same time, the change in tissue attenuation is largely determined by the flow of the blood to the mass. Tissue blood volume (BV) and blood flow (BF) are thus important measures of tissue perfusion, with mean transit time (MTT) or time to peak being important adjunct calculations. However, as time progresses, the contrast will pass through the “pores” in the capillary endothelium, which exhibit increased fenestration and hence increased
permeability due to malignant neoplastic process, and into the extravascular-extracellular space (EES). The intravascular-extracellular component will depend on the volume of blood within the vessels (BV), while the extravascular-extracellular component will be a function of leakiness or permeability of capillaries (CP). Thus, there are two basic paradigms of perfusion CT in head and neck tumors: (a) measurement of perfusion parameters and (b) assessment of permeability function.12 The study is performed in two or three parts. First, a baseline noncontrast study is performed. Then, a dynamic contrast-enhanced cine or burst mode scan is performed with repeated acquisition of the same volume over a period of time during the first pass of the bolus. Whether or not the acquisition is acquired in axial or helical mode depends on the anatomical coverage. Finally, a delayed postcontrast series is performed for measurement of contrast leakage into the extravascular compartment or later phases of contrast-enhanced series can be used to calculate capillary permeability via pharmacokinetic modeling (see Chapter 29). An alternative and more common approach is to perform the study in two parts: the standard postcontrast neck CT is followed
by the dynamic perfusion scan; if the standard neck CT or an MRI study was already performed and available, the perfusion scan is preceded by a low-dose unenhanced neck CT instead.15,16 By documenting incremental increases in tissue attenuation with the passage of time, time-attenuation curves (TAC) can be generated by subtracting the baseline noncontrast images from the cine postcontrast images. The subtraction can be on a pixel-by-pixel or regional basis.
 FIGURE 60.1. Complex anatomy of head and neck region seen at the level of nasopharynx and the oral cavity with multiple discrete neck spaces separated by deep cervical fascia. |
Compartmental analysis and deconvolution are two of the most widely accepted methods for analysis of dynamic CT data to obtain perfusion and other vascular physiologic parameters (see Chapter 25). Several commercial techniques are available from commercial vendors based on one of these two basic methods to analyze these TAC curves and obtain the perfusion values. Compartmental analysis is preferred for organs with complex vascular circuits, while deconvolution is preferred for measuring tumor perfusion parameters with low variation in perfusion values before or after treatment because it has lower susceptibility to image noise.14 Deconvolution has been preferentially used for head and neck cancer.
Perfusion CT helps to characterize indeterminate pulmonary nodules, reducing the number of patients that require fluorodeoxyglucose–positron emission tomography (FDG-PET),21 revealing occult hepatic metastasis undetected by conventional CT,22,23 risk stratifying hepatic metastasis in patients with colon cancer, and measuring physiologic response to radiotherapy.24,25 In head and neck, perfusion CT helps to differentiate benign from malignant tumors,16,26 helps to better evaluate tumor extent,27 helps differentiate recurrent masses from posttherapeutic changes,16,28 helps monitor and predict response to chemoradiation therapy,29,30,31,32 noninvasively measures biomarkers for tumor angiogenesis,17 and correlates with expression of molecular biomarkers for the tumor.33
Data Acquisition
Compartmental analysis and deconvolution are two diverse basic methods used by different vendors to analyze CT perfusion data and obtain perfusion parameters. Compartmental analysis is based on Fick’s principle and assumes intravascular spaces and extravascular spaces as a single compartment.13 A two-compartmental model is based on Patlak analysis34 or similar models. In cases of Patlak analysis, one assumes little backflow from extravascular to intravascular spaces for the first 2 minutes.35 Tissue perfusion can be calculated from maximal slope or peak height of TAC, normalized to arterial input function, or other methods.
Deconvolution technique utilizes arterial and tissue TAC to obtain a tissue impulse residue function,36 where the height of the impulse residue function curve corresponds to tissue blood flow, while the area under the curve corresponds to the blood volume.37,38 This can be extended and modified by a distributed parameter model for measurement of capillary permeability.13 A detailed evaluation of acquisition schemes for CT perfusion can be found in Chapter 9, and the convolution/deconvolution methods are further detailed in Chapters 24 and 25.
Protocols at University of Michigan
The perfusion CT protocols used at University of Michigan at Ann Arbor are summarized in Table 60.1.
First, a noncontrast helical CT scan of the neck is performed with 40-mm detector coverage and 0.516:1 pitch reconstructed at 2.5 mm and acquired at 120 kVp with 80 mA. The patient is instructed not to swallow during the scan and breathe quietly and normally. Next comes a dynamic perfusion contrast scan following a rapid, intravenous single bolus administration of 50 cc Isovue 300 (Bracco, Milan, Italy) delivered at 4 cc/sec flow rate by a Medrad (Medrad, Indianola, PA) power injector into an antecubital vein followed by a 20 cc normal saline flush at 4 cc/min. After a 5-second scan delay to minimize radiation exposure, cine mode dynamic CT scan is performed for 50 seconds with gantry rotation time of 1.0 second. The scan covers a 40-mm area with eight 5-mm thick images obtained in single rotation. This results in 50 dynamic time points at 1-second temporal resolution with a total of 400 images. The scanning is performed at 120 kVp with 65 mA. Many other centers, however, utilize 80 kVp, with up to 200 mAs (Table X). Lower kilovolt peak leads to a substantial reduction in radiation dose along with improved contrast resolution, as the beam energy gets closer to the K-edge of iodine (33.2 keV); a potential shortcoming of this approach is increased amount of beam-hardening artifacts, primarily in the oral cavity. After completion of the perfusion acquisition, a routine postcontrast helical neck CT is performed from skull base to thoracic inlet at 120 kVp and 80 mA and reconstructed at 2.5 mm. At many other centers the routine postcontrast neck CT is performed before the perfusion scan (noncontrast scan is only acquired if the diagnostic CT or MRI has already been obtained). The perfusion data are then transferred to a workstation for further processing.
First, a noncontrast helical CT scan of the neck is performed with 40-mm detector coverage and 0.516:1 pitch reconstructed at 2.5 mm and acquired at 120 kVp with 80 mA. The patient is instructed not to swallow during the scan and breathe quietly and normally. Next comes a dynamic perfusion contrast scan following a rapid, intravenous single bolus administration of 50 cc Isovue 300 (Bracco, Milan, Italy) delivered at 4 cc/sec flow rate by a Medrad (Medrad, Indianola, PA) power injector into an antecubital vein followed by a 20 cc normal saline flush at 4 cc/min. After a 5-second scan delay to minimize radiation exposure, cine mode dynamic CT scan is performed for 50 seconds with gantry rotation time of 1.0 second. The scan covers a 40-mm area with eight 5-mm thick images obtained in single rotation. This results in 50 dynamic time points at 1-second temporal resolution with a total of 400 images. The scanning is performed at 120 kVp with 65 mA. Many other centers, however, utilize 80 kVp, with up to 200 mAs (Table X). Lower kilovolt peak leads to a substantial reduction in radiation dose along with improved contrast resolution, as the beam energy gets closer to the K-edge of iodine (33.2 keV); a potential shortcoming of this approach is increased amount of beam-hardening artifacts, primarily in the oral cavity. After completion of the perfusion acquisition, a routine postcontrast helical neck CT is performed from skull base to thoracic inlet at 120 kVp and 80 mA and reconstructed at 2.5 mm. At many other centers the routine postcontrast neck CT is performed before the perfusion scan (noncontrast scan is only acquired if the diagnostic CT or MRI has already been obtained). The perfusion data are then transferred to a workstation for further processing.
TABLE 60.1 PERFUSION COMPUTED TOMOGRAPHY PROTOCOLS USED AT THE UNIVERSITY of MICHIGAN | ||||||||||||||||||||||||||||||||||||||||||||||||||||||||||||||||||||||||||
|---|---|---|---|---|---|---|---|---|---|---|---|---|---|---|---|---|---|---|---|---|---|---|---|---|---|---|---|---|---|---|---|---|---|---|---|---|---|---|---|---|---|---|---|---|---|---|---|---|---|---|---|---|---|---|---|---|---|---|---|---|---|---|---|---|---|---|---|---|---|---|---|---|---|---|
| ||||||||||||||||||||||||||||||||||||||||||||||||||||||||||||||||||||||||||
Data Processing and Quantification
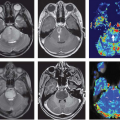
At the University of Michigan, the CT perfusion data are transferred to a dedicated workstation (AW 4.5; GE Medical Systems, Milwaukee, WI) with commercial software CT Perfusion 4 (GE Medical Systems) that uses a deconvolution-based method to further analyze the data. A processing threshold range of −200 (for air) to 120 (for bone) absolute Hounsfield units is chosen to define the processed soft tissue. Then a region of interest (ROI) is manually drawn within the lumen of the contralateral internal carotid artery near the tumor by a radiologist experienced in perfusion imaging. This provides the arterial input function (AIF). This method is preferred over an available autoselect function. Figure 60.2A shows the location of the arterial input function at the right internal carotid artery. The pixels within the ROI show an early rise of attenuation and increased density on the tissue time-intensity curve compared with the adjacent normal tissue. To define the perfusion parameters on the acquired time-intensity curve, an experienced radiologist with expertise in head and neck imaging selects the last pre-enhancement image at the foot of the rising curve (arrowhead, Fig. 60.2B) and defines the time limit of the first pass of the contrast bolus by selecting the last postenhancement image from the first pass at the foot of recirculation rise in the attenuation curve of the tissue (arrow, Fig. 60.2B). Then, the last image of the second phase is defined, which, with the University of Michigan protocol, could generally be the last image of the acquisition (i.e., time point 50). Note that these methods vary from vendor to vendor and may undergo rapid transformation with software upgrades.
 FIGURE 60.2. Arterial input function measurement with time-intensity curve formation in head and neck cancer patients. A: Right internal carotid artery near tongue base in postdynamic-contrast computed tomography is selected to draw small region of interest within the lumen, creating the artery input function. B: Tissue time-intensity curve is generated. |
The perfusion images are coregistered with the postcontrast source images at intermediate transparency in the deconvolution-based software. The tumor is localized on contrast-enhanced CT image by a head and neck radiologist (Fig. 60.3A–C). The suspected pathologic and posttreatment lesions or tumors or lymph nodes are defined by drawing a freehand or elliptical ROI within the suspected lesion (Fig. 60.3C). Care must be exercised to target the solid portion of the mass lesion while avoiding possible necrotic areas and vascular structures. An elliptical ROI similar in size to the intralesional ROI may also be placed over the contralateral posterior paraspinal muscle for baseline control perfusion. The deconvolution-based software calculates four perfusion parameters: blood flow (BF in milliliters per 100 grams of tissue per minute), blood volume (BV in milliliters per 100 grams of soft tissue), mean transit time (MTT in seconds), and permeability–surface area product (PS in milliliters per 100 grams per minute). Color-coded CT perfusion maps are generated for all four parameters (Fig. 60.3D–G) and screenshots are obtained and saved in an image archive.
Clinical Validation
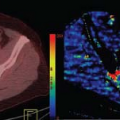
CT perfusion provides a quantitative measure of tumor perfusion and hence may be predictive of intratumoral microvascular density. A few recent studies have been able to correlate CT perfusion findings with histological status
of the head and neck tumor and status of angiogenesis. Ash et al.17 evaluated stage III or IV advanced head and neck squamous cell carcinoma (HNSCC) with CT perfusion and correlated the findings with endoscopic biopsy of the primary tumor site. Intratumoral microvascular density was determined after mouse antihuman CD31 antibody immunostaining. They found positive correlation between vessel count and BF and BV. No significant correlation was found between vessel count and MTT or capillary permeability.
of the head and neck tumor and status of angiogenesis. Ash et al.17 evaluated stage III or IV advanced head and neck squamous cell carcinoma (HNSCC) with CT perfusion and correlated the findings with endoscopic biopsy of the primary tumor site. Intratumoral microvascular density was determined after mouse antihuman CD31 antibody immunostaining. They found positive correlation between vessel count and BF and BV. No significant correlation was found between vessel count and MTT or capillary permeability.
 FIGURE 60.3. A 58-year-old underwent concurrent chemoradiation therapy with cisplatin and finished 35 fractions of radiotherapy for prior left tongue base squamous cell carcinoma with resultant total resolution on posttreatment computed tomography (CT) positron emission tomography (PET). Now presents with left jaw and ear pain. A: Postcontrast neck CT exhibits bulky mildly enhancing soft tissue at left glossotonsillar sulcus extending into left posterior tongue and anterior left tonsillar fossa (arrows). B: Fluorodeoxyglucose (FDG)-PET exhibits intense FDG uptake with a hypermetabolic mass (arrow) in the left glossotonsillar sulcus. C: Elliptical ROIs drawn over (circled) suspected left tongue base mass and over right paraspinal muscle. D: Tissue blood flow (BF) measurement by convolution method exhibits markedly increased BF within the suspected mass. E: Tissue blood volume calculations show increased tissue blood volume (BV) at left side of the tongue base. F: Mean transit time (MTT) is reduced compared with the paraspinal muscle. G: Markedly increased tissue permeability surface product (PS) is seen within the left tongue base mass. |
Hoefling et al.33 performed a retrospective review of head and neck CT perfusion in patients with advanced HNSCC and compared the findings with analysis of biopsy samples for overexpression of high-risk human papillomavirus, p16, and epidermal growth factor receptor. They found significantly lower CP values in pretreatment tumors overexpressing epidermal growth factor receptor. Higher CP values were seen in pretreatment tumors positive for high-risk human papillomavirus and in tumors overexpressing p16.
Bisdas et al.39 found positive correlation between standardized uptake value from CT-PET imaging and tissue CT perfusion indices in patients with histologically confirmed primary or recurrent HNSCC. Figure 60.4A–D shows a supraglottic squamous cell carcinoma with hypermetabolism and hyperperfusion. Veit-Haibach et al.40 compared results of integrated CT perfusion examination with CT-PET study in patients suspected of head and neck cancer to correlate tissue perfusion with metabolic imaging. However, they did not find significant correlation between CT perfusion and PET parameters.
Clinical Applications
Unlike brain tumors, BV is not the most reliable perfusion correlate in head and neck tumors. This may be due to the lacking blood–brain barrier in neck tissue, well-perfused normal mucosal surfaces, and high normal BV of salivary and thyroid glands.16 Tumor angiogenesis leads to elevated BF, BV, and CP and reduced MTT in head and neck malignancies.26,41 These CT perfusion parameters are exploited in various studies to evolve more sensitive,
accurate, and earlier assessment for diagnosis and posttreatment monitoring of head and neck malignancies.
accurate, and earlier assessment for diagnosis and posttreatment monitoring of head and neck malignancies.
 FIGURE 60.4. A 70-year-old smoker presented with 1 year of progressive dysphagia, hoarseness of voice, odynophagia, and weight loss. An invasive, keratinizing, moderately differentiated squamous cell carcinoma was found on biopsy. A: Contrast enhanced neck computed tomography reveals densely enhancing mass involving the lingual surface of the right lateral epiglottis extending in to vallecula (arrow) and the right aryepiglottic fold. B and C: Increased blood volume and blood flow indicate a hyperperfusing malignant mass. D: fluorodeoxyglucose (FDG) positron emission tomography exhibits intense FDG uptake with a hypermetabolic mass at right vallecula (arrow). |
Tumor Differentiation between Benign and Malignant
Gandhi et al.26 obtained baseline CT perfusion data for squamous cell carcinoma (SCC) of upper aerodigestive tract and compared it with CT perfusion data of adjacent normal tissue structures. They found statistically significant reduction in MTT of malignant tissues as compared with normal surrounding neck tissue. Figure 60.5A–C exhibits a supraglottic carcinoma with increased BV and BF. However, Rumboldt et al.16 found significant overlap between CT perfusion parameters of normal salivary and thyroid glands with benign lesions and malignant tumors. It may be challenging to evaluate malignancies arising from these regions based on CT perfusion imaging. They also found MTT to be the best discriminator of malignant and nonmalignant pathologies with all lesions with MTT less than 3.5 seconds being malignant and no malignancies showing MTT of greater than 5.5 seconds. Trojanowska et al.27 found significant differences between soft tissue of neck infiltrated with malignant tumors and noninfiltrated soft tissue, especially with relation to muscles. However, CT perfusion parameters were not significantly different between infiltrated bones and normal bone and infiltrated salivary gland and noninfiltrated salivary gland.
 FIGURE 60.5. A 59-year-old with new onset hoarseness and dysphagia, found to have a transglottic mass on laryngoscopy. Biopsy revealed poorly differentiated squamous cell carcinoma. A: Contrast-enhanced neck computed tomography exhibits moderately enhancing supraglottic mass (arrow) involving the inferior epiglottis extending into the left aryepiglottic fold. B and C: Increased blood volume and blood flow are seen as compared with paraspinal musculature. |
Differentiation between Recurrent Tumors and Posttherapeutic Changes
Angiogenesis is also associated with a recurrent tumor mass in head and neck following chemoradiation therapy. Although routine postcontrast-enhanced CT scan of the neck can exhibit abnormal contrast enhancement in both recurrent masses and tissue with posttherapeutic changes, CT perfusion can help differentiate between the two due to this histopathologic difference (Figs. 60.6A–C and 60.7A–C).
Bisdas et al.28 obtained CT perfusion parameters in patients with known primary and suspected recurrent malignancy of oropharyngeal and oral cavity tumors. They found that the mean BF, BV, and PS values in primary tumors were significantly higher than in normal tissue, while the MTT values were significantly lowered. They also found increased BF in recurrent tumors compared with tissue with posttherapy changes (mean BF: 69.71 vs. 45.31 mL/min/100 g). However, CT perfusion parameters could not differentiate between benign and malignant lymph nodes, and there was no significant correlation between CT perfusion parameters and tumor volume. Figure 60.3 shows a case of recurrent SCC at the tongue base with abnormal CT perfusion parameters.
Treatment Response Monitoring
Gandhi et al.42 performed CT perfusion on patients with stage 3 or 4 advanced SCC of the oropharynx treated with organ preservation therapy, before and 3 weeks after one cycle of induction chemotherapy. Correlation was made with simultaneously performed laryngoscopic findings. Higher pretherapy values of BV significantly correlated with endoscopic tumor response. Reduction in BV (by
>20%) also significantly correlated with clinical response as assessed on endoscopy. This offers potential for noninvasive monitoring of response to induction chemotherapy. However, correlation with BF (decreased), CP (decreased), and MTT (increased) was only fair and not statistically significant.
>20%) also significantly correlated with clinical response as assessed on endoscopy. This offers potential for noninvasive monitoring of response to induction chemotherapy. However, correlation with BF (decreased), CP (decreased), and MTT (increased) was only fair and not statistically significant.
 FIGURE 60.6. A 53-year-old with squamous cell carcinoma of the left tonsil status postchemotherapy and radiation therapy. Locoregional recurrence, status postneck dissection with second round of chemo and radiation. A: Contrast-enhanced neck computed tomography exhibits postsurgical changes in the left neck with an infiltrating mass at the left side of the floor of the mouth, extending from left side of the visceral space (arrow). B and C: Increased blood volume and blood flow indicate hyperperfusing malignant mass. |
Surlan-Popovic et al.29 performed CT perfusion in patients with locoregionally advanced HNSCC before therapy, after 40 Gy, and following completion of chemoradiotherapy. Patients with increased baseline BV exhibited good short-term response.
Treatment Outcomes Prediction
Bisdas et al.43 performed pretreatment CT perfusion, contrast-enhanced CT, and endoscopy in patients with SCC of oropharynx and correlated the data with tumor response by Response Evaluation Criteria in Solid Tumors criteria. They found that pretreatment CT perfusion can predict response after induction chemotherapy, while tumor volume and BF values may predict progression-free survival in advanced SCC of oropharynx.
Bisdas et al.31 also found that pretreatment CT perfusion has prognostic value and can predict outcomes in patients with SCC of the oropharynx, oral cavity, and hypopharynx who had undergone surgical excision and chemoradiation therapy.
Zima et al.32 performed pretreatment CT perfusion and direct laryngoscopy in patients with SCC of the upper aerodigestive tract. Correlation was made with endoscopic tumor evaluation following induction chemotherapy. They found that pretreatment elevation of BV and BF had statistical association with response to induction chemotherapy.
 FIGURE 60.7. A 56-year-old man with a history of a stage III left tonsil squamous cell carcinoma, treated with chemoradiation developed a recurrence and underwent left radical neck dissection. Presents with pain at the angle of the mandible, otalgia, and trismus. A: Contrast-enhanced neck computed tomography reveals an enhancing nodule at the left angle of the mandible with mild asymmetrical thickening at left side of visceral space (arrow). B and C: Increased blood volume and blood flow are seen at the level of enhancing nodule, compatible with recurrence. He was taken to the operating room for resection of the mass, but intraoperatively was found to have tumor encasing the carotid artery, which was unresectable.
Related posts:Stay updated, free articles. Join our Telegram channel
Full access? Get Clinical Tree
 Get Clinical Tree app for offline access

|