Perfusion MR Imaging in Cognitive and Developmental Brain Disorders and Neuropsychiatry
Kay Jann, PhD
Danny J. J. Wang, PhD, MSCE,
John A. Detre, MD
▪ Introduction to Perfusion Imaging Using Arterial Spin Labeling
A Short Summary of ASL Techniques
Since its advent early 1990s, arterial spin labeling (ASL) has evolved into a family of techniques for noninvasive MRI measurement of perfusion including pulsed, continuous, and more recently pseudocontinuous versions.1 In all cases, arterial blood water is magnetically labeled by RF pulses and allowed to flow into the imaging volume, during which time there is a T1 decay of the label. Subtraction of labeled images from control images yields a perfusion-weighted difference image, and absolute cerebral blood flow (CBF) quantification is generally achieved through single- or two-compartment tracer kinetic modeling by primarily taking into account the T1 relaxation of the label.2 Among various ASL techniques, pseudocontinuous ASL (pCASL) has recently emerged as the technique of choice for brain perfusion studies as it merges the advantages of pulsed ASL, including hardware compatibility with current MRI scanners, and the higher tagging efficiency of continuous ASL, which includes a longer tagging bolus and thus higher signal to noise ratio (SNR).3,4 Alternative spin labeling strategies such as velocity-selective ASL have been introduced,5 but thus far have not been applied widely in clinical studies.
The main limitations of ASL that hamper its widespread applications include relatively low SNR given the small fraction of arterial blood (approximately 1%), as well as arterial transit effects whereby labeled spins fail to reach brain tissue by the time of image acquisition. ASL methods derive a dual benefit from high magnetic field strengths.6 In addition to increased sensitivity at high field, T1 also increases, allowing more label to accumulate in brain tissue as well as increased postlabeling delay times to minimize arterial transit effects. ASL methods also benefit from parallel imaging and array receiver coils.7 The use of background suppression (BS) of static tissue signals can also greatly improve the temporal stability8,9 of ASL MRI data, resulting in shorter scan times. Since optimal suppression of static signals occurs at a single timepoint, BS ASL is most compatible with 3D acquisitions such as GRASE (a hybrid of gradient and spin echo) or fast spin echo with a stack-of-spirals readout. As a result, whole-brain perfusion images can be achieved within just a few minutes, with reduced susceptibility artifacts compared to conventional ASL sequences using gradient-recalled echo planar imaging (EPI) or spiral scans. One potential shortcoming of 3D ASL acquisitions, however, is the spatial blurring due to modulations of k-space signals by the T2 relaxation curve, especially along the z-direction. With single-shot acquisitions, the full-width-at-half-maximum of the point spread function is on the order of 1.3 to 1.5 pixels along the slice direction.10 Therefore, trade-offs have to be made between achieving adequate temporal and spatial resolutions using single- or multishot 3D acquisitions. The recent ASL white paper11 recommended “pseudocontinuous labeling, background suppression, and a segmented 3D readout without vascular crushing gradients” as preferred implementation of ASL for clinical applications.
Quantitative Resting CBF Using ASL
Methodologically, ASL is similar to 15O-water PET. Nevertheless, the arterial input function (AIF) can be explicitly defined by the duration and amplitude of the labeling RF pulses in ASL, whereas in general, an arterial line has to be inserted to sample AIF in PET studies. This factor greatly facilitates the absolute quantification of CBF using ASL. ASL MRI measurements of CBF have been shown to correlate closely with PET CBF both at rest12 and with task activation.13 A small study conducted in six elderly subjects has evaluated the accuracy of pCASL with 3D BS SPIRAL readout by comparison with H215O PET-CBF scans.14 The cross-modality perfusion imaging comparison yielded very good global and regional agreement in global gray matter (r = 0.742, p < 0.091) and the posterior cingulate cortex (PCC) (r = 0.789, p < 0.057). A recent study15 compared two pCASL sequences, using 2D gradient-echo EPI and 3D GRASE as the readout, respectively, versus the gold standard of H215O PET in 8 elderly subjects. When compared to PET, EPI and GRASE pCASL showed a comparably high degree of spatial correlation across brain pixels (pCASL EPI r = 0.53, SD = 0.06, p < 0.001; pCASL GRASE r = 0.51, SD= 0.08, p < 0.001). Another recent study investigated the accuracy and precision of pCASL during baseline and hypercapnia by head-to-head comparison with H215O PET in 16 healthy volunteers.16 In general, intra- and intersession repeatabilities were comparable for both modalities during both conditions. Importantly, cerebrovascular reactivity (CVR) as measured by pCASL in combination with a hypercapnia challenge was proven to be in quantitative agreement with similar CVR measurements by 15O-H2O.
With the advent of MR-PET scanners, it is now feasible to conduct concurrent ASL/PET scanning. A recent concurrent PET/MRI
study17 demonstrated an excellent agreement (r = 0.70) between 15O-water PET and pCASL although a quadratic rather than linear function was used for fitting the relationship of two CBF measurements. Part of the discrepancy at the high range of CBF values may be attributed to the relatively short postlabeling delay of 1 second employed for pCASL scans (resulting in focal intravascular intensities). Taken together, recent studies comparing pCASL and PET CBF scans suggest an overall high correlation between the two modalities, paving the way for quantitative usage of pCASL MRI in both clinical and research settings.
study17 demonstrated an excellent agreement (r = 0.70) between 15O-water PET and pCASL although a quadratic rather than linear function was used for fitting the relationship of two CBF measurements. Part of the discrepancy at the high range of CBF values may be attributed to the relatively short postlabeling delay of 1 second employed for pCASL scans (resulting in focal intravascular intensities). Taken together, recent studies comparing pCASL and PET CBF scans suggest an overall high correlation between the two modalities, paving the way for quantitative usage of pCASL MRI in both clinical and research settings.
Comparison of ASL CBF and PET CMRglc
Both regional cerebral perfusion and metabolism are closely coupled to neural activity and are important surrogate markers of brain function. FDG-PET remains the standard method for measuring the cerebral metabolic rate of glucose (CMRglc). There has been growing interest in comparing ASL CBF with FDG-PET measurement of CMRglc. Newberg and colleagues performed concurrent ASL measurements and 18F-FDG uptake during a visual stimulation task to show the correlation between CBF and CMRglc. The correlation was high within the middle ranges of perfusion and metabolism but dropped off at higher perfusion rates. ASL was more sensitive in showing changes in the visual cortex driven by the stimuli, but PET showed relatively higher signal in the basal ganglia.18 Discrepancies between ASL and PET in cortical versus deep gray matter may be attributable, in part, to attenuation correction procedures required for PET but not for MRI.
In a recent study,19 we compared resting state cerebral perfusion using pCASL and cerebral glucose metabolism using 18F-FDG PET in 20 normal volunteers. In whole-brain analysis, greater regional metabolism relative to perfusion was observed in the caudate, medial prefrontal, and temporal lobes, whereas perfusion was relatively higher in the hippocampus and cerebellum. In a regionof-interest analysis, the overall mean correlation between perfusion and metabolism across voxels was r = 0.60 with regional variability. Cross-voxel correlations between perfusion and metabolism in mean ASL and PET images of all 20 subjects were the highest in the striatum (caudate: r = 0.81; putamen: r = 0.86) and lowest in medial temporal structures (amygdala: r = 0.31; hippocampus: r = -0.05). Figure 16.1 shows the mean PET CMRglc and ASL CBF maps of the 20 normal subjects. While an overall high correlation was observed between the two modalities, there was also regional variability.
 Figure 16-1. Mean CMRGlc (PET) (A) and mean CBF (ASL) (B) from 20 normal subjects. CBF images are normalized to a standard MNI152 T1 template while CMRGlc images to an MNI PET template and are presented in sequential slices from vertex to skull base. |
▪ Concepts of Resting Brain Function
As described above, ASL provides a noninvasive approach for measuring regional brain function that yields comparable results to standard PET and SPECT measurements. Due to its quantitative nature, ASL offers an ideal tool to assess the brain’s resting state both globally and regionally. Baseline brain function, representing “trait” or “state” effects, is a fundamental aspect of brain function as 70% to 80% of the metabolic demand is consumed for maintaining this baseline state,20 while task-induced deviations from this state commonly assessed in fMRI investigations consume a much smaller fraction of the brain’s energy. Moreover, the level of baseline perfusion has been shown to modulate the degree of task-induced signal changes.21,22 and 23 Hence, to better understand interindividual differences and specifically impairments in cognitive functioning in disease, it is crucial to understand the basic metabolic activity of the brain, and understanding the brain’s baseline organization has thus become a major research focus in the past decade.
To this end, efforts to identify regional alterations in baseline metabolism related to clinical syndromes have also been paralleled by attempts to understand the brain as an interconnected system rather than individual brain areas that serve specific functions. This emerging trend in clinical neuroscience and psychiatry has been driven by the concept that cognitive functions of the brain can be thought of as implemented in complex networks optimized both for segregated and distributed information processing. Modern brain imaging methods such as positron emission tomography (PET) and functional magnetic resonance imaging (fMRI) have revealed a variety of distinct functionally connected networks (FCNs, functional connectivity [FC] defined as coherent signal
intensity fluctuations) underlying human cognition and perception. FCNs representing motor, auditory, and visual systems as well as higher cognitive functions like attention and working memory have been repeatedly described.24,25,26,27 and 28 A major and intensely studied FCN is the so-called default mode network (DMN), initially identified in PET data as areas that exhibited consistently greater metabolic activity at baseline and less metabolic activity during task execution.29 Although historically the first reports of FCNs have been based on PET perfusion, oxygen, and glucose metabolism data sets, functional network analysis is currently almost exclusively performed using fMRI blood oxygenation level-dependent (BOLD) signal data where networks are identified by their correlated low-frequency signals.30 However, such BOLD connectivity measures are also highly susceptible to motion effects,31 and since the BOLD signal relies on changes in the ratio of blood oxygenation between two distinct neuronal states and is modulated by multiple physiologic factors such as cerebral blood flow (CBF), cerebral blood volume (CBV), and cerebral metabolic rate of oxygen (CMRO2),32,33 quantitative (i.e., absolute) measures of network activity remain challenging. As outlined in the section above, recent methodologic advances in ASL yield reproducible, absolute, and quantitative values of CBF comparable to the results obtained with H215O PET.34 It allows for repeated acquisitions since no exposure to radioactivity is required, and it provides a temporal resolution on the order of a few seconds. Furthermore, temporal correlations used to identify brain networks tend to occur over long timescales for which ASL provides significant signal stability advantages over BOLD fMRI.35 Accordingly, there is strong interest in the use of ASL MRI as a means of quantifying network activity in the brain.
intensity fluctuations) underlying human cognition and perception. FCNs representing motor, auditory, and visual systems as well as higher cognitive functions like attention and working memory have been repeatedly described.24,25,26,27 and 28 A major and intensely studied FCN is the so-called default mode network (DMN), initially identified in PET data as areas that exhibited consistently greater metabolic activity at baseline and less metabolic activity during task execution.29 Although historically the first reports of FCNs have been based on PET perfusion, oxygen, and glucose metabolism data sets, functional network analysis is currently almost exclusively performed using fMRI blood oxygenation level-dependent (BOLD) signal data where networks are identified by their correlated low-frequency signals.30 However, such BOLD connectivity measures are also highly susceptible to motion effects,31 and since the BOLD signal relies on changes in the ratio of blood oxygenation between two distinct neuronal states and is modulated by multiple physiologic factors such as cerebral blood flow (CBF), cerebral blood volume (CBV), and cerebral metabolic rate of oxygen (CMRO2),32,33 quantitative (i.e., absolute) measures of network activity remain challenging. As outlined in the section above, recent methodologic advances in ASL yield reproducible, absolute, and quantitative values of CBF comparable to the results obtained with H215O PET.34 It allows for repeated acquisitions since no exposure to radioactivity is required, and it provides a temporal resolution on the order of a few seconds. Furthermore, temporal correlations used to identify brain networks tend to occur over long timescales for which ASL provides significant signal stability advantages over BOLD fMRI.35 Accordingly, there is strong interest in the use of ASL MRI as a means of quantifying network activity in the brain.
 Figure 16-2. Illustration of the similarity of the spatial pattern of BOLD (red-yellow) and CBF (blue-green) based functionally connected networks overlaid on a 3D rendered brain. Modality-specific group networks were computed as one-sample t-test across the specific single-subject maps. Default mode network (DMN), left and right executive control networks (L/RECNs), occipital visual network (OVN), and auditory network (AUN). |
To date, however, only a handful of studies have demonstrated the feasibility to identify ASL-FCNs36,37,38 and 39 mainly due to the relatively low sensitivity and temporal resolution of ASL scans. In a recent study, we systematically investigated similarity of ASL and BOLD networks as well as their reliability across time and scanners,27 by taking advantage of the improved sensitivity of pCASL with 3D BS GRASE. ASL and BOLD produced spatially highly similar FCNs as displayed in Figure 16.2. The test-retest reliability of these FCNs indicated by intraclass correlation coefficients (ICC) yielded to be excellent in BOLD (average ICC across networks: 0.905 ± 0.033 between sessions; 0.885 ± 0.052 between scanners) while lower but still adequate in CBF networks (0.545 ± 0.048/0.575 ± 0.059). Nevertheless, ASL provided highly reproducible networkspecific CBF measures (ICC = 0.956 ± 0.010 between sessions; 0.939 ± 0.026 between scanners). The question remains of how
these networks’ baseline metabolic activity and the integrity of their functional organization are intercorrelated and whether they could provide estimates of the energy costs of maintaining their function.40,41
these networks’ baseline metabolic activity and the integrity of their functional organization are intercorrelated and whether they could provide estimates of the energy costs of maintaining their function.40,41
▪ ASL in Developmental and Neuropsychiatric Disorders
Although recent advantages in perfusion-based fMRI using ASL allow reliable and repetitive quantitative CBF measurements during both baseline and task activation, this noninvasive, emerging technique is also starting to be applied in developmental and clinical neuroscience. In the following section, we provide an overview of the recent research findings along with their implications for the future of ASL perfusion imaging in neuropsychiatric research. We first focus on developmental changes in CBF, since a wide variety of psychiatric disorders are considered to be developmental disorders that emerge during brain maturation—a critical phase that could lead to cognitive, emotional, and other deficits and clinical symptomatology. Thereafter, we overview some of the most common developmental and psychiatric syndromes based on their prevalence, recapitulate the observed symptoms, and describe their underlying neurophysiologic alterations as identified by perfusion neuroimaging. The next section will then highlight the unique capabilities of ASL for monitoring treatment effects along with its use for personalized treatment selection based on the likelihood of the individual’s response to one treatment or another.
Normal CBF Development
Significant progress has been made in the computational morphometric analysis of structural MRI. Two major neurodevelopmental trends have been revealed by brain structural analyses, including a continuous increase in the volume of white matter (WM) with age that has been attributed to myelination and improved connectivity between brain regions42,43 and an inverted U-shaped function for age-related variations in gray matter (GM), thought to be the result of “pruning” of excitatory synaptic connections.43,44 and 45 Several longitudinal imaging studies44,45 reported a sequential maturation from lower-order sensorimotor to higher-order association cortices. Pediatric ASL studies demonstrated an age-related increase of CBF from neonates to toddlers, followed by tapering of CBF from childhood to adulthood.46,47,48 and 49 This developmental trajectory of CBF is generally consistent with existing literature based on nuclear medicine approaches.50,51 A recent study looking at regional CBF with adjustment of variations in GM density (GMD) showed that the relationship between GMD-adjusted CBF and age can be characterized by an inverted U-shape followed by a U-shaped trajectory in most brain regions throughout childhood and adolescence.52,53
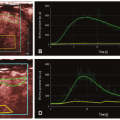
 Figure 16-3. Results of sex differences of GM area-adjusted CBF in brain development. The time courses of CBF obtained from regression analysis in each ROI with significant sex difference are overlaid onto parcellated cortical surfaces (boy: blue; girl: red). A and B: Lateral views of the right and left hemisphere. |
In order to reliably apply ASL for tracking developmental trajectory of CBF, the accuracy and longitudinal repeatability of ASL perfusion MRI needs to be established in children. In a recent study, we performed pCASL perfusion MRI in 22 healthy children aged 7 to 17 years using repeated scans 2 to 4 weeks apart.54 By taking into account developmental changes of key physiologic parameters (e.g., blood T1), the accuracy of pCASL against the reference standard of phase-contrast (PC) MRI measured by ICC was 0.65. CBF measurements using pCASL demonstrated a good level of longitudinal repeatability (ICC = 0.65, within-subject coefficient of variance/wsCV = 14%). This study laid a solid foundation for quantitative CBF mapping in typically developing populations as well as children with neurodevelopmental disorders.
Recently, we performed a joint analysis of perfusion and structural MR data in 82 children (40 boys and 42 girls) aged 7 to 17 years old.55 For structural MR images, we applied a cortical reconstruction algorithm that provides accurate and efficient reconstruction of cortical surfaces and automatically parcellated them into 24 gyral regions based on the LPBA40 atlas. To correct for GM volumes due to partial volume effects, CBF values in each region of interest (ROI) were normalized by the corresponding surface area, which accounts for the extent of folding in each ROI. At each gyral region, we then applied multiple regression analysis using the GM area-adjusted CBF with respect to age and gender. After the correction for multiple comparisons with the control of false discovery rate, widespread sex differences were detected throughout the cortex on both hemispheres as shown in Figure 16.3. The results show that there is typically an inverted U-shape of the GM area-adjusted CBF measures across the brain regions, which is consistent with prior studies demonstrating synaptic pruning during brain development. In regions with significant sex differences, the results show that there is a delay of the CBF time course in boys (vs. girls) during the earlier stages of brain development. With brain maturation, the
CBF of boys and girls eventually converges to similar levels. These results demonstrate that GM area-adjusted CBF measure is a highly sensitive measure that allows the identification of the trajectory and sex differences in typical brain development.
CBF of boys and girls eventually converges to similar levels. These results demonstrate that GM area-adjusted CBF measure is a highly sensitive measure that allows the identification of the trajectory and sex differences in typical brain development.
Neuropsychiatry
Mood Disorders
The most common mood disorder is depression, which is a leading cause of disability affecting 7% to 18% of the population at least once in their life, with an estimated total of 350 million people of all ages suffering from depression worldwide (source WHO). Women are at a higher risk of developing depressive symptoms than are men. There are at least two subtypes of depression that can be distinguished based on the episodes of depressed states. Unipolar depression is characterized by depressed mood, loss of interest and enjoyment, and reduced energy leading to diminished activity and, in more severe cases, anxiety symptoms, disturbed sleep and appetite, and often also feelings of guilt or low self-esteem. In the most severe cases, suicidal ideation occurs. The second subtype is bipolar mood disorder, which typically consists of both manic and depressive episodes separated by periods of normal mood. Manic episodes involve elevated or irritable mood, overactivity, pressured speech, inflated self-esteem, and a decreased need for sleep. Depressed episodes are similar between unipolar and bipolar depression, which poses a major challenge for differential diagnosis, since treatment strategies differ. Therefore, additional markers of each disease are needed. Functional neuroimaging may provide such disease markers. However, to date, very little work in bipolar disorder or other subtypes of mood disorders has been carried out. Therefore, this subsection will focus on findings in unipolar depression.
ASL perfusion studies have delineated the involvement of frontolimbic-cingulate-striatal networks in states of depression, which is consistent with earlier PET and SPECT research. While frontal areas mainly support executive functions, error monitoring, and regulation of emotion, the limbic-striatal network is associated with affect, emotion, and stress. More specifically, dorsolateral prefrontal cortex (dlPFC) and anterior cingulate cortex (ACC) show reduced CBF in depression, whereas the amygdalae, the subgenual ACC (sACC), the posterior cingulate cortex (PCC), and the basal ganglia show hyperperfusion.56,57,58 and 59 Moreover, Lui et al.59 found that patients responding to medical treatment show increased CBF in the limbic network while nonresponders present with frontal hypoperfusion only. Antidepressant medication administered in healthy controls during ASL reduced CBF in serotonergic pathways, that is, the limbic-striatal network including amygdala, insula, and orbitofrontal cortex,60 areas where only responders exhibit increased CBF but not nonresponders.59 This is in agreement with the findings of Järnum,61 who reported perpetual hyperperfusion in frontal lobes and ACC in nonremitting depression. Weiduschat et al.62 further reported that baseline dlPFC perfusion could predict response to repetitive transcranial magnetic stimulation (rTMS) although they did not see an increase of CBF after treatment in this area. These preliminary findings demonstrate the potential use of ASL to characterize behavioral or pharmacologic states and to predict or monitor patients’ response to standard medical or alternative treatments. Ultimately, such approaches may be used for treatment selection in individual patients. ASL has also been used to investigate genetic polymorphisms of the serotonin receptor in healthy subjects as it plays a critical role in mood disorders,63 demonstrating genotype-associated alterations of baseline perfusion in the amygdala and ventromedial prefrontal cortex (PFC), areas critical in emotion regulation.
 Figure 16-4. Default mode network based on ASL cerebral blood flow in patients with depression and control subjects. (Adapted from Orosz A, et al. Reduced cerebral blood flow within the default-mode network and within total gray matter in major depression. Brain Connect 2012;2(6):303-310.) |
We recently performed an FC analysis of ASL data to assess perfusion differences in the DMN in major depression.64 This network is involved in self-referential processes and has repeatedly been shown to show alterations in its integrity in depression using BOLD fMRI65,66 and is thought to be involved in rumination.67 Furthermore, the DMN comprises nodes that have altered perfusion (in depression), including the ACC and the PCC as described above. We found reduced perfusion in the DMN in depressed patients compared to healthy controls, which, however, vanished after correcting for global CBF differences. Nevertheless, PCC perfusion showed an inverse relation with depression severity. Moreover nonresponders showed reduced DMN perfusion as compared to responders, which might indicate that antidepressant treatment does not act on this specific network, in line with the findings discussed above (Fig. 16.4).
Related posts:
 Vascular Anatomy and Microanatomy
 CT and MR Contrast-Enhanced Tissue Perfusion Imaging: Basic Methodology, Postprocessing, Reliability Testing
 Myocardial Perfusion Imaging: MR Techniques
 Myocardial Perfusion Imaging with PET/SPECT: Techniques and Clinical Applications
 Ultrasound Perfusion Imaging: Techniques and Analytical Methods
 Contrast-Enhanced Ultrasound: Clinical Applications
Stay updated, free articles. Join our Telegram channel

Full access? Get Clinical Tree


