Perfusion Profiles for Favorable and Unfavorable Outcomes
Maarten G. Lansberg
Nishant K. Mishra
Soren Christensen
Bruce C.V. Campbell
Background
Ischemic Core and Penumbra
The purpose of acute stroke therapy is to recanalize an occluded blood vessel, thereby restoring blood flow to critically hypoperfused brain parenchyma before it is irreversibly injured.1 Salvage of brain parenchyma in this manner is believed to be associated with improved outcomes. The term ischemic penumbra is used to describe the critically hypoperfused brain parenchyma, which survives when reperfusion is established in a timely fashion but otherwise proceeds to infarction (Fig. 43.1).2 The penumbra is characterized by cerebral blood flow (CBF) rates between 5 and 22 mL/100 g/min. The exact CBF threshold within this range depends on the type of tissue that is involved and the duration of ischemia, with lower thresholds for gray matter compared to white matter and when the duration of ischemia is prolonged. It is generally believed that patients who are most likely to benefit from restoration of blood flow have a relatively small volume of irreversibly damaged brain tissue (ischemic core) and a large volume of reversible ischemic injury (ischemic penumbra).2,3
 FIGURE 43.1. A visual representation of the ischemic core and penumbra. The artery shown in black represents the middle cerebral artery with a proximal occlusion. As a result there is reduced cerebral blood flow in the middle cerebral artery territory (green region). In this specific example, the reduction of the cerebral blood flow varies spatially, with the most severe reduction of cerebral blood flow in the core and the mildest reduction of cerebral blood flow in the periphery. As a result, the brain tissue at the core of the ischemic territory sustains irreversibly injury quickly (ischemic core is the small white circle at center). The peripheral region, where cerebral blood flow is only mildly reduced, is functionally impaired but remains viable if perfusion is restored in a timely fashion (ischemic penumbra, the larger green ring at the periphery). |
The volume of penumbral tissue gradually shrinks over time (i.e., the ischemic core expands into the penumbral zone); this model is consistent with the results of meta-analyses of tissue plasminogen activator (tPA) trials that have shown that the benefit from tPA gradually diminishes with later treatment times.4,5 The odds ratio (OR) for a good clinical outcome with tPA diminishes with longer onset-to-treatment times: The OR is 2.8 (95% confidence interval [CI]: 1.8 to 4.5) when tPA treatment is begun between 0 to 90 minutes after symptom onset, 1.6 (95% CI: 1.1 to 2.2) for 91 to 180 minutes, 1.4 (95% CI: 1.1 to 1.9) for 181 to 270 minutes, and 1.2 (95% CI: 0.9 to 1.5) for 271 to 360 minutes in patients who are not selected based on penumbra imaging profiles (Fig. 43.2).5 The European Co-operative Acute Stroke Study (ECASS) III has confirmed that tPA treatment is efficacious in ischemic stroke patients if given up to 4.5 hours after symptom onset. Based on these studies, intravenous tPA is only recommended for patients who can receive treatment within 4.5 hours after symptom onset. This short time window limits the number of stroke patients who are eligible for intravenous tPA therapy to just a small percentage of all stroke patients.6
 FIGURE 43.2. The odds ratio for a good functional outcome (modified Rankin scale score of 0 to 1, indicating no or minimal symptoms, at 90 days poststroke) in patients treated with tissue plasminogen activator (tPA) compared with patients treated with placebo as a function of time from symptom onset to the start of tPA treatment. CI: confidence interval. (Adapted from Lees KR, Bluhmki E, von Kummer R, et al. Time to treatment with intravenous alteplase and outcome in stroke: an updated pooled analysis of ECASS, ATLANTIS, NINDS, and EPITHET trials. Lancet. 2010;375:1695–1703.) |
It should, however, be noted that while recruitment of penumbra into the ischemic core occurs gradually in a time-dependent fashion, time alone is not a perfect surrogate for the presence of salvageable brain tissue. Ischemic lesion growth follows different trajectories among patients. In some patients, the ischemic penumbra rapidly progresses
to infarction, while in others with less severe reductions in CBF, the progression to infarction is slower.7,8,9
to infarction, while in others with less severe reductions in CBF, the progression to infarction is slower.7,8,9
Recent advances in acute stroke imaging have provided the ability to visualize the presence of penumbral tissue (tissue with a high risk of infarction in the absence of reperfusion) in the acute stroke setting. As a result, it is conceivable that treatment decisions based solely on time criteria will gradually be phased out and will be replaced by individualized (i.e., patient-specific) treatment decisions based on the presence or absence of penumbral tissue. This chapter describes how magnetic resonance imaging (MRI) and computed tomography (CT)-based criteria can be used to select patients for acute stroke interventions that are aimed at restoring CBF.
Mismatch Hypothesis
The mismatch hypothesis is the widely accepted notion that patients benefit from reperfusion if the volume of critically hypoperfused tissue is greater than the volume of irreversibly injured tissue (the ischemic core). The difference, or “mismatch,” between these two volumes is the putative ischemic penumbra.10
Mismatch-guided thrombolysis in the delayed time window (>4.5 hours after symptom onset) is currently not recommended for routine clinical practice.11 However, some centers have gained clinical experience with the use of mismatch for patient selection. For example, three German centers have reported tPA treatment of MRI-selected middle cerebral artery (MCA) stroke patients (N = 174) up to 6 hours after symptom onset. These centers report a greater odds of favorable outcome (modified Rankin scale 0 to 1 on day 90) with thrombolysis among MRI-selected patients (48%) compared with historical controls treated with placebo (33%; p <.001; OR 1.82; 95% CI: 1.32 to 2.51) or treated with tPA (40%; p = .046; OR 1.39; 95% CI: 1.01 to 1.92). The rate of symptomatic hemorrhage was 3% in MRI-selected tPA patients, which was lower than historical controls treated with tPA (8%; p = .01) and comparable to placebo controls (2%; p = .4).12 In contrast, a meta-analysis of data from the DIAS (Desmoteplase in Acute Ischemic Stroke), DIAS II, DEFUSE (Diffusion and Perfusion Imaging Evaluation for Understanding Stroke Evolution), DEDAS (Dose Escalation of Desmoteplase in Acute Stroke), and EPITHET (Echoplanar Imaging Thrombolysis Evaluation Trial) studies failed to show improved clinical outcomes in mismatch patients treated with thrombolysis compared to nonmismatch patients.11 Based on the results of this meta-analysis, the authors concluded that better mismatch criteria need to be established and validated in phase 3 trials.11
Cerebral Perfusion Imaging
Cerebral perfusion refers to capillary level blood flow. The term perfusion imaging covers various techniques to measure tissue perfusion. Although various imaging tools are available to measure cerebral hemodynamics, here the focus is only on bolus tracking perfusion imaging with MRI or CT, as this is the most widely used technique currently available to stroke physicians.13,14,15 Both MR perfusion and CT bolus tracking studies (i.e., dynamic susceptibility contrast [DSC] perfusion imaging and CT perfusion [CTP] imaging) involve obtaining serial scans during a 1- to 2-minute interval following the injection of an intravenous contrast bolus. Dynamic signal-time course data recorded from the time-resolved imaging data are transformed into a tissue-concentration time-course for each voxel. The hemodynamic parameters of interest, mean transit time (MTT), cerebral blood volume (CBV), cerebral blood flow (CBF), time to peak (TTP), and time to peak of the residue function (Tmax) are derived from the tissue-concentration time curves and for some of the parameters also the arterial input function (AIF) (see Chapter 26).
Assessment of the Ischemic Penumbra
Multiple studies have been conducted to define imaging parameters that optimally identify the ischemic penumbra.16,17,18 These studies have identified thresholds that differentiate penumbra from benign oligemia and studies that differentiate the ischemic core from the penumbra. The CBF threshold that differentiates penumbra from benign oligemia is thought to fall between 14 and 22 mL/100 g/min.19,20,21,22 The CBF threshold that differentiates the ischemic core from the penumbra is time dependent. At very low CBF levels (e.g., below 5 mL/100 g/min), tissue infarction ensues quickly.23,24 At higher CBF levels, tissue may remain viable for hours before infarction ensues.24,25,26,27,28
Demarcating Critically Hypoperfused Tissue on CT and MR
In clinical practice, TTP, Tmax, or MTT maps derived from bolus tracking perfusion imaging are typically used to demarcate the region of critical hypoperfusion.27 These maps can be calculated on both CT and MRI, although image noise and contrast differences between tissue and vessel differ somewhat between these two modalities.29
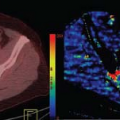
The perfusion parameter on the baseline scan that optimally predicts the final infarct is typically determined with a voxel-based method using perfusion images obtained at baseline co-registered with fluid-attenuated inversion recovery (FLAIR) images obtained at a later follow-up time point in patients who did not experience reperfusion of the ischemic brain tissue (Fig. 43.3). An alternative method involves correlating perfusion lesion volumes on the baseline scan with final infarct volumes assessed on a later follow-up MRI without co-registration. Instead of using the
final infarct as the gold standard, some studies have used positron emission topography (PET) CBF (<16 to 18 mL/100 g/min) as their reference to determine the CT or MRI perfusion parameter thresholds that optimally differentiate benign oligemia from the ischemic penumbra.30,31
final infarct as the gold standard, some studies have used positron emission topography (PET) CBF (<16 to 18 mL/100 g/min) as their reference to determine the CT or MRI perfusion parameter thresholds that optimally differentiate benign oligemia from the ischemic penumbra.30,31
 FIGURE 43.3. A graphical illustration of models used to determine optimal imaging parameters of the ischemic penumbra and core. The top oval represents the brain imaged at baseline and the bottom ovals represent the brain imaged at late follow-up. The white circles on the bottom ovals (fluid-attenuated inversion recovery [FLAIR]) represent the final infarcts assessed with FLAIR imaging at late follow-up. The arrow on the left represents an animal or human model with permanent occlusion of a cerebral blood vessel. This model is suitable for assessing the optimal imaging parameter that demarcates the outer border of the penumbra (i.e., the border between the ischemic penumbra and benign oligemia). In this permanent occlusion model, the optimal threshold for the outer border of the penumbra is defined as the baseline imaging parameter that identifies tissue that corresponds most closely with the final infarct (the green oval on baseline imaging indicated with magnetic resonance perfusion) in case no reperfusion happens. The arrow on the right represents an animal or human model with temporary occlusion of a cerebral blood vessel. This model is suitable for assessing the optimal imaging parameter that demarcates the inner border of the penumbra (i.e., the border between the ischemic core and the penumbra). In this temporary occlusion model, the optimal threshold for the inner border of the penumbra is defined as the baseline imaging parameter that identifies tissue that corresponds most closely with the final infarct (the white circle on baseline imaging indicated with diffusion-weighted imaging [DWI]) in case of full reperfusion. Obviously, for situations of partial restoration of blood flow or collateral flow the patterns will be less simplistic. PWI, perfusion-weighted imaging. |
A post hoc analysis of the DEFUSE data showed that a Tmax threshold between 4 and 6 seconds was optimal for early identification of critically hypoperfused tissue.32 Multiple other studies have been conducted that have also reported on optimal perfusion criteria for identification of critically hypoperfused tissue30,32,33,34,35,36,37,38,39,40,41,42,43,44 (Table 43.1). These studies have produced heterogeneous results, in part because optimal perfusion parameters and thresholds differ based on the postprocessing method that is used.45
TABLE 43.1 IMAGING CRITERIA FOR IDENTIFICATION of CRITICALLY HYPOPERFUSED TISSUE | ||||||||||||||||||||||||||||||||||||||||||||||||||||||||||||||||||||||||||||||||||||||||||||||||||||
|---|---|---|---|---|---|---|---|---|---|---|---|---|---|---|---|---|---|---|---|---|---|---|---|---|---|---|---|---|---|---|---|---|---|---|---|---|---|---|---|---|---|---|---|---|---|---|---|---|---|---|---|---|---|---|---|---|---|---|---|---|---|---|---|---|---|---|---|---|---|---|---|---|---|---|---|---|---|---|---|---|---|---|---|---|---|---|---|---|---|---|---|---|---|---|---|---|---|---|---|---|
| ||||||||||||||||||||||||||||||||||||||||||||||||||||||||||||||||||||||||||||||||||||||||||||||||||||
Different perfusion parameters and thresholds have a major impact on the measured volume of the perfusion lesion and, therefore, on mismatch classification and ultimately trial outcomes. Penumbral definitions with near normal perfusion levels will provide large volumes of “penumbral” tissue, while strict definitions of what is considered penumbral will provide small volume estimates of penumbral tissue. Although no single threshold perfectly distinguishes penumbral tissue from benign hypoperfusion, thresholds can provide a reasonable estimate of the volume of critically hypoperfused tissue.46,47
Demarcating the Ischemic Core
Animal experiments designed to assess imaging parameters that can identify the ischemic core are typically based on transient occlusion models. In these experiments, a baseline imaging study is obtained while the cerebral artery is occluded. Perfusion is then restored by removing the occlusive device. Either histologic assessment or a follow-up imaging study is obtained after several days to assess the extent of the ischemic injury (Fig. 43.3). In these animal experiments, the optimal marker of the ischemic core is the imaging parameter on the baseline scan that best predicts the final infarct.48
The analogous human studies that have assessed imaging markers of the ischemic core have relied on stroke patients with an arterial occlusion on baseline imaging who subsequently undergo stroke therapy that results in reperfusion. A follow-up scan is obtained several days to months after stroke onset to assess the final infarct in these patients. The final infarct is superimposed on the baseline scan to determine the imaging parameters that are optimal for identifying the ischemic core. One challenge with this approach is choosing the optimal time for the follow-up scan. When the follow-up scan is obtained early on (days to weeks after stroke), edema inflates the volume of the apparent infarct, whereas on later follow-up scans (weeks to months after stroke), atrophy leads to an underestimation of the infarct volume.
MR-Based Methods
Experiments with cat stroke models in the 1990s demonstrated that acute ischemic injury results in a reduction of the apparent diffusion coefficient.49 on MRI, this can be visualized as a hypointense lesion on the apparent diffusion constant (ADC) map and a hyperintense lesion on diffusion-weighted imaging (DWI). There is convincing evidence that the DWI lesion corresponds with the ischemic core in stroke patients who undergo an MRI scan in the typical acute time window (i.e., between 3 and 12 hours after symptom onset). In the acute stroke patient, the optimal ADC threshold that corresponds with the ischemic core is around 600 to 625 × 10−6 mm2/s.50 Tissue with higher ADC values may show subtle hyperintensity on DWI but is often not irreversibly injured and may survive with early reperfusion. It should be noted, however, that the volume of tissue that is hyperintense on DWI and has ADC values above 625 × 10−6 mm2/s is typically very small. Thus, in patients with acute stroke, the visually apparent hyperintense DWI lesion closely approximates the ischemic core.
In contrast to the notion that the DWI lesion closely approximates the ischemic core, an early study has suggested that a substantial portion of the DWI lesion can survive with early reperfusion.27 In a systematic review, comprising 18 studies, the median diffusion lesion reversal rate was 22% (range 0% to 83%).51 More recent studies, however, have shown that substantial DWI reversal does not occur; a post hoc analysis of the EPITHET data showed that apparent DWI reversal can generally be attributed to infarct atrophy and co-registration artifacts. True reversal of initially hyperintense DWI lesions was rare and limited to small portions of the DWI lesion.52 A pooled analysis of data from the DEFUSE and EPITHET studies (n = 119) indicated that diffusion reversal in clinically relevant lesions is uncommon and limited to insignificantly small volumes of brain tissue.53 After correcting for atrophy and co-registration artifacts, only 6.7% (8 of 119) of patients were found to have true diffusion lesion reversal, and the median volume of diffusion lesion reversal was only 1.5 mL (compared with 4.4 mL prior to correction).53
Related posts:


Stay updated, free articles. Join our Telegram channel

Full access? Get Clinical Tree


