- •
Cardiovascular magnetic resonance (CMR) first-pass perfusion has developed considerably in recent years, showing good results in single- and multicenter trials.
- •
CMR first-pass perfusion provides high spatial resolution images of myocardial ischemia, allowing regional myocardial perfusion assessment and separate visualization of both sub-endocardial and subepicardial layers.
- •
CMR first-pass perfusion is more sensitive than dobutamine stress test in the detection of ischemia, as it is aimed toward the imaging of blood flow, which is first reduced in the progression of the ischemic cascade.
- •
Adenosine-stress CMR first-pass perfusion is safe; the side effects of adenosine are usually mild and fully reversible.
- •
The absence of ionizing radiation and noninvasive nature of the method make it the optimal clinical tool for repetitive evaluations of the patients during follow-up.
- •
First-pass perfusion imaging can be combined with detailed assessment of myocardial function and viability.
The basic principle of CMR perfusion imaging is that the first myocardial passage of a contrast agent is visualized rapidly (i.e., every heart beat). Consequently this technique is called first-pass perfusion imaging . The contrast agents used are based on gadolinium, which shortens the time magnetization required to recover to normal after being partially used for imaging. This is also called T1 relaxation. In the imaging sequences used, a shorter T1 leads to a stronger signal and thus a brighter image. Most of these gadolinium-based contrast agents are interstitial, because they diffuse rapidly from the vessels into the interstitium (but not into intact cells; thus, they are also called extracellular agents ). The pharmacokinetic behavior of the contrast agent is based on its chelation, which also makes the contrast agent nontoxic ( Figure 17-1 ). Imaging is performed during approximately 40 to 60 heartbeats after injection of the contrast agent ( Figure 17-2 ). The contrast agent is administered into an antecubital vein at a speed of 3 to 5 ml/sec using an automatic MR compatible pump. Higher doses (e.g., 0.1 mmol/kg body weight) are preferred for visual assessment; lower doses (e.g., 0.025 mmol/kg body weight) are more suitable for quantitative and semiquantitative evaluation ( Table 17-1 ). A full dataset (e.g., three to four short-axis views or a combination of short and long axis) is acquired every heartbeat to visualize the flow of the contrast agent through the left ventricular cavity and myocardium. Table 17-2 reports the instructions for patient preparation.


|
|
Different imaging sequences can be used. Unfortunately the faster the imaging sequence (which is advantageous for higher spatial resolution), the more artifacts occur. Most centers either use turbo-gradient echo imaging (TGrE, TFE, FLASH) or steady-state free precession (SSFP, BFFE, FIESTA). In addition to using an appropriate imaging sequence to visualize the data, a method to generate optimal T1 contrast has to be chosen. Most centers use saturation prepulse to null the signal and then wait for signal recovery ( Figure 17-3 ). With such saturation recovery pulse sequences signal depends on the amount of the contrast agent: good perfusion = high concentration of contrast agent = rapid recovery of signal = bright image; reduced perfusion = low concentration = slow recovery of signal = dark image (see Figure 17-1 ). In comparison with inversion-recovery sequences that are used for late gadolinium enhancement, saturation recovery pulse sequences have the advantage that the contrast is independent of heartbeat variations during ECG-triggered image acquisition.

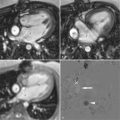
Imaging is usually performed first during adenosine stress (140 mcg/kg body weight/minute for up to 6 minutes) and repeated approximately 10 to 15 minutes later at rest. The time between the stress and the rest scan can be used for cine imaging for function and flow. After the second perfusion scan some additional contrast agent is given (e.g., up to 0.4 ml Gd-DTPA or other chelates/kg body weight) to allow for late gadolinium enhancement imaging ( Figure 17-4 ). The combination of images (stress, rest, late gadolinium enhancement) is used for visual interpretation ( Figure 17-5 ).


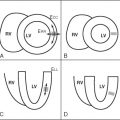
Adenosine induces maximal vasodilatation in the arterial coronary vessels. Because the microvasculature distal to a coronary artery stenosis is fully dilated at rest, this area does not dilate further with adenosine and resistance to blood flow is higher in comparison with normal vessels. This mechanism, together with a mild reduction of the coronary perfusion pressure, is responsible for a differential distribution of coronary blood flow and thus of the gadolinium-based contrast agent during first-pass perfusion, making it possible to visualize areas of myocardium with reduced blood flow as darker areas ( Figure 17-6 ).

SIDE EFFECTS
The vasodilator effect of adenosine may result in a mild-to-moderate reduction in systolic, diastolic, and mean arterial blood pressure (less than 10 mm Hg) with a reflex increase in heart rate. Most patients complain about chest pain, usually caused by the stimulation of nociceptors. These effects, however, are transient and usually do not require medical intervention.
Because adenosine exerts a direct depressant effect on the SA and AV nodes transient first-, second-, and third-degree AV block and sinus bradycardia were reported in a minority of patients. Also, adenosine can cause significant hypotension. Patients with intact baroreceptor reflex are able to maintain blood pressure in response to adenosine by increasing cardiac output and heart rate. Adenosine can also cause a paradoxic increase in systolic and diastolic blood pressure, which mostly develops in individuals with significant left ventricular hypertrophy. These increases are transient and resolve spontaneously. Because adenosine is a respiratory stimulant primarily through activation of carotid body chemoreceptors, intravenous administration showed increases in minute ventilation, reduction in arterial PCO 2, and respiratory alkalosis. Approximately 14% of patients complain of dyspnea and an urge to breathe deeply during adenosine infusion.
Table 17-3 reports the monitoring requirements for adenosine stress MR imaging. Contraindications to adenosine administration are reported in Table 17-4 .
|
* Vector-ECG monitoring is needed to check heart rhythm but cannot be used to diagnose myocardial ischemia.
|
Adenosine must be administered with caution in patients with:
|
| Sternal wires/clips after cardiac surgery and coronary stents do not interfere with perfusion-CMR. The quality of adenosine stress first- pass perfusion can be limited in patients with frequent extrasystoles (greater than 10/min) or in atrial fibrillation, resulting in a lower diagnostic accuracy. |
Adenosine should be discontinued in patients who develop persistent or symptomatic high-grade block or significant drop in systolic blood pressure (greater than 20 mm Hg). The drug should be discontinued in case of persistent or symptomatic hypotension. If a patient develops severe respiratory difficulties, adenosine should be immediately discontinued and an antagonist of adenosine receptors (aminophylline) may be administered ( Table 17-5 ).
|
VISUAL ASSESSMENT
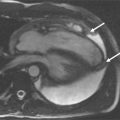
Visual assessment is based on the identification of regions with lower signal in comparison with normal myocardial segments. The speed of the contrast agent wash in is the best parameter for visual assessment. Care needs to be taken to not interpret small subendocardial rimlike black areas as ischemia ( Figure 17-7 ). They are usually caused by susceptibility artefacts (i.e., artefacts owing to strong differences of magnetization within a small area; e.g., one voxel) and pose the greatest difficulty in interpreting the images. The artefact can be reduced by using smaller doses of contrast agent, TGrE rather than SSFP and higher spatial resolution. True ischemia is usually not black, not circumferential, lasts for several heartbeats after the contrast agent has left the left ventricle, and is more than one pixel in width ( Table 17-6 ).

|
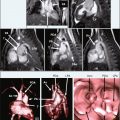
Visual assessment is usually performed comparing stress and rest images, and viability images obtained with late gadolinium-enhancement techniques ( Figure 17-8 ).

SEMIQUANTIFICATION
Similarly to the visual assessment, the speed of the wash in of the contrast agent is the best parameter for semiquantification. The up slope of the contrast agent wash in is used as an index for blood flow. To correct for signal inhomogeneities caused by differences of the coils used for data acquisition, the change of the up slope with adenosine stimulation, rather than the up slope itself is used. The simplest approach is a linear fit of the time curve of the myocardial signal. To correct for different arrival speeds of the bolus during rest and stress, the myocardial up slope is corrected for the up slope of the signal in the left ventricular cavity ( Figure 17-9 ). Obviously such an approach is far away from full quantification and must yield relatively low values; that is, it is nearly impossible to achieve an alteration of the up slope by a factor of two, as would be expected when measuring true perfusion reserve. Consequently the parameters obtained from semiquantification are termed myocardial perfusion reserve index . Even though this approach is not fully quantitative and needs careful placement of the regions of interest, it has been shown to accurately discriminate between ischemic and normal territories and has been highly reproducible among different sites. However, each sequence requires its own set of normal values.

FULL QUANTIFICATION
Absolute quantification of myocardial perfusion in [ml/g/min] of tissue is feasible from first-pass myocardial perfusion CMR data. Several fitting models have been proposed to deconvolve the myocardial signal and account for the different compartments of contrast agent distribution ( Figures 17-10 to 17-17 ). All quantification models have in common that they anticipate linearity between signal intensity and contrast concentration, so that relatively low doses of contrast (0.03 to 0.05 mmol/kg) have to be used for data acquisition. Absolute quantification of CMR perfusion data may have a role in the detection of balanced multivessel ischemia and in longitudinal studies of therapeutic interventions but is currently less used in clinical routine.


Related posts:

Stay updated, free articles. Join our Telegram channel

Full access? Get Clinical Tree


