Abstract
Echocardiography is the first-line imaging technique for the diagnosis and the follow-up of pericardial disease. However, computed tomography (CT) and cardiac magnetic resonance (CMR) imaging provide complementary information to echocardiography, offering many advantages. This chapter will illustrate the abilities of different noninvasive imaging techniques in the diagnosis and the management of pericardial diseases in various clinical scenarios.
Keywords
Pericardium, Echocardiography, Cardiac computed tomography, Cardiac magnetic resonance, Pericarditis, Tamponade.
18.1
Introduction
Pericardial diseases represent a broad range of clinical syndromes and may be present in various associated diseases conveying significant morbidity and mortality [ , ]. The evaluation of pericardial conditions can be complex, and imaging techniques play a key role for an appropriate clinical approach. Although echocardiography is the first-line imaging technique for the diagnosis and the follow-up of pericardial disease, computed tomography (CT), and cardiac magnetic resonance (CMR) imaging offer many advantages in providing complementary information to echocardiography [ ]. This chapter will illustrate the ability of different noninvasive imaging techniques in the diagnosis and the management of pericardial diseases in various clinical scenarios.
18.2
Technical aspects
The main strengths of CT and CMR as compared with echocardiography are superior anatomic visualization and tissue characterization. Different modalities may be used with each technique and may have various advantages and limitations as summarized in Table 18.1 .
| Echocardiography | Cardiac CT | CMR |
|---|---|---|
| Advantages | ||
| First line for diagnosis and follow-up | Anatomic assessment | Anatomic assessment |
| Widely available | Evaluation of associated/extracardiac disease | Evaluation of associated/extracardiac disease |
| Low cost | Preoperative planning | Preoperative planning |
| Safe and repeatable | Detection of pericardial calcification | Safe and repeatable |
| Bedside (critically ill and pericardiocentesis) | Functional assessment | |
| Hemodynamics | ||
| Functional assessment | ||
| Modalities | ||
| M-mode | Axial imaging | Cine SSFP |
| 2D echocardiography | Multiplanar reconstruction | Black blood spin-echo (+ STIR) |
| Doppler | Volume rendered imaging | Tagging |
| Tissue Doppler | Cine-imaging | |
| Deformation Imaging including twist and rotation | Late gadolinium enhancement | |
| 3D echocardiography | Real-time gradient-echo cine | |
| Contrast echocardiography | ||
| Limitations | ||
| Echogenicity | Ionizing radiation | Time-consuming |
| Acoustic windows | Iodinated contrast | Difficult in case of arrhythmias |
| Operator dependency | Functional evaluation only possible with retrospective gated studies | Contraindications (e.g. pacemakers, AICD,…) |
| Limited tissue characterization | Difficult in case of arrhythmias | Calcifications not well visualized |
| Patient cooperation (breath-holding) | Gadolinium not recommended if glomeral filtration rate < 30 ml/min) | |
| Hemodynamically stable patients only | Patient cooperation (breath-holding) | |
| Hemodynamically stable patients only |
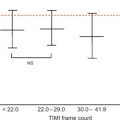
Bi-dimensional echocardiography is the examination of choice for the evaluation of pericardial effusion, and allows the assessment of the hemodynamic and functional consequences of pericardial disease. 2D echocardiography’s image quality has enhanced dramatically with improved technology, including new probes with better crystals, better spatial resolution, and signal-noise ratio. An additional transesophageal approach may be useful in particular cases. The use of tissue harmonic imaging has also improved the field of view, reducing inadequate examinations to 5–10%. Contrast echocardiography may improve the detection of pericardial effusion, especially in the acute setting of myocardial infarction with pseudoaneurysm and free-wall rupture [ ]. M-mode can play a complementary role for demonstrating a flattening of the posterior wall during diastole or the respiratory variation of ventricular size. Doppler allows the evaluation of restrictive inflow and the reciprocal respiratory changes of mitral and tricuspid inflow. Tissue Doppler imaging velocity analysis is now part of all echocardiographic examinations in patients with pericardial disease to help to make the difference between constrictive pericarditis and restrictive cardiomyopathy with an E ′ cut-off proposed at < 7 cm/s favoring the diagnosis of restrictive cardiomyopathy. Deformation imaging has entered the clinical arena mainly to assess the impact of various pathological conditions on ventricular function. Strain is a measure of how much an object has been deformed, and several formulas can be used to calculate different types of strain. The preferred modality is speckle-tracking echocardiography (STE) [ , ]. In addition, left ventricular (LV) rotation can be measured clinically by STE and twist and torsion can be calculated [ , ]. In a normal individual, the heart slides and twists easily within the parietal pericardium, which is lubricated by a small amount of fluid. The importance of this motion has been illustrated in experiments in which the epicardium has been fixed to the pericardium [ ]. Pericardial adhesions reduced LV twist by limiting the free motion of the heart inside the pericardium. In patients with congenital absence of the pericardium, a reduction in LV twist has been reported [ ]. Finally, three-dimensional echocardiography has the potential to provide a complete evaluation of the entire pericardium in any anatomical plane, and therefore detect loculated effusions. New software programs to accurately quantify the volume of liquid in the pericardium are under evaluation.
CT is a widely available technique with a short acquisition time of a few seconds. Modern CT scanners have a spatial resolution well below 1.0 mm. High temporal resolution and dedicated image acquisition techniques, which either trigger prospective image acquisition to the patient’s electrocardiogram or retrospectively select raw data acquired during suitable segments of the cardiac cycle for image reconstruction, provide motion artifact free data sets [ ]. The pericardium can be visualized both in noncontrast and contrast-enhanced CT data sets. Following the administration of intravenous contrast, enhancement of thickened pericardium can be observed in case of suspected pericarditis or tumor infiltration [ , ]. Iodinated contrast administration is contraindicated in advanced renal failure. Furthermore, CT is highly sensitive for identifying calcification, and volume-rendered imaging allows a precise evaluation of the extent and distribution of pericardial calcification.
Multiplanar reconstruction CT can provide secondary functional information, such as enlargement of the atria and venae cavae in cases of pericardial constriction, but cine imaging ventricular functional parameters can be acquired only with retrospective ECG-gated acquisitions, requiring an increased radiation dose.
CMR imaging is performed by using magnetic gradient field switches and radiofrequency waves. Improvements in scanner hardware (powerful gradients and coils for parallel imaging) and software (new sequences) have resulted in improved image quality and shortened scan time [ ]. CMR requires a stable heart rhythm and respiratory cooperation (breath-hold sequences). Therefore, CMR imaging is feasible in hemodynamic stable patients only. Due to the absence of signal from calcium, CMR cannot directly prove the presence of calcification. The use of gadolinium intravenous contrast is contraindicated in advanced renal insufficiency (glomerular filtration rate < 30 ml/min). Largely, CMR is contraindicated in patients with a pacemaker or defibrillator. The imaging protocol may differ depending on the diagnostic question [ , ]. Imaging sequences are triggered by ECG. One scan protocol consists of dark-blood morphological images (fast spin-echo or newer half-Fourier acquisition turbo spin-echo = HASTE) for tissue characterization, detection of effusion, and assessment of pericardial thickening, respectively. Cine images (steady-state free precession = SSFP) in the short-axis and long-axis planes are used to evaluate atrial and ventricular size, shape, and function, but also pericardial thickening or effusion. Real-time cine images allow assessment of exaggerated ventricular interdependence. Late gadolinium enhancement of the pericardium indicates inflammation [ ].
18.3
The pericardium: normal findings
The pericardium is a fibrous sac surrounding the heart. It consists of two layers: the visceral (serous) pericardium, which folds back to form the parietal (fibrous) pericardium at the base of the heart forming the pericardial space. The pericardial space normally contains a trace of pericardial fluid (< 15–35 ml). There are two blind ending pockets or recesses: the sinus tranversus (behind the big arteries) and the sinus obliquus (behind the left atrium).
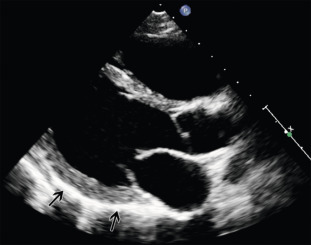
The normal pericardium is not easily visualized by echocardiography ( Figure 18.1 ).
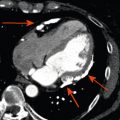
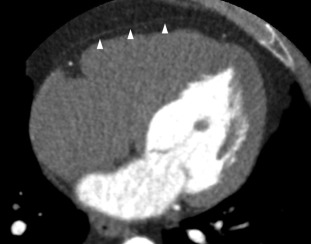
On CT, the pericardium is seen as a thin, intermediate density linear structure (against the surrounding fat, which displays low attenuation) ( Figure 18.2 ). The normal pericardium is best seen anterior to the right ventricle and at the apex of the heart as opposed to the left lateral and left posterior wall because of the scarcity of pericardial fat.
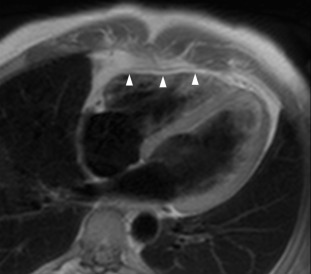
The normal fibrous pericardium is visible as a thin (< 4 mm) low-intensity line on morphologic T1- and T2-weighted spin-echo images and on gradient echo cine images, surrounded by high-intensity pericardial fat [ , ] ( Figure 18.3 ).
18.4
Clinical scenarios
18.4.1
Acute pericarditis
18.4.1.1
Definition and etiologies
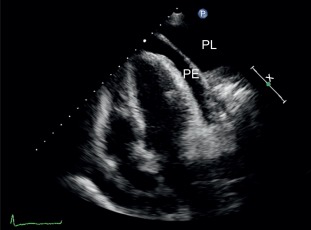
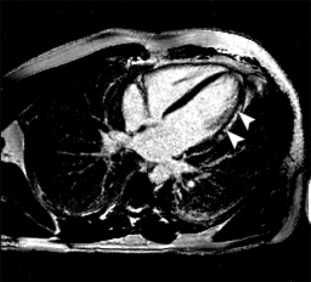
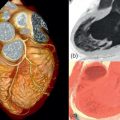
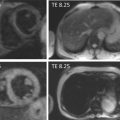
It is a clinical syndrome characterized by typical chest pain eventually accompanied by friction rub and/or characteristic ECG changes or an elevation of inflammatory markers in relation with pericardial inflammation. Most of the cases are of idiopathic or viral etiology, but systemic illnesses, malignancies, or acute ischemic cardiac disease are other potential etiologies. An imaging test should be performed within the first 24 h of presentation to search for pericardial effusion, its characteristics, etiology, and its hemodynamic consequences. Echocardiography is the first-line examination. Echocardiography is useful to rule out ischemic heart disease. In acute pericarditis, echocardiography may appear normal. The amount of pericardial fluid can be variable, large, or localized ( Figure 18.4 ). Bright or thickened pericardium is a less specific feature that can also be observed. Echogenic material within the pericardial effusion suggests clotted blood usually, primary or secondary tumors, or inflammatory origin. Tamponade physiology needs to be evaluated. It is important to note that in patients with large effusion, pericardiocentesis has to be considered even in the absence of typical features of tamponade. CMR has the ability to visualize pericardial inflammation (T2-weighted spin-echo STIR to visualize edema and late gadolinium enhancement to detect inflammation [ , ]), thickening and fluid. In addition, late gadolinium enhancement allows diagnosis of associated myocarditis [ ] ( Figure 18.5 ). CMR should be considered to confirm the diagnosis of pericarditis, to detect small effusions, and to investigate a complicated course. Noninvasive assessment of hemodynamics is done by echo, but CMR can also provide similar information. Uncomplicated/simple effusions usually have low signal intensity on T1-weighted images. Pericardial effusions demonstrate high signal intensity on cine gradient SSFP images. Hemorrhage can be suspected when the effusion is complex and contains regions of different signal intensity. CT has the ability to diagnose pericardial effusion ( Figure 18.6 ). It is particularly suited to diagnose localized pericardial effusion. CT provides limited characterization of pericardial fluid by attenuation values (Hounsfield units = HU). Generally, 30 HU is a useful cutoff between simple effusions and bloody or exudative effusions. The more HU corresponds to the more protein content. A noncalcified thickening of the pericardium with or without effusion can be suggestive of acute pericarditis. Enhancement of the pericardium with the administration of iodinated contrast suggests an active inflammation process [ , ].