Cardiovascular disease is the leading cause of death worldwide. Given the increased availability of radiopharmaceuticals, improved positron emission tomography (PET) camera systems and proven higher diagnostic accuracy, PET is increasingly utilized in the management of various cardiovascular diseases. PET has high temporal and spatial resolution, when compared to Single Photon Emission Computed Tomography. In clinical practice, hybrid imaging with sequential PET and Computed Tomography acquisitions (PET/CT) or concurrent PET and Magnetic Resonance Imaging are standard. This article will review applications of cardiovascular PET/CT including myocardial perfusion, viability, cardiac sarcoidosis/inflammation, and infection.
Key points
- •
Access to novel radiopharmaceuticals and technological advances has led to the increased utilization of PET in cardiac perfusion and metabolic imaging resulting in improved diagnostic certainty and patient care.
- •
Assessment of myocardial perfusion with PET tracers enables not only high quality relative perfusion imaging but also allows for quantification of myocardial blood flow and flow reserve.
- •
PET myocardial viability imaging plays a significant role in risk stratifying patients with ischemic cardiomyopathy who may benefit from revascularization.
- •
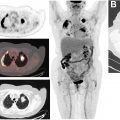
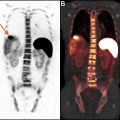
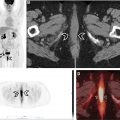
FDG PET for sarcoidosis is valuable in diagnosis, estimating cardiac and extracardiac disease burden, treatment monitoring and prognosis.
- •
Reliable hot spot FDG PET in suspected cardiac inflammation or infection is possible only when physiologic myocardial FDG uptake is suppressed. Thus optimal patient preparation is crucial.
Myocardial perfusion using positron emission tomography
Coronary artery disease (CAD) continues to be the major cause of morbidity and mortality in both developing and developed countries. The American Heart Association reports approximately 16 million people greater than or equal to 20 years old in the United States have cardiovascular disease. CAD leads to approximately one-third of all deaths in people older than 35 years. Understanding of CAD has improved significantly over the past several decades. PET using different flow tracers has led to translation of qualitative and quantitative estimation of myocardial blood flow (MBF) to clinical practice and research. The information derived during the cardiac PET scan can aid clinicians in phenotyping myocardial perfusion abnormalities and thus help treat their patients better. This section briefly discusses MBF anatomy and physiology to understand the role of myocardial perfusion PET imaging to determine alterations in this physiology. Technical considerations, current clinical indications, and applications also are discussed.
Myocardial Blood Flow: Anatomy and Physiology
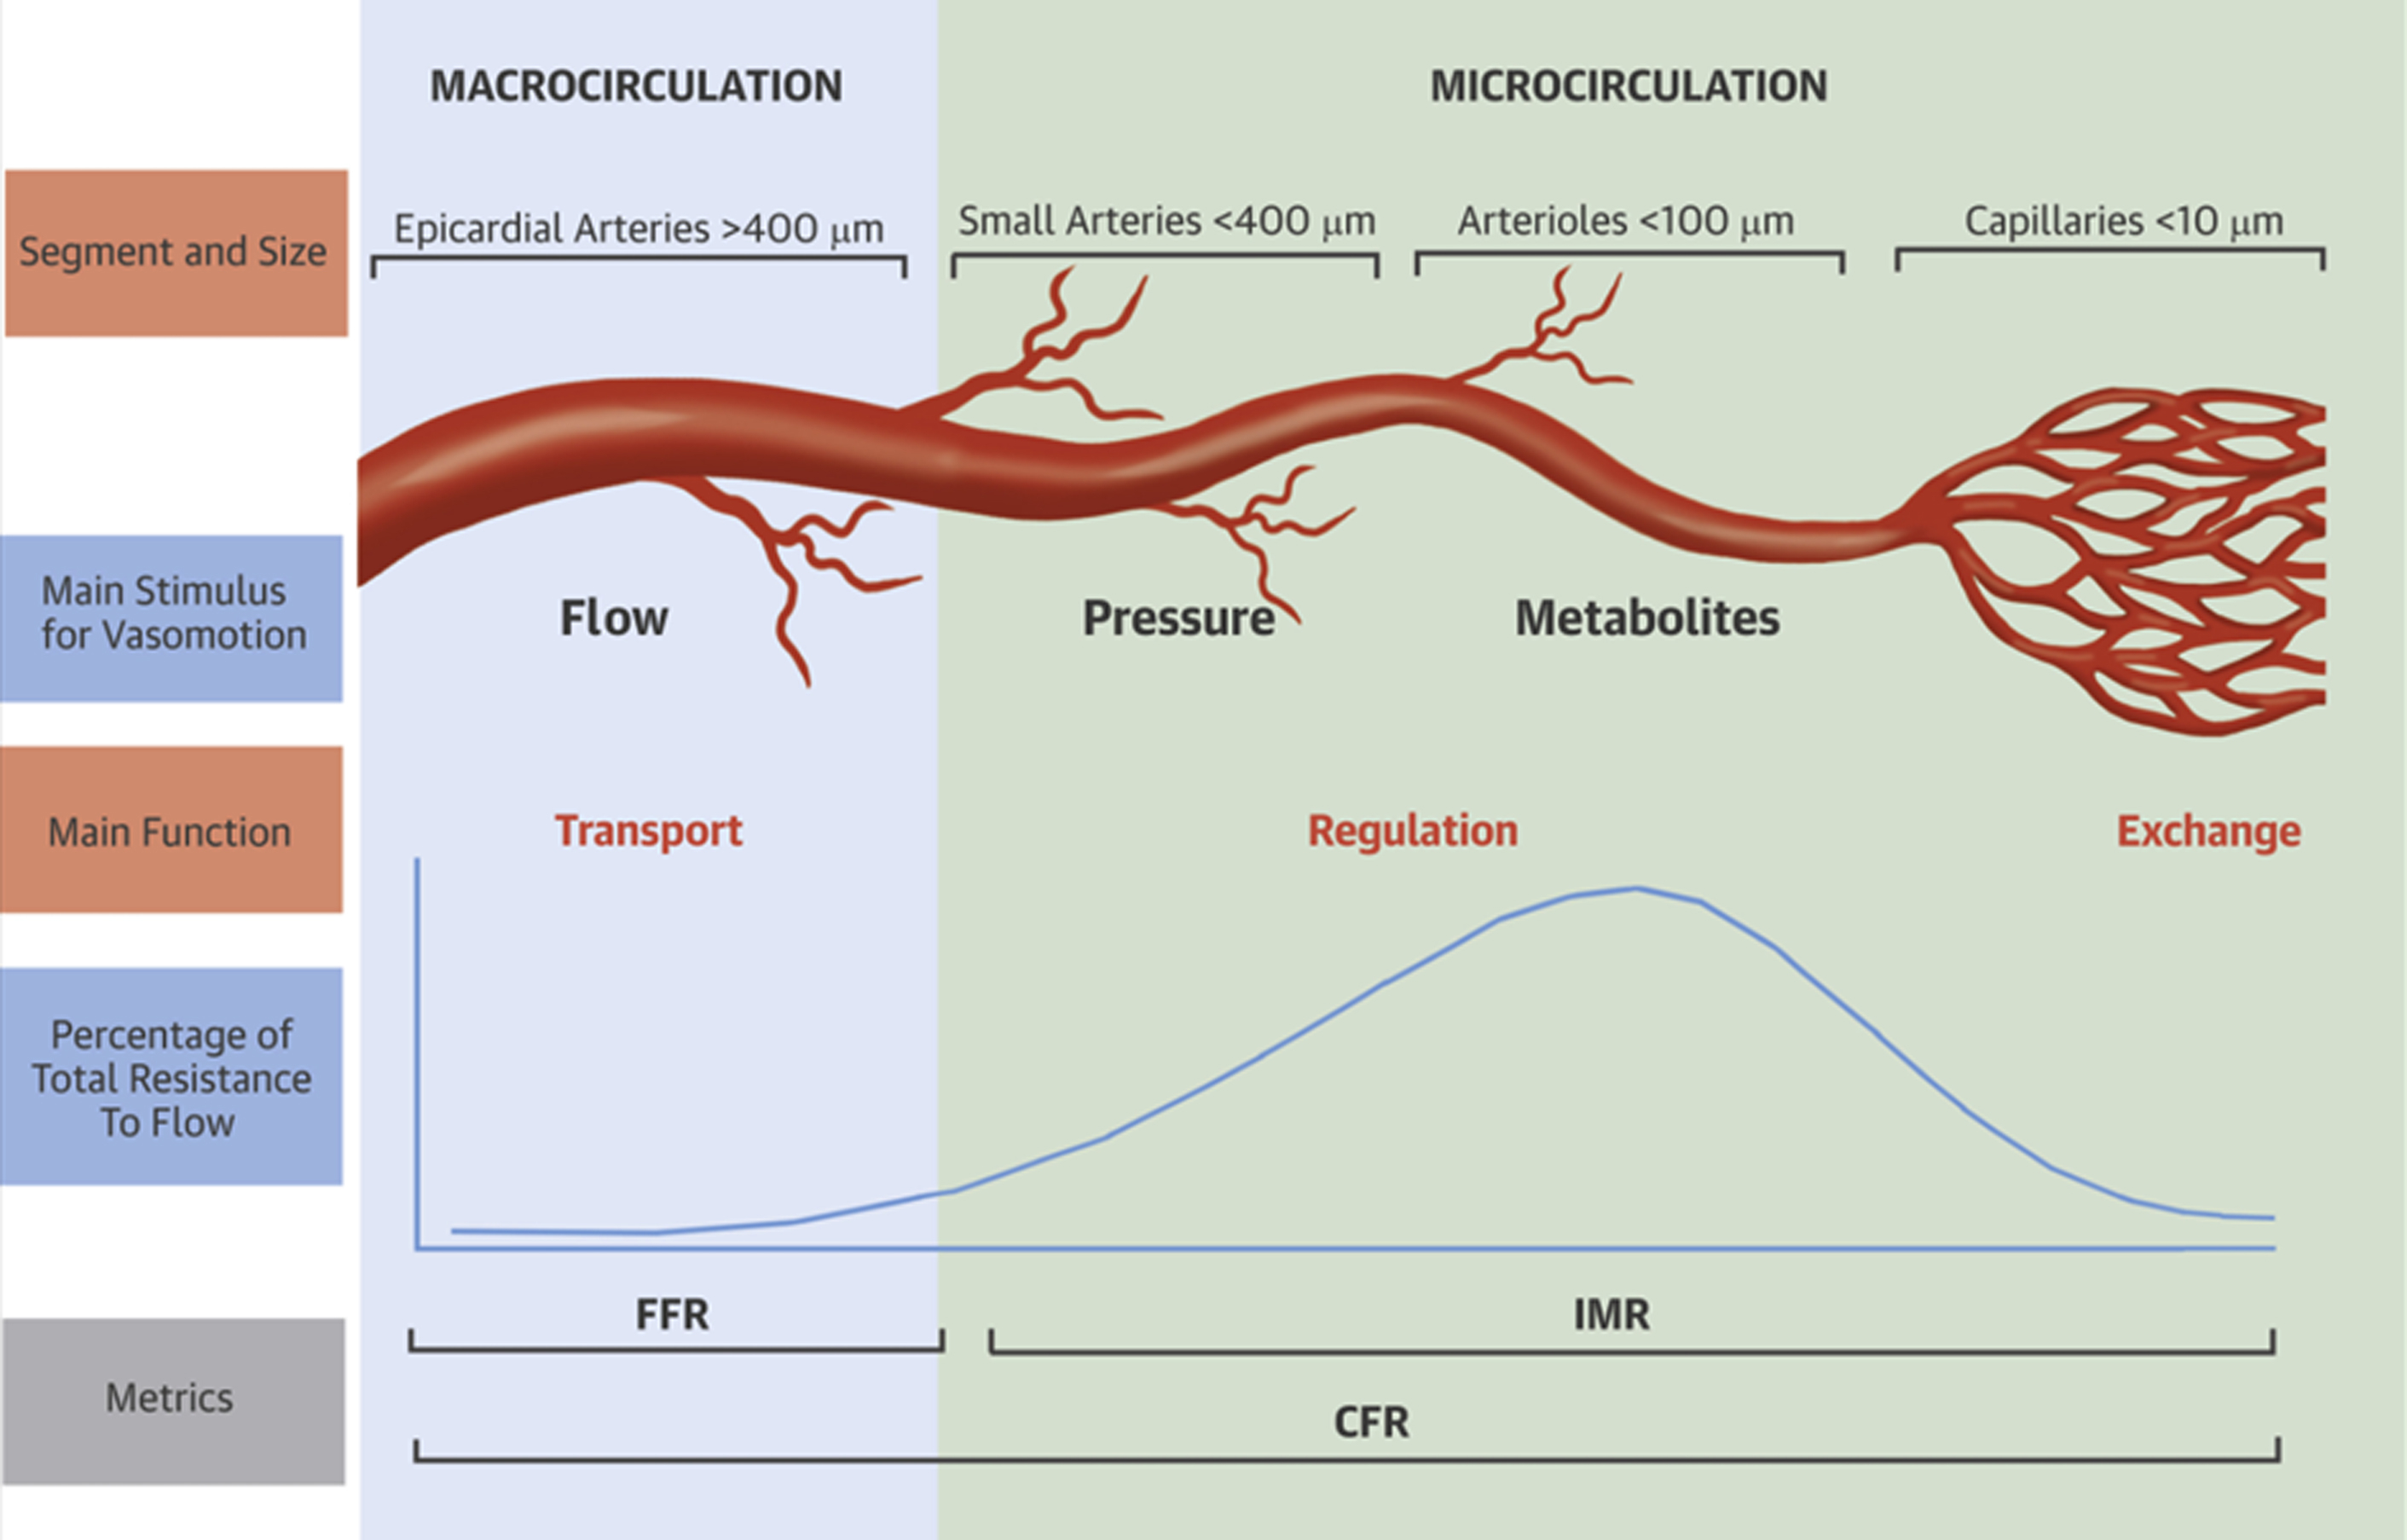
The coronary arteries arise from the right and the left coronary sinuses/cusps of the aorta. The left coronary artery divides into left anterior descending and the left circumflex artery, whereas the right coronary artery travels in the right atrioventricular groove and commonly gives rise to posterior descending artery. These epicardial coronary arteries form the main branches of the coronary tree. These main coronary arteries then divide and subdivide into a filigree network of intramural coronary vessels, precapillary sphincters, capillaries, and coronary veins ( Fig. 1 ). Different parts of coronary tree have different functions. For example, the epicardial coronary arteries contribute to the coronary capacitance, but, under most conditions, they have only a small effect on coronary vascular resistance. In contrast, the small transmural coronary vessels (<100 μm) play a dominant role in regulating total coronary vascular resistance. Fig. 1 briefly describes the function of different segments of the coronary tree along with the commonly measured myocardial and coronary perfusion metrics, which aid in diagnosis of alterations MBF. Fractional flow reserve (FFR) measured during coronary angiography measures the transport function of epicardial coronary arteries and aids in the diagnosis of obstructive epicardial CAD, whereas index of microcirculatory resistance (IMR) measures coronary microvascular resistance; and coronary flow reserve (CFR) is a combined measure of abnormalities in the epicardial and microcirculation.
Understanding Myocardial Blood Flow Physiology with Positron Emission Tomography
Myocardial perfusion imaging (MPI) with single-photon emission computed tomography (SPECT) is a widely used diagnostic and prognostic test for detection and risk stratification of patients with CAD. There is wealth of data supporting its use. MPI with SPECT and PET is limited by the relative nature of perfusion imaging, which may lead to difficulty in detection of global reduction in myocardial perfusion and thus underestimation of the extent of CAD. This fundamental limitation applies to MPI with both thallium-201–labeled and technetium-99m–labeled tracers. With the use of PET, this issue with relative flow can be overcome due to better energy, spatial, temporal, and camera characteristics, allowing for global and regional MBF quantification in mL/min/g of tissue. Additional routine computed tomography (CT) attenuation correction with PET also leads to better-quality images with less artifacts.
Quantification of MBF using PET, allows assessment of peak hyperemic MBF as well as noninvasive calculation of CFR, a measure that evaluates the effects of abnormality over the entire coronary circulation (see Fig. 1 ). It, therefore, allows assessment not only of the effects of focal epicardial coronary stenosis but also of diffuse coronary atherosclerosis and microvascular dysfunction. The use of CFR measured by PET has helped diagnose balanced ischemia, atherosclerosis, and microvascular dysfunction. The CFR also appears to be a very strong prognostic measure of adverse cardiovascular events even in those without obstructive epicardial CAD.
Technical Considerations
Perfusion tracers
The blood flow tracers used most commonly are 82 Rb-chloride and 13 N-ammonia, with a small number of centers around the world using 15 O-water. 18 F-flurpiridaz, another perfusion tracer, currently is under investigation. Because of their short half-lives, 13 N-ammonia and 15 O-water require an on-site cyclotron and 82 Rb, a generator. In contrast, 18 F-flurpiridaz, because of its longer physical half-life (110 min), can be produced in batches and distributed regionally as is done with 18 F-fluorodeoxyglucose (FDG).
Scanner performance
Contemporary PET scanners operate in 3-dimensional (3-D) acquisition mode, as opposed to the older 2-dimensional (2-D) (or 2-D/3-D) systems that were constructed with interplane septa designed to reduce scatter. The 3-D systems generally require lower injected activity, with a concordant reduction in patient radiation effective dose.
Image acquisition and analysis
Image acquisition consists of relative static perfusion images, gated images, and list mode acquisition for estimation of MBF after stress and rest. Quantification of MBF requires accurate measurement of the total tracer activity transported by the arterial blood and delivered to the myocardium over time. Measurements of arterial isotope activity versus time (time–activity curves) typically are acquired using image regions of interest in the arterial blood pool (eg, left ventricle [LV], atrium, or aorta). ,
Stress test procedure
In the United States, regadenoson is the agent utilized most commonly for inducing hyperemia through coronary vasodilation. Other agents, adenosine and dipyridamole, also are used. , Exercise stress maybe performed but is technically challenging due to short half-lives of radiotracers, smaller bores of PET gantry for supine bicycles, and motion artifacts from exercising.
Patient preparation for pharmacologic stress with PET is the same as for 99m Tc SPECT MPI. Patients fast for a minimum of 4 hours, avoid smoking for at least 4 hours, and avoid caffeine intake for at least 12 hours before vasodilator stress. Rest imaging should be performed before stress. Vasodilator stress with the chosen agent is followed by radiotracer injection and imaging at stress. Rest and stress images usually are performed the same day. The dose of radiotracer depends on the type of PET camera and patient weight.
Image acquisition and reconstruction parameters
Images are acquired and reconstructed using standard vendor-specific parameters. Briefly, after a low-dose CT or a radionuclide-localizing scan to position the heart, a dynamic or preferably list-mode acquisition is acquired in 2-D or 3-D mode. List-mode acquisition provides comprehensive data for static images, gated images for LV volumes and ejection fraction (EF), and dynamic images for MBF quantitation. The relative and quantitative perfusion images are reconstructed from CT attenuation-corrected images. ,
Indications and applications
American Society of Nuclear Cardiology recommends the use of PET over SPECT myocardial perfusion when 1) Prior stress imaging study was of poor quality, equivocal or inconclusive 2) Body characteristics that commonly affect image quality. Some examples include large breasts, breast implants, obesity (BMI greater than 30), protuberant abdomen, chest wall deformities, pleural effusions, and inability for proper body positioning such as inability to position arms outside of a SPECT scanner’s field of view 3) High-risk patients in whom diagnostic errors carry even greater clinical implications. Some examples include chronic kidney disease stages 3, 4 or 5; diabetes mellitus; known or suspected potentially high-risk CAD such as left main, multivessel, or proximal LAD disease or extensive coronary disease. 4) Young patients with established CAD who are anticipated to need repeated exposures to radiation-associated cardiac imaging procedures. 5) Patients in whom myocardial blood flow quantification is a needed adjunct to the imaging findings. Several investigational uses of myocardial perfusion imaging are also on the cusp of translation into clinical medicine including those suspected to have microvascular disease, cardiometabolic risk factors including those with obesity, CKD, and diabetes, heart transplant, and infiltrative cardiomyopathies.
PET viability
Background
Despite the advances in diagnosis, imaging, medical management, and revascularization techniques, one-third of patients following an acute myocardial infarction develop ischemic heart failure (ischemic cardiomyopathy [ICM]). In 2010, the prevalence rates of ICM were 190 per 100,000 person-years and 270 per 100,000 person-years in women and men, respectively, and these rates are only expected to rise as the population ages and survival improves. Viability imaging plays a significant role in risk stratifying patients with ICM who may benefit from revascularization. From an ultrastructural standpoint, viability refers to the preservation of contractile function based on cellular, metabolic, and microscopic characteristics. Clinically, the presence of viable myocardium denotes dysfunctional myocardium at rest, which may recover part or all of its contractile function following restoration of coronary perfusion.
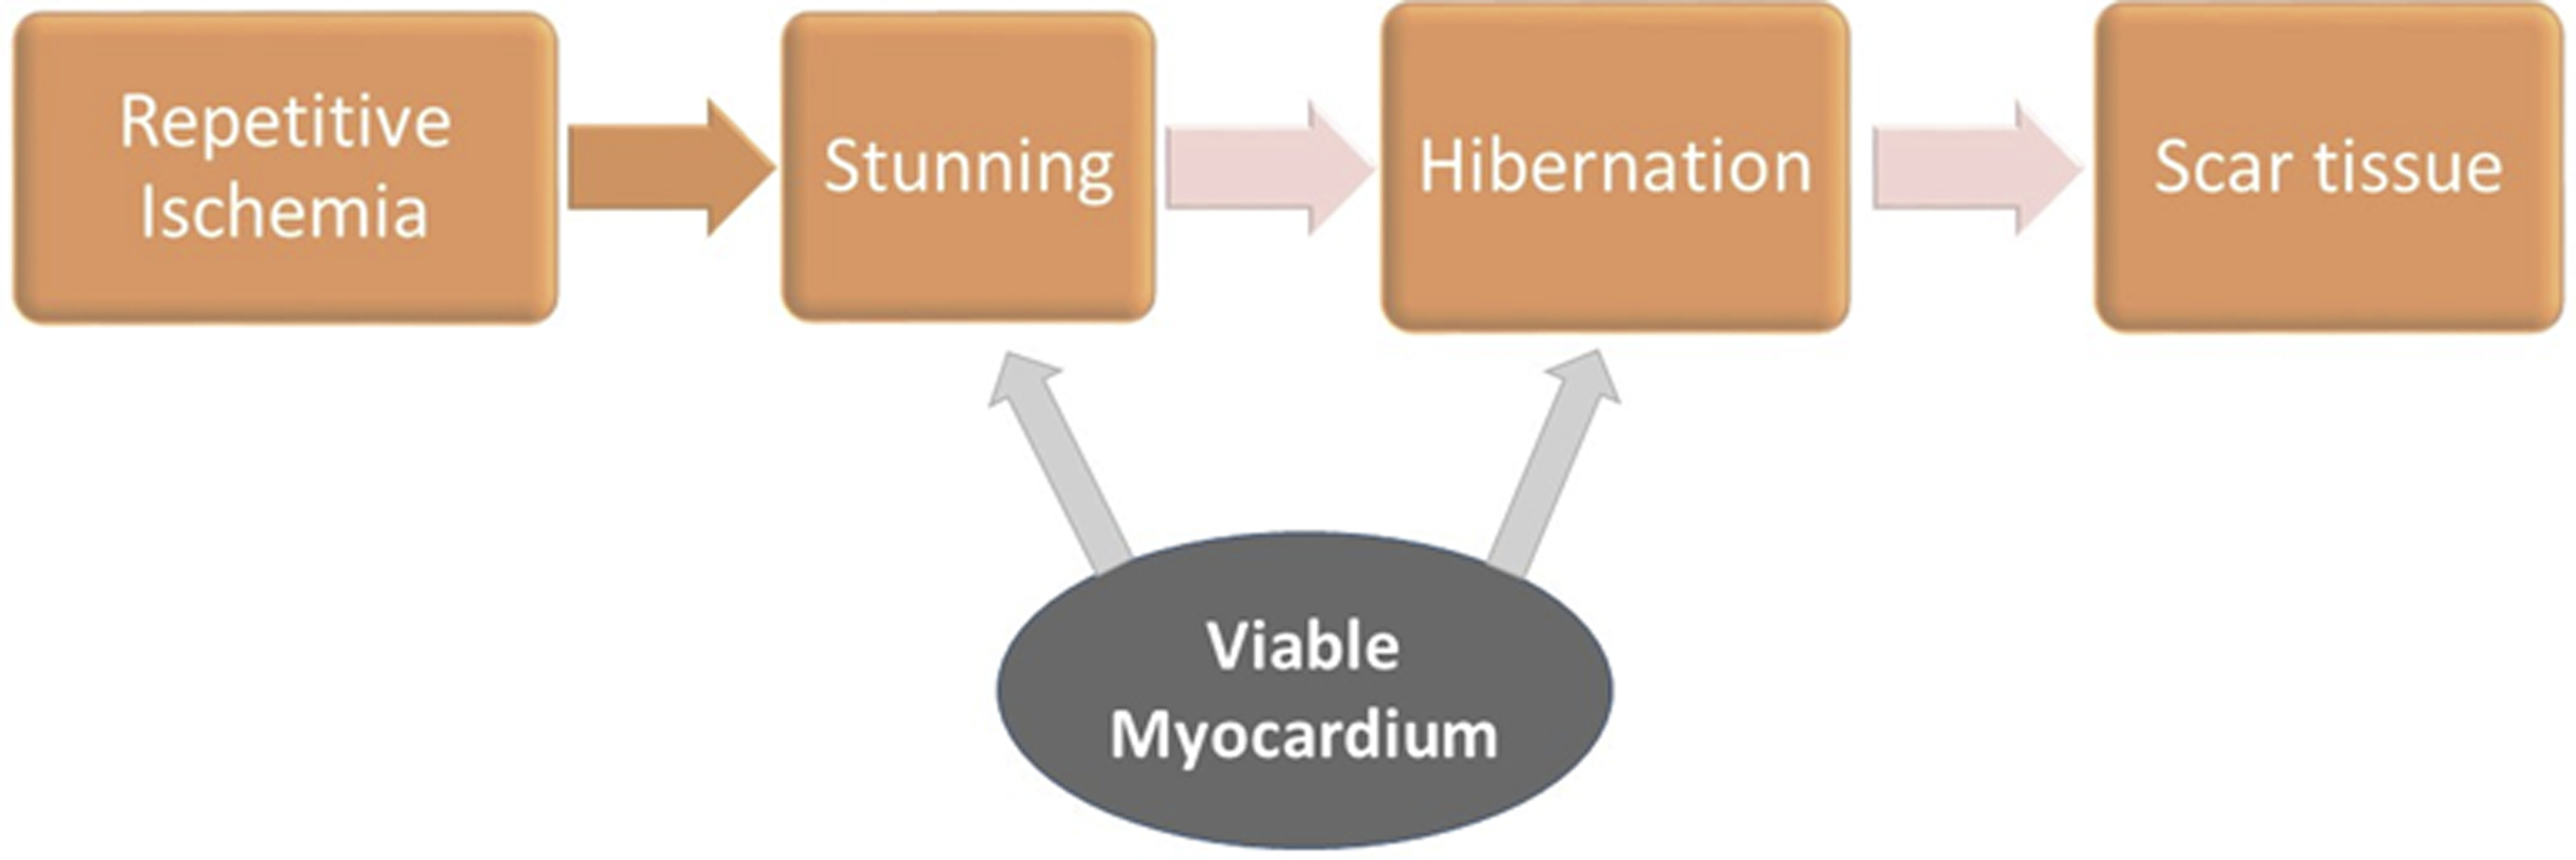
There are 2 main categories of viable myocardium, namely hibernation and stunning, which fall on a continuum of abnormalities in myocardial perfusion and function ( Fig. 2 ). Myocardial stunning results from transient, repetitive episodes of hypoperfusion and is characterized by reduced contractile function in the presence of normal resting blood flow. Recurrent episodes of stunning over time eventually leads to the development of hibernating myocardium characterized by reduced resting blood flow and associated alterations both at the ultrastructural cardiomyocyte level and at the macroscopic, LV level. From a macroscopic standpoint, hibernation manifests as adverse LV remodeling, LV dilation, and LV systolic and diastolic dysfunction. The main distinguishing characteristics of stunning and hibernation are listed in Table 1 . These can be visualized by echocardiography, cardiac magnetic resonance (CMR), and cardiac CT. Myocardial radionuclide imaging, including SPECT and PET, rely on detecting changes in coronary perfusion and cardiomyocyte metabolism. Compared with SPECT, PET offers higher spatial and energy resolution and lower radiation exposure. These advantages are crucial when assessing for LV viability, when detection of scar versus hibernation is critical. The focus of this section is on providing an overview of FDG PET imaging for the evaluation of myocardial viability.
| Features | Stunning | Hibernation |
|---|---|---|
| Reduced flow at rest | ✕ | ✓ |
| Abnormal contractile function | ✓ | ✓ |
| Reduced CFR | ✓ | ✓ |
| Histopathologic abnormalities | ✓ | ✓ |
| Potential for recovery of LV function following revascularization | ✓ | ✓ |
| May progress to | Hibernation | Scar |
Protocols for Imaging
Normal myocardium utilizes long-chain fatty acids as its primary source of energy; however, under anaerobic conditions, for example, coronary hypoperfusion and ischemia, cardiomyocytes switch to glucose as their main energy source. The process of glucose uptake by the cardiomyocytes is active and mediated by insulin secretion. Appropriate management of glucose and insulin levels is key for generating diagnostically accurate and high-quality myocardial FDG PET studies for assessment of viability.
Evaluation of coronary perfusion and myocardial metabolism are the 2 key components of viability examination. Perfusion imaging can be performed either by SPECT tracers or by PET tracers, which are surrogates for the integrity of cardiomyocyte cellular membrane. Perfusion imaging at rest should be performed first; if there are no perfusion defects, this means that all LV segments are viable and evaluation for myocardial ischemia may be considered. If, however, there are resting perfusion defects, viability metabolic imaging can be undertaken with FDG.
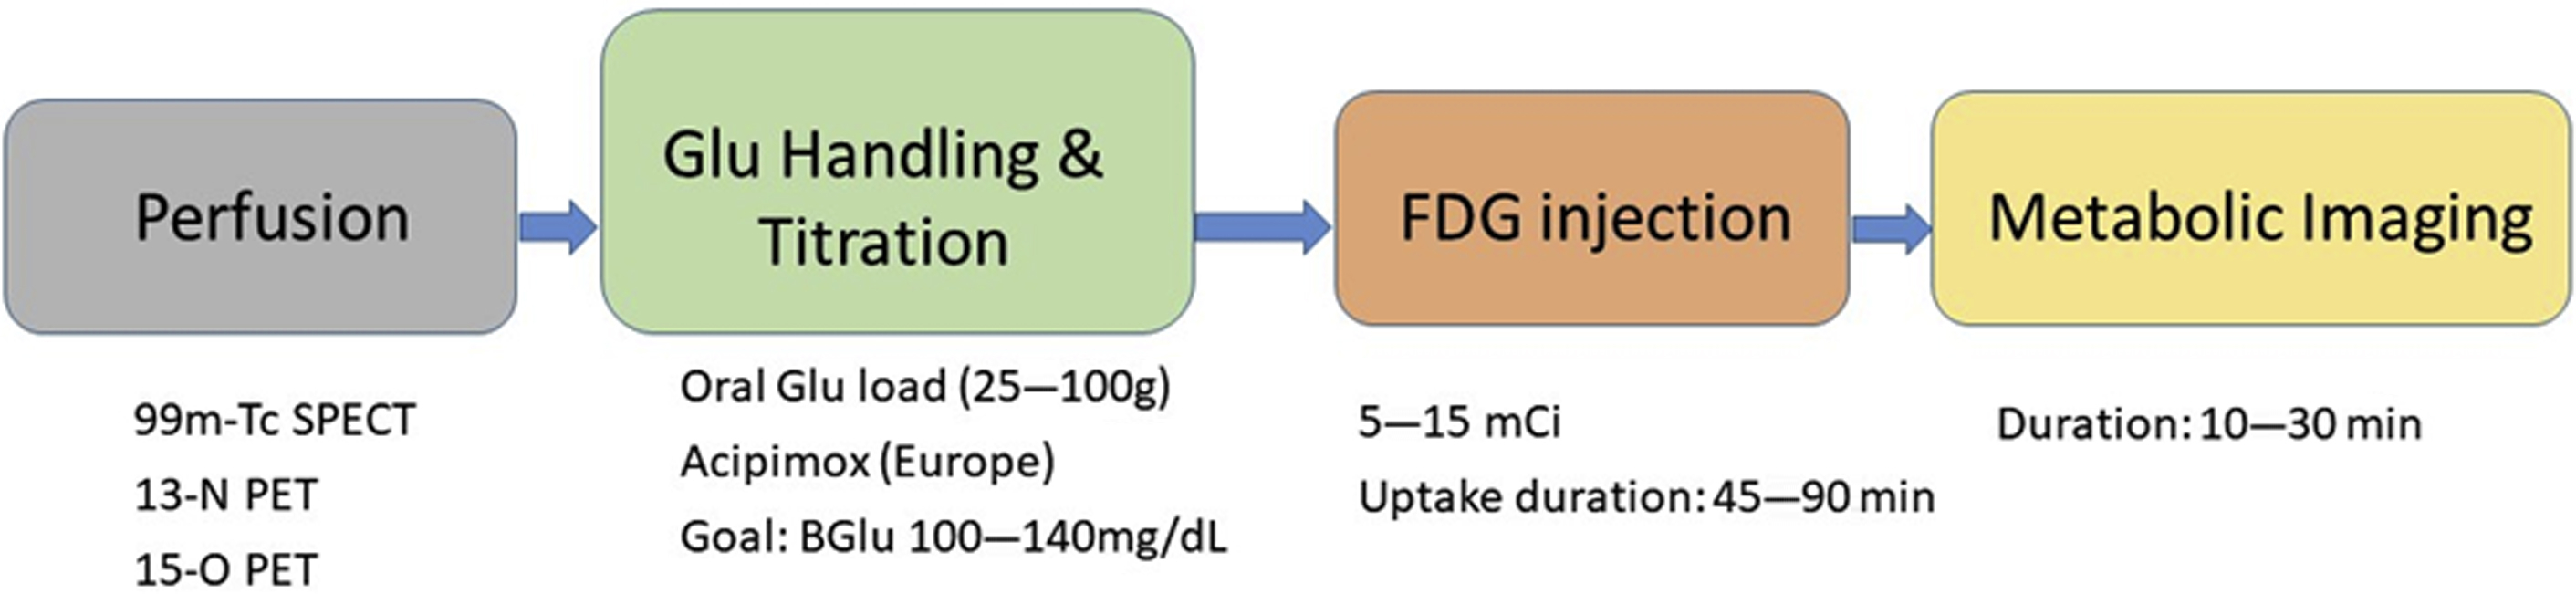
The importance of patient preparation should be emphasized to provide examinations of high diagnostic quality. Following a 6-hour to 12-hour fast, plasma glucose is checked. Depending on this initial value, patients are administered an oral glucose load (25–100 mg), which leads to a transient increase in plasma glucose, stimulates pancreatic insulin secretion, and ultimately shifts myocardial consumption from fatty acids to glucose. Following the oral glucose load, intravenous insulin is administered to achieve euglycemic state prior to FDG injection. An alternative to glucose loading is acipimox, a nicotinic acid derivative approved for use in Europe, which functions by inhibiting peripheral lipolysis, reducing levels of free fatty acids (FFAs), and ultimately increasing levels of glucose. Another alternative technique is the euglycemic-hyperinsulinemic clamp, which is a rigorous and time-consuming procedure. The target range for plasma glucose prior to administering FDG is 100 mg/dL to 140 mg/dL. Once glucose is within this range, FDG is injected and the patient is monitored for 45 minutes to 90 minutes prior to undergoing PET imaging. To ensure patient safety, glucose levels are monitored after FDG injection. Typically, 5 mCi to 15 mCi (185–555 MBq) of FDG is administered and image acquisition usually lasts 10 minutes to 30 minutes. An overview of the protocol is shown in Fig. 3 .
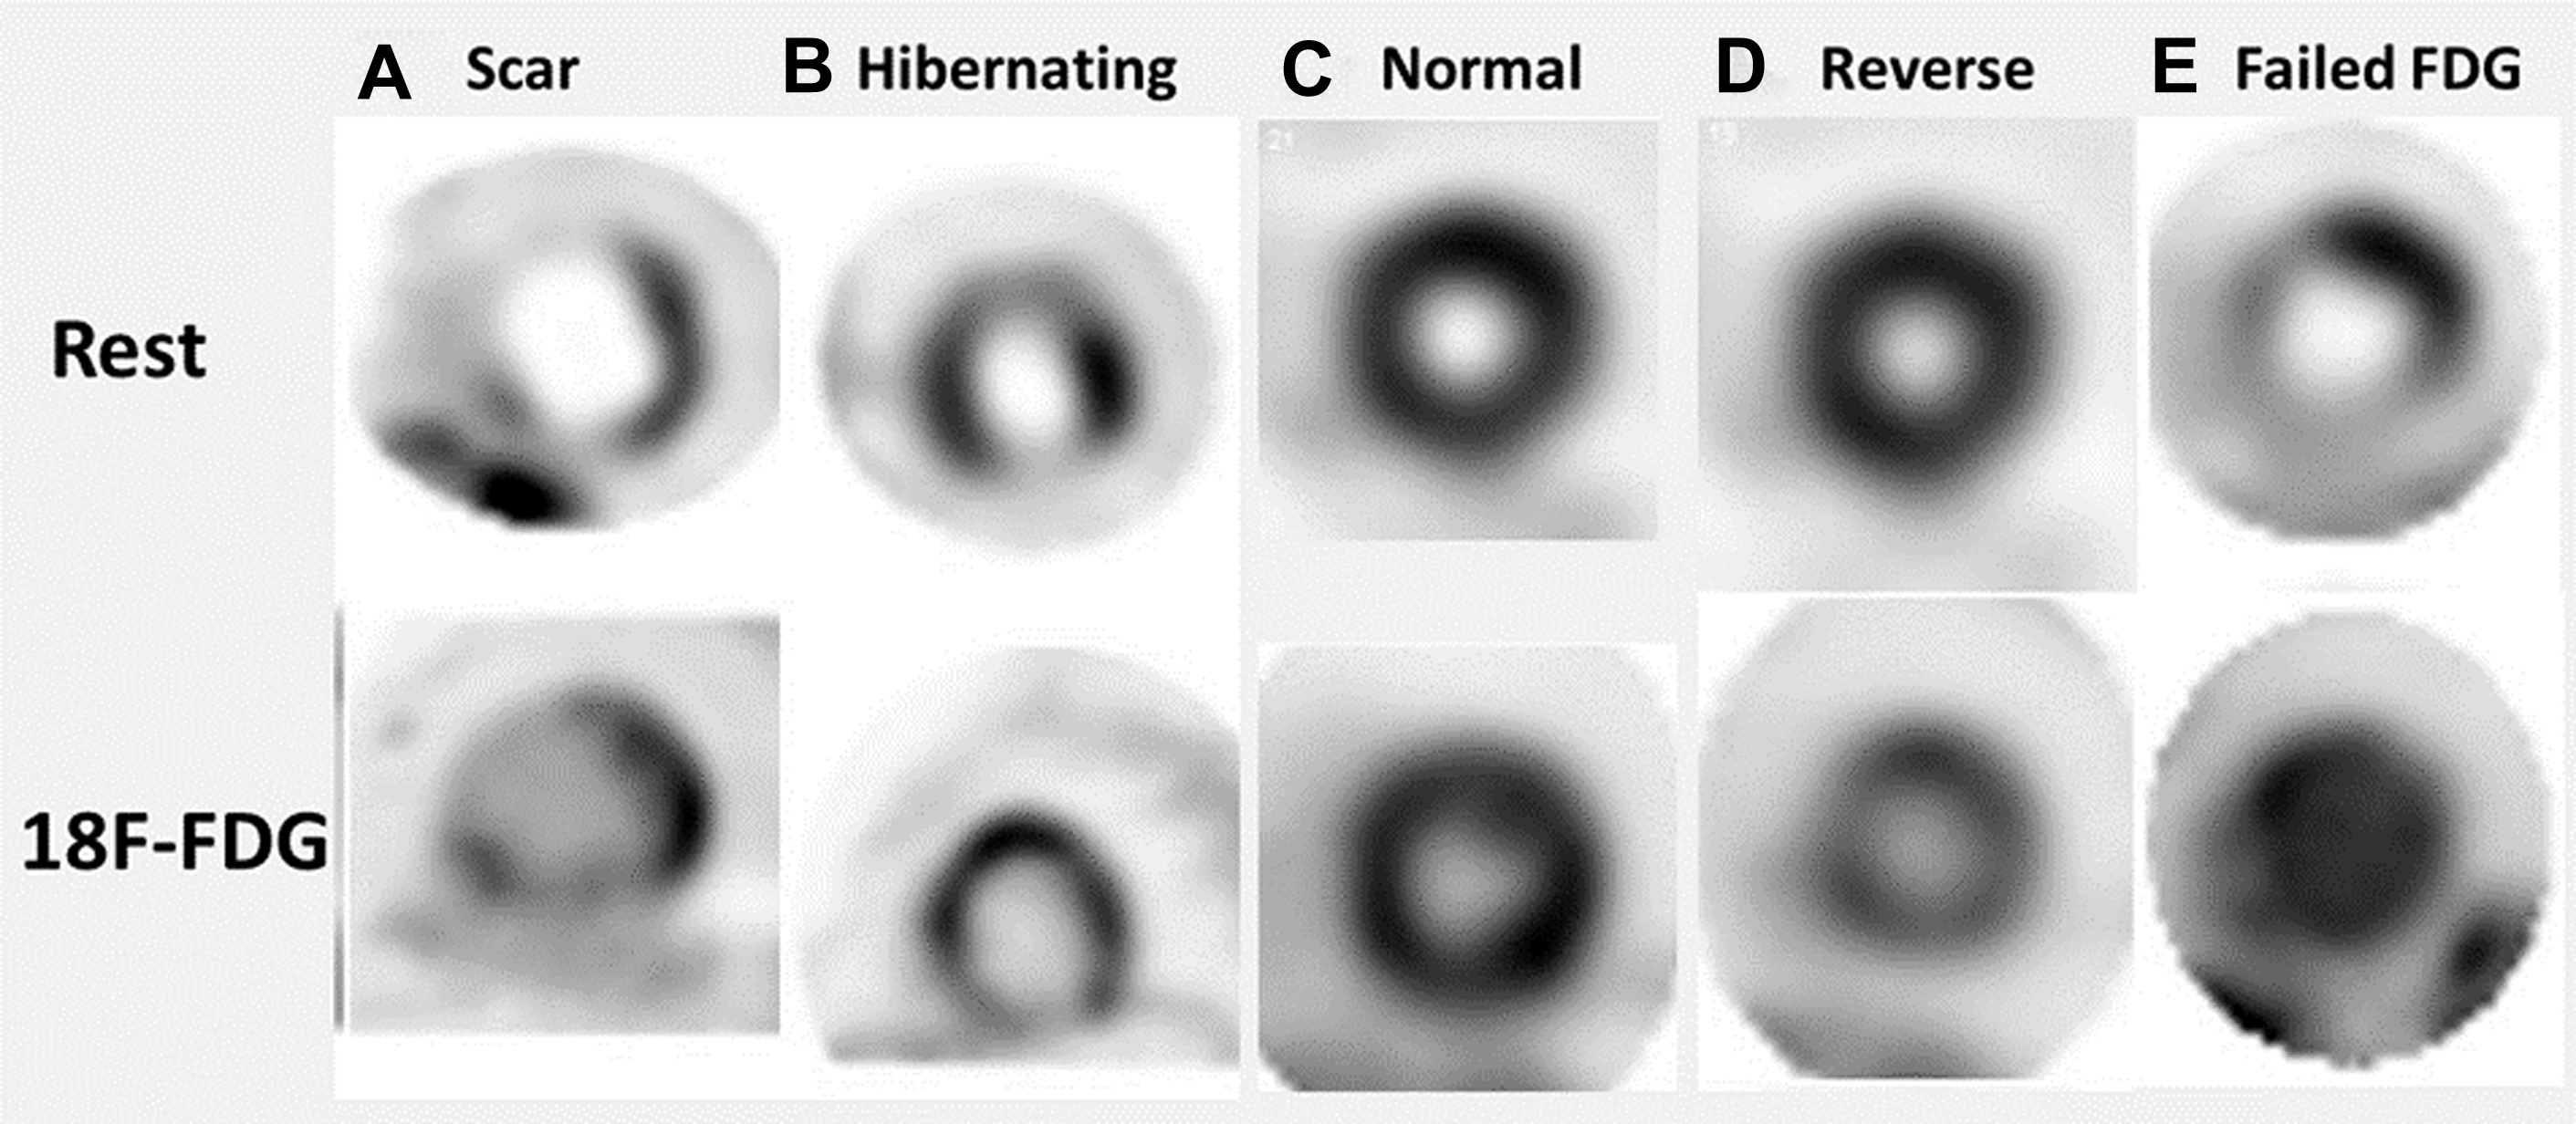
Once both perfusion and metabolism imaging are completed, the 2 image data sets are aligned, and interpretation is based on 1 of the 4 distinct perfusion-metabolism patterns, as shown in Fig. 4 . There are certain limitations of FDG viability assessment, namely FDG uptake, that can be impacted by the degree of underlying ischemia, coexisting abnormalities in sympathetic activity, and the severity of reduction in cardiac output/severity of underlying heart failure.
Clinical Implications and Value of PET Viability Assessment
The results from multiple, single-center, observational, nonrandomized studies have shown viability imaging to be valuable in guiding decision making regarding revascularization in patients with ICM, meaning that patients with hibernating (viable) myocardium have been found to have lower mortality following revascularization. Di Carli and colleagues showed that in patients with viable myocardium detected by PET imaging, surgical revascularization compared with medical management was associated with improved 4-year survival (75% vs 30%; P = .007) as well as improvement in the severity of angina and symptoms of heart failure. A more recent study on 648 patients by Ling and colleagues also found that revascularization correlated with improved survival in patients with hibernating myocardium, particularly in those with more than 10% viable myocardium. These findings highlight one of the important criteria in assessing the benefits of revascularization in patients with hibernating myocardium, namely the extent of viability/hibernation. It has been shown that in patients with a higher mismatch of perfusion-metabolism (ie, larger extent of hibernation), the benefits from revascularization are larger. The opposite also is true, meaning when the extent of mismatch is small (less than 7%), there is not much value in pursuing revascularization. Additional factors that should be considered when planning for revascularization include the LVEF and the renal function. Despite showing benefit of PET viability imaging to guide revascularization, these studies have undergone scrutiny due to their nonrandomized, single-center, observational design and due to the potential for including confounders and some of them only having small number of hard outcomes. ,
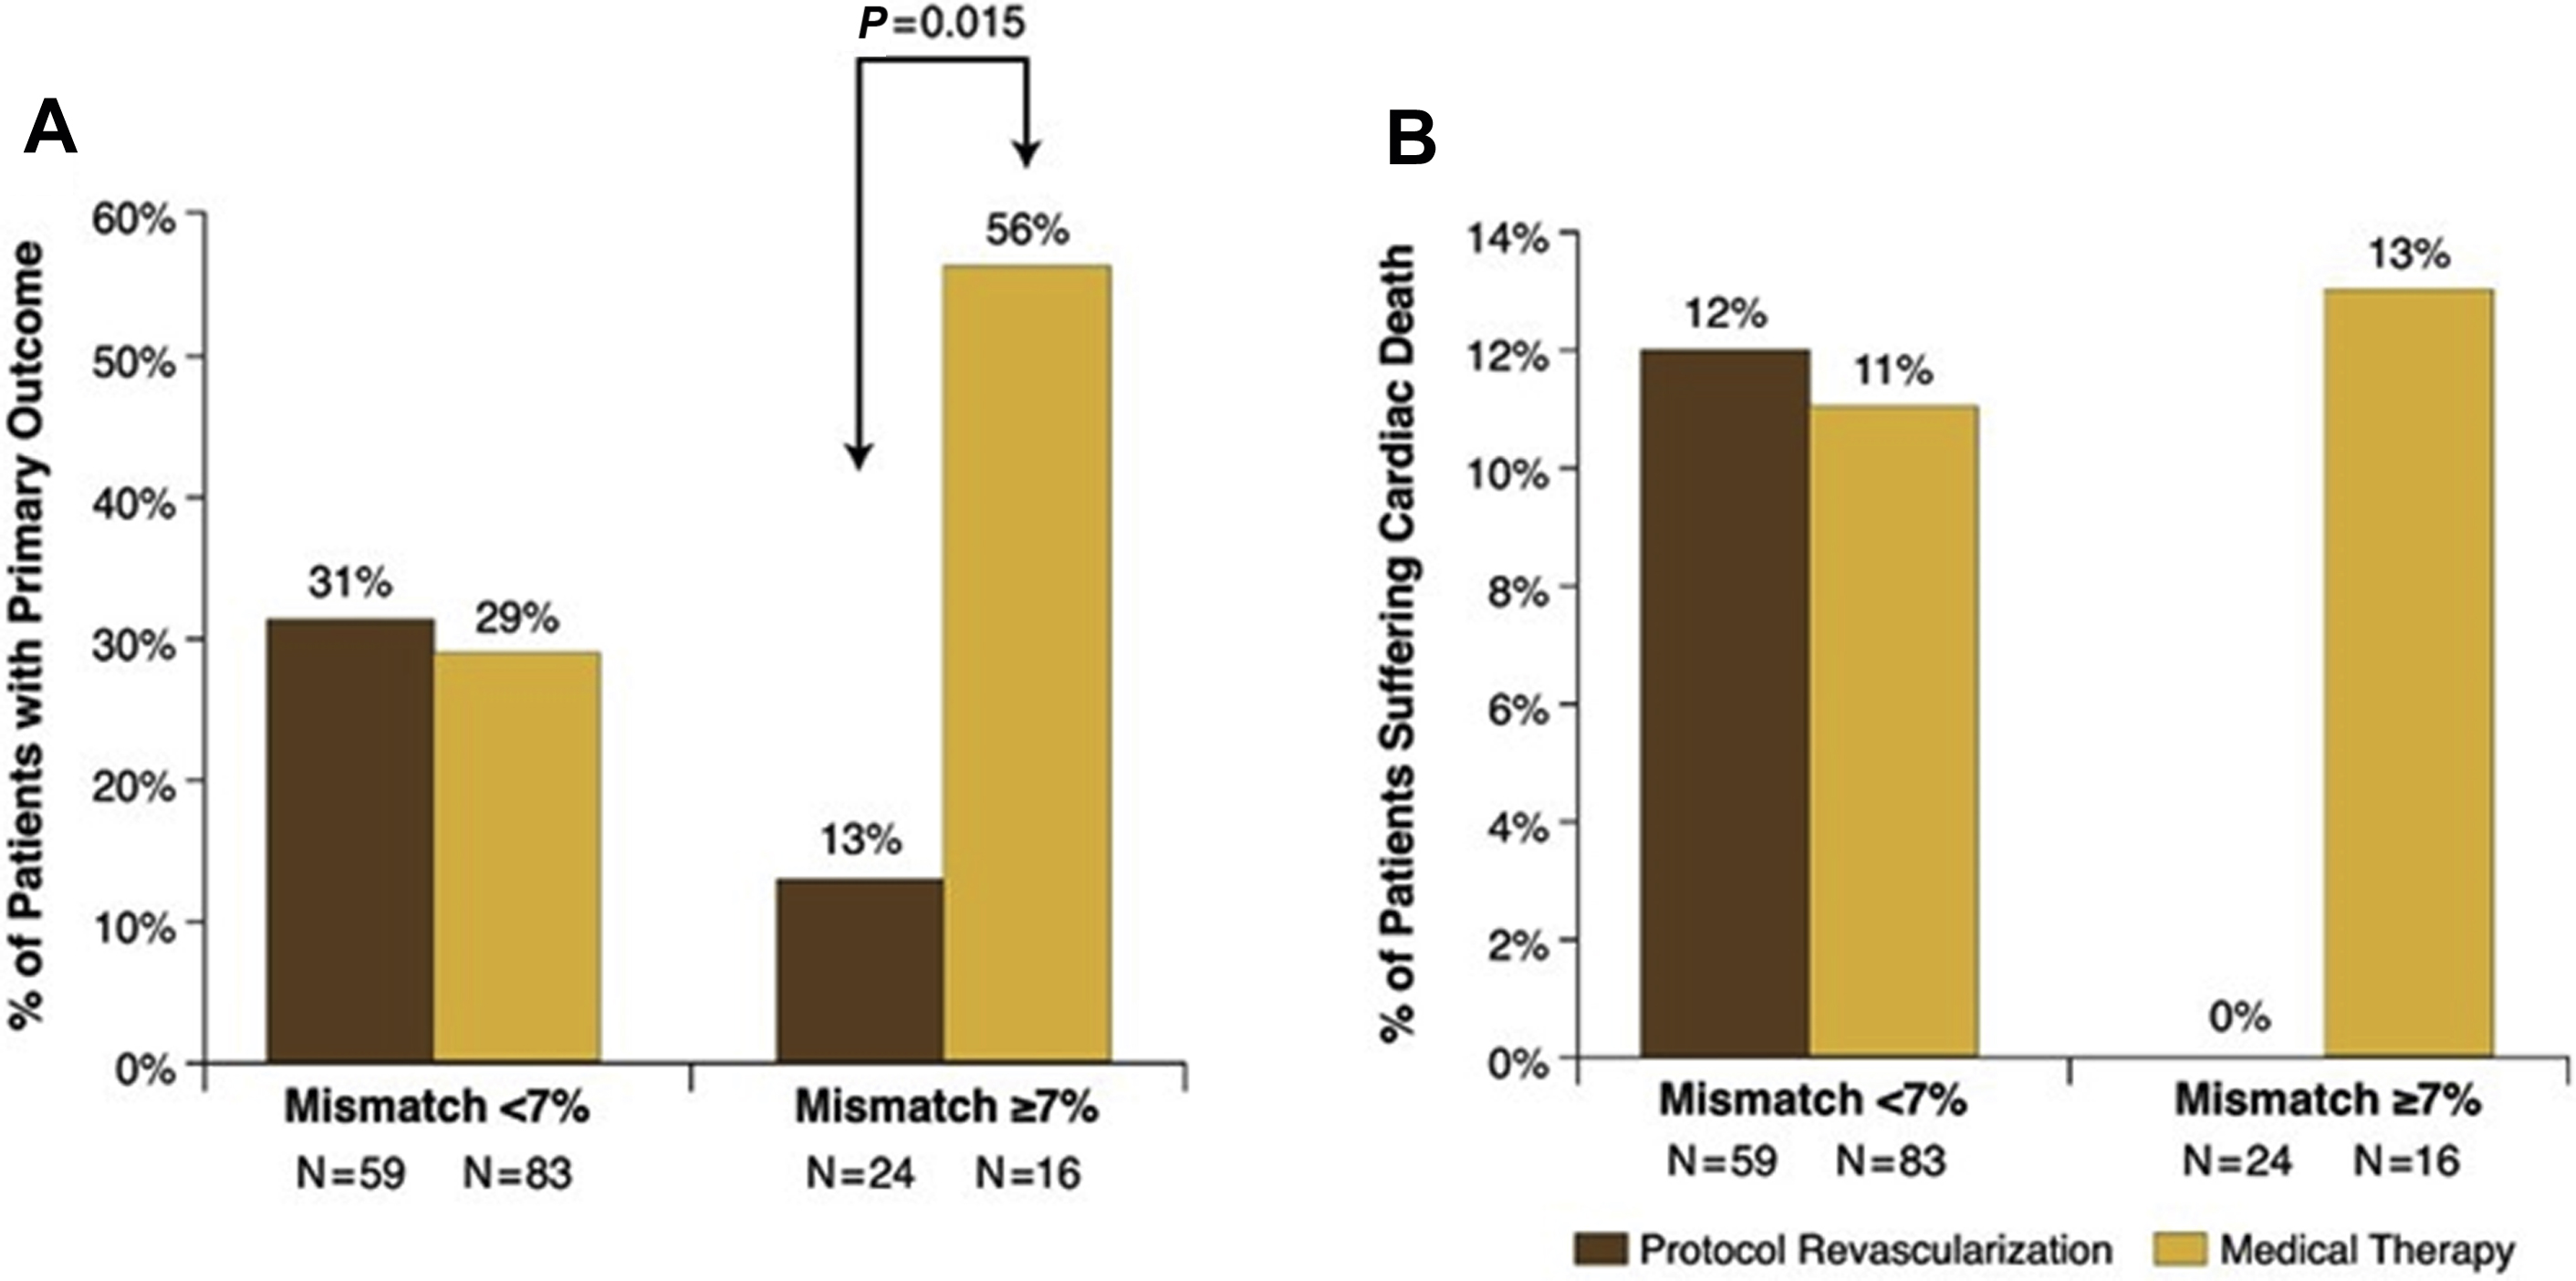
To date the PET and Recovery Following Revascularization-2 (PARR 2) has been the only large, multicenter study that randomized 430 patients with known or suspected CAD to either FDG PET/CT viability imaging versus standard of care. Over a 12-month follow-up, patients who underwent PET viability imaging showed a nonsignificant lower composite outcome of cardiac mortality, myocardial infarction, or hospitalization due to heart failure or angina. In contrast, a post hoc analysis of 5-year follow-up comparing patients who adhered to PET recommendations for revascularization versus standard of care showed a significant improvement in event-free survival in the former and in those patients with a mismatch of at least 7% in extent ( Fig. 5 ). , Two important caveats of the PARR 2 are that only 25% of patients adhered to the PET-guided recommendations for revascularization and the variability in PET-related resources and expertise, which may have influenced decision making and patient management. , Future research for evaluation of the advantage of using advanced imaging (PET and CMR) is the focus of Alternative Imaging Modalities in Ischemic Heart Failure (AIMI-HF) trial, which itself is part of the larger, multitrial project of Imaging Modalities to Assist with Guiding Therapy and the Evaluation of Patients with Heart Failure ( Fig. 6 ).