Fig. 20.1
For orientation, macroanatomical structures are delineated on the left hemisphere of the Collin standard brain. Shown are a view from mesial (left), two axial sections 11 mm below and 6 mm above the anterior commissure – posterior commissure (ac-pc) plain (middle) and a view from lateral (right). The set of regions follows the one (“atlas”) implemented in the Pmod 3.1 software tool (Pmod, Zürich, Switzerland). Abbreviations: 1 caudate nucleus, 2 globus pallidus, 3 epiphysis, 4 lowest extension of the mesial parietal lobe, 5 lingula or gyrus lingualis, 6 corpora mammillaria, 7 substantia nigra (brown stripe inside the mesencephalon), A amygdala, ACC anterior cingulate cortex, Ang angular gyrus, BA Brodmann area, CC corpus callosum, Cereb cerebellum, F1 superior frontal gyrus, F2 medial frontal gyrus, F3 inferior frontal gyrus subdivided into F3orb, pars orbitalis, F3tg, pars triangularis containing BA45, F3op, pars opercularis containing BA44, BA44 and 45 make up the Broca region, Fus fusiform gyrus, Heschl transversal temporal gyrus, containing the primary acoustic cortex, Hip hippocampus composed of fascia dentata and cornu ammonis; Mes, mesencephalon, O1 superior occipital gyrus, O2 middle or lateral occipital gyrus, OFC orbitofrontal cortex (gyrus rectus and gyrus supraorbitalis), P1 superior parietal gyrus, P2 inferior parietal gyrus, PoG or postcentralG postcentral gyrus, PrG or precentralG precentral gyrus, PrGop opercular part of the precentral gyrus, Put putamen, Supramarg gyrus supramarginalis, T1 superior temporal gyrus containing at its posterior upper face the Wernicke region (posterior part of BA22), T2 middle temporal gyrus, T3 inferior temporal gyrus, Thal, thalamus Tpol, temporal pole composed of the rostral parts of T1 and T2, U uncus or gyrus uncinatus, X-opt chiasma opticum
20.2 New Aspects of Longstanding Diagnostic Applications
Since the beginning of the PET era in the 1980s, cerebral blood flow and metabolism have been studied using [18F]FDG and [15O]tracers in key neurological conditions such as stroke, epilepsy, or degenerative disease. [18F]FDG and [15O]tracers have also been the diagnostic gold standard in the broad field of neurophysiological and psychological activation studies. Also the dopaminergic system has been acceded by SPECT and PET since a long time. Whenever [18F]FDG is used for serial measurements with partially investigatory purposes, absolute quantitation of regional cerebral metabolic rate of glycolysis (rCMR Glc) is desirable in order not to neglect global effects. Therefore, an arterial input function is required. Here, as an easy alternative to circumvent arterial blood sampling, emission data acquisition from the cardiac blood pool at a thoracic bed position during 35 min following injection is established. Some venous blood samples serve for calibration [6, 7]. Many changes of rCMR Glc due to interventions or disease are global and local. At rest glucose consumption in the brain, in average 29–32 μmol/min/100 g tissue, amounts to about 25 % of that of the total body. The local range spans from 15 to 22 μmol/min/100 g in white matter to 45–50 μmol/min/100 g in the visual cortex [8]. The following sections 3-7 deal with these new aspects of “old” applications. Sections 8-13 present new applications. Sections 14 and 15 give an overview by disease and by target, respectively.
20.3 Role of [18F]FDG in Neurodegenerative Disease
For more than a decade, [18F]FDG-PET was an in vivo “gold standard” in the differential diagnosis among the different entities of dementia and mild cognitive impairment. However, the advent of reliable pathobiochemical markers, refinement of the neuropsychological phenotype and of MRI acquisition, and analysis techniques fundamentally changed the clinical and diagnostic approach to and concept of neurodegenerative disorder.
20.3.1 New Concept of Amyloid Pathology and Alzheimer’s Disease (AD)
Especially for amyloid pathology, cerebrospinal fluid markers and PET amyloid ligand imaging markers have been validated in larger biopsy and autopsy cohorts. This enables diagnosis of prodromal AD (synonym MCI due to AD) in a large quantity of unambiguous cases especially for highly enriched study cohorts. The current concept of the International Working Group (IWG) around Bruno Dubois [9, 10] requests:
- 1.
A gradual deterioration of memory over more than 6 months with an amnestic syndrome where delayed cued recall is compromised
- 2.
A pathophysiological marker, CSF, or amyloid PET
- 3.
A topographical marker, either medial temporal lobe atrophy (assessed by volumetry/morphometry) or hypometabolism in [18F]FDG-PET in parietotemporal regions including posterior cingulum (PCC) and precuneus
CSF is to be sampled in polypropylene tubes to minimize adsorption and displays low Aβ1–42 (<550 pg/ml [11]), low ratio Aβ1–42/Aβ1–40 (<0.1 [11]), high tau (>614 pg/ml [11]), high serine 181 phospho-tau (>61 pg/ml [12]), and high ratio tau/Aβ1–42. Knowledge of the individual status of the apolipoprotein E (APOE) polymorphism (isoforms ε2, ε3, or ε4, whereby ε4 carriers have increased risk of developing AD amounting to 10-30-fold in homozygous) considerably contributes information.
In addition, the familiar genetic mutations of amyloid precursor protein (APP) presenilin 1 or 2 (PS1 or PS2) are highly orientating. In up to 80 % of AD cases, there is a familial genetic background, the penetration of which is not obligatory and may vary in a wide continuum [13].
20.3.2 Other Dementias and Mixed Pathology
One reason for the incomplete specificity (about 94 %) and limited sensitivity (about 84–96 %) of [18F]FDG-PET in the diagnosis of AD is that the pattern of moderate parietotemporal hypometabolism including PCC and precuneus is also found in cognitively normal subjects affected by atherosclerosis, diabetes, and obesity. In non-demented Parkinson’s disease (PD), lateral parietal hypometabolism prevailed, whereas in the continuum of PD with dementia (PDD) and Lewy body disease (LBD), hypometabolism was observed in the occipital cortex (BA18) in addition to PCC and precuneus. In LBD, specificity and sensitivity of [18F]FDG-PET were estimated at 67 % and 83–99 %, respectively, and in frontotemporal lobe dementia (FTLD) about 89 % and 97–99 % [14, 15].
There is a large spectrum of mixed pathology and overlap in amyloid deposition, dopaminergic deficit (revealing Lewy body pathology), and vascular pathology. Therefore, the evolution goes away from setting a singular diagnostic etiquette rather to determining the contribution of each pathology to a given case using CSF markers, amyloid PET, dopamine transporter (DAT) SPECT or PET, and morphological MRI (searching for macro- and microinfarcts, microbleedings, and perivascular edema).
In FTLD there is less overlap with amyloid pathology. Typically, glucose hypometabolism involves the frontal, anterior temporal, and anterior cingulate cortex. See Fig. 20.2 for different patterns of hypometabolism. A similar frontal pattern can be observed in cases of amyotrophic lateral sclerosis (ALS), also essentially a ubiquitin pathology and of progressive supranuclear palsy (PSP), a tau pathology with accompanying frontal syndrome. In addition, tau radioligands are upcoming, while imaging markers of ubiquitin pathology – coming with disturbance and precipitations of TAR-DNA binding protein 43 (TDP43) and fused in sarcoma protein (FUS) – are not yet in view.

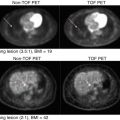
Fig. 20.2
Clinical cases of dementia syndromes assessed by [18F]FDG-PET. Given are orthogonal maximum intensity projections of pixelwise Z-statistics of relative regional cerebral metabolic rates of glucose (rCMR Glc). The individual and an age-matched normative control cohort are compared. The decrease versus controls is rainbow color coded, blue codes minor, and red most intense decreases. AD Alzheimer dementia, FTLD frontotemporal dementia, LBD Lewy body dementia. The diagnosis was further confirmed by measurements of amyloid and tau in CSF and clinical follow-up. Given are the individual disease durations
Vascular dementia (VaD) is primarily diagnosed upon the one- or multi-stepwise discontinuous evolution and MRI or cranial computed tomography (cCT). However, metabolic defects or deficits may considerably exceed MRI lesions. As a function of the subcategory of VaD, in multinfarct VaD, an overlapping pattern of multifocal hypometabolism may be observed corresponding to the respective areas of (silent) infarcts or malperfusions. In states of subcortical VaD/multi-lacunar infarcts/leukoaraiosis, [18F]FDG uptake may be decreased in the basal ganglia, cerebellum, and diffuse cortical areas. Occasionally, the state after so-called “strategic” infarcts, e.g., in the gyrus angularis, inferomedial temporal lobe, dorsomedian thalamus, or basal forebrain, can mimic features of dementia. In the latter cases, [18F]FDG may reveal large cortical areas of deafferentation [16].
20.3.3 Use and Technical Aspects of [18F]FDG-PET in the Frame of Clinical Trials
Notwithstanding, [18F]FDG-PET proved highest sensitivity as a progression marker [17] in longitudinal AD trials studying pharmacological [18–20] and other interventions. Amyloid PET proved unsuitable for this purpose as amyloid ligand binding slowly responds to interventions and amyloid deposition occurs early in the sequence of pathological events. Furthermore, in any atypical or gray cases, [18F]FDG-PET still contributes to the characterization of the neurofunctional state.
In the recent years, a composite index (PALZ) of [18F]FDG-PET-evidenced hypometabolism comprised within the PMOD software package (PMOD, Zurich, Switzerland) has been increasingly used for quantitation purposes in studies. The Minoshima tool (3D-SSP/Neurostat) is widely established for fast calculation of individual parametric Z-score datasets in comparison to an integrated control cohort. The visualization of Z-scores in maximum intensity projection increases accuracy especially of non-experienced raters (c.f. Fig. 20.2) [21].
The superiority of [18F]FDG-PET over perfusion SPECT using [99mTc]HMPAO has been clearly evidenced in direct comparison [14].
Usually non-partial volume corrected [18F]FDG-PET are used which reflect the composite of functional compromise and atrophy and thus are more sensitive. In order to identify areas of compensatory relatively upregulated metabolism, partial volume corrected PET were analyzed. In AD, the left and to a less extent right amygdala were identified as sites of highest metabolic compensation, whereas hypometabolism was most overproportional to loss of parenchyma in the PCC [22].
It has to be kept in mind that corticoids, any CNS-depressing drug (e.g., psychotropic, narcotic, sedative, antipsychotic), or state (postsurgical, previous chemo- or radiotherapy) will not only reduce global rCMR Glc but also affect the regional distribution pattern, while stimulants, e.g., caffeine, nicotine, cocaine, and amphetamine, may rather increase global rCMR Glc while activity and sensorial stimuli may increase local rCMR Glc [23].
Nuclear imaging techniques recently have been included into guidelines for the diagnostics of dementia disorders, e.g., of NIH, Alzheimer’s association, AHRQ, NICE etc.
20.4 [18F]FDG in Various Conditions
20.4.1 Movement Disorders and Functional Disorders
PET can contribute valuable information in the characterization of various movement disorders such as dystonias, tics, tremors, etc. Especially [18F]FDG may help to differentiate central and peripheral origins. For example, a patient with up to 100 faciobrachial dystonic seizures per day consecutive to an autoimmune encephalitis showed intense bilateral putaminal hypermetabolism [24].
[18F]FDG-PET may contribute additional orientation among atypical parkinsonian syndromes. In corticobasal degeneration, typically highly asymmetrical [18F]FDG uptake is observed with hypometabolism including the cerebral cortex, striatum, and thalamus [23, 25]. In multisystem atrophy, parkinsonian variant (pMSA), there is isolated striatal hypometabolism and in PSP bilateral frontal hypometabolism [23, 25]. See 20.3.2 for PD and LBD.
In several cases, the functional or somatic nature of a symptom is not clear. Here [18F]FDG-PET can reveal, e.g., areas of cortical under-function. For example, cortical deafferentations after punctiform thalamic infarctions can be detected, and aphasia can be differentiated from a pure functional aphasia in the context of a reactive depressive episode [26]. In a cohort of 11 patients with unilateral pain-related nondermatomal somatosensory deficits, hypometabolism in the contralateral postcentral gyrus, posterior insula, and putamen was observed [27].
20.4.2 Major Depressive Disorder (MDD)
A large meta-analysis on resting state [18F]FDG in depressed episodes within major depressive disorder (MDD) [28] evidenced hypometabolism in the pregenual and posterior cingulum, the BA9 part of middle frontal gyri (or dorsolateral prefrontal cortex, DLPFC) and insula bilaterally, and the left superior temporal gyrus. Hypermetabolism, in turn, was observed bilaterally in the BA10 area situated in the most rostral portion of superior and medial frontal gyrus, in the thalamus and the left caudatus. The outcome of these clinical cohorts is (necessarily) heterogeneous as various and different etiopathologies may underlie MDD. Especially, active inflammatory pathology would rather come with hypermetabolism, while degeneration implies hypometabolism. Subjects may have been scanned at various time points in the course of undulating symptoms, i.e., at the beginning of or during a depressive episode, in the recovery phase, or in (relative) remission. Furthermore, specific activation patterns could be closely correlated to specific individual symptoms so that the final picture may reflect an overlay of symptom correlated (state) and disease or pathology immanent (trait) metabolism/activation.
A series of studies investigated [18F]FDG uptake or perfusion at baseline and after treatment. Whatever type of treatment was applied, findings converged to a compensation of hypofrontality and disappearance of the subgenual anterior cingulate cortex (sgACC) activation in responders.
In detail, selective serotonin reuptake inhibitors (SSRI) increased metabolism in dorsal anterior and posterior cingula, both middle frontal gyri (BA8/9, 46, 47), and the gyrus supramarginalis, while activity in sgACC, parahippocampal gyri, right insula, and left putamen was decreased [28]. In this meta-analysis, 9 [18F]FDG studies were included with 22 patients treated by fluoxetine, 51 patients treated by paroxetine, and 6 by citalopram. Further studies directly compared paroxetine versus interpersonal psychotherapy [29], venlafaxine versus cognitive behavioral therapy [30], and double-blind fluoxetine versus placebo [31]. In all studies prefrontal and dorsal cingulum hypometabolism recovered, while rCMR Glc decreased in sgACC, parahippocampus, and thalamus [31]. In addition, medication involved additional metabolic changes in the striatum [30, 31], brainstem, and hippocampus [31]. A single total sleep deprivation was most effective in normalizing anterior cingulate cortex (ACC) hyperactivity, while left prefrontal hypoperfusion normalized after the final recovery assessed by a third scan [32]. Electroconvulsive therapy increased ACC perfusion in responders (vide infra 4.3.2) [33]. Light therapy has only been assessed in 6 patients insufficient to detect changes in [18F]FDG uptake [34]. A recent [18F]FDG study absolutely quantified rCMR Glc using a venously calibrated cardiac input function 2 h after the infusion of subanesthetic ketamine (35 mg) or placebo in 21 depressed BD patients. After ketamine, rCMR Glc was nonsignificantly decreased globally by 0.3 % and locally in posterior brain regions such as the lingual and fusiform gyri, occipital cortex, and cerebellum and furthermore in both hippocampi and the left thalamus. The only significant finding was an increase by 2 % in sgACC, the amplitude of which furthermore correlated with the clinical response. The inverse correlation was observed in the right ventral striatum [7].
Conversely, re-induction of depression in remitted patients by nutritional tryptophane depletion was accompanied by a re-apparition of prefrontal hypometabolism [35].
A third type of studies measured the response amplitude of metabolism/perfusion to diverse behavioral, especially emotional stimuli. Positive emotional stimuli elicited less activation in MDD compared to controls in the left posterior orbital gyrus and left cerebellar posterior lobe and more activation in sgACC and inferior frontal gyrus (areas 47 and 11). The response to negative stimuli was increased in the right superior temporal gyrus [28].
A fourth type of analysis aims at extracting predictors for the response to a given type of treatment from baseline scans of those patients where thorough, in-depth, and long-term clinical follow-up is available. Also in view of the abovementioned findings, the sgACC was considered an indicator of treatment response [36] and a promising target for deep brain stimulation in progressive secondarily refractory MDD, which has been realized meanwhile in at least 45 published cases. However, a controlled randomized double-blinded trial was discontinued in 2014 because of inefficiency [37]. Further neuroimaging biomarkers as predictors for differential treatment response are under investigation [38]. Moreover, the response amplitude to a decision-making activation task was higher in the ACC in maniac and lower in the frontal pole of depressed patients versus controls, even more accentuating the corticolimbic divergence.
20.4.3 Bipolar Disorder (BD)
In BD cohorts, during depressive episodes, similar to MDD, prefrontal (DLPFC and dorsal ACC) under-function and over-function of limbic structures within the ACC, anterior temporal cortex, amygdala, and parahippocampus were observed [39]. About 2 dozens of rCMR Glc and rCBF studies using PET and SPECT of patients in depressive, euthymic, or maniac state of BD converged toward the following findings: frontal metabolism is low compared to controls in euthymic, lower in depressive, and lowest in maniac state, while ACC metabolism is high compared to controls in depressed, higher in euthymic, and highest in maniac BD patients [40]. This activation pattern was the substance of the (fronto-) corticolimbic theory of mood disorders. Moreover, the amplitude of response to a decision-making task was higher in maniac patients which presented even higher CMR Glc in the ACC and in depressed patients with even lower CMR Glc in the frontal pole [41].
20.4.4 Schizophrenia
Current clinical criteria of schizophrenia, e.g., in the ICD-10 2004 (edited by the World Health Organization), section F20, comprise distortion of thinking, perception, and inappropriate or blunted affects. Specification still relies on the first rank criteria formulated by Kurt Schneider in 1938 [42] which are also termed “positive symptoms”: thought echo, thought insertion or withdrawal, thought broadcasting, delusional perception and delusions of control, influence or passivity, and hallucinatory voices commenting or discussing the patient in the third person. “Negative symptoms” may precede and persist after an acute episode and comprise avolition; cognitive, emotional, and speech deficits; and psychomotor poverty. In the DSM V, more general terms are used and further clarification shifted to the footnotes. Schizophrenia is a diagnosis by exclusion of any somatic origin and developmental disorders and excluding especially psychoactive drugs. No instrumental or biochemical test is established so far.
A seminal study investigated resting state [18F]FDG-PET with absolute quantification by an input function of arterialized blood radioactivity concentrations in 26 drug-naive schizophrenic (SZ) patients versus 32 controls. A global reduction of cerebral glucose metabolism by about 5–6 % was observed, particularly in medial and left prefrontal areas BA9 and 10 (−6 %), primary sensory cortex (−8 %), precuneus (−7 %), and both thalami (−10 %), reaching significance here (T-value 2.5 and 21) [43].
A comparison of 67 drug-naive first-episode schizophrenic patients and 103 healthy controls in [18F]FDG-PET under activation by a serial verbal learning test revealed dramatic hypometabolism engaging the entire prefrontal, posterior parietal, and lateral temporal cortex, caudate nuclei, and mediodorsal thalamic nuclei. Relative hypermetabolism was detected in the pregenual ACC and anterior temporal lobe, including the gyrus uncinatus. As usual in clinical cohorts, no arterial blood samples were available, and therefore, uptake values were only relative and not absolute. Furthermore, the entire brain and not, i.e., the pons or cerebellum, served as reference region. Therefore, it is probably a technical side effect that relative white matter SUVs were almost globally increased in SZ. Rather, glucose metabolism may have been globally decreased with frontoparietal, caudate, and thalamic accentuation [44].
When it comes to later states of schizophrenia, the bias of medication compromises any comparisons to healthy controls. However, it is of key interest to investigate states dominated by positive symptoms such as delusions, acoustic verbal hallucinations (AVH), mental disorganization, and reality distortion well separated from states of pure negative symptoms. Therefore, it was an innovative approach of a Milan-based group to compare a cohort of patients with negative symptoms with a cohort of BD, treated by similar doses of the same atypical antipsychotics. Drug load was accounted for as covariate. A voxel-wise SPM8 comparison of SUV images revealed at best insignificant differences in cortical and gray matter uptake pattern, while relative white matter metabolism was significantly higher compared to BD. This again can be interpreted as sign of globally lower rCMR Glc in negative-symptom schizophrenic patients compared to MDD [45]. Inputs to SPM8 were unreferenced SUV values, but in the intrinsic algorithms of SPM, there are global normalizations at one or two steps in data processing, and a ROI wise measurement of absolute values may have yielded constant white matter rCMR Glc.
In schizophrenia research the same patients were scanned during acoustic verbal hallucinations (AVH) and in intervals free of hallucinations. Other studies compared hallucinators and non-hallucinators. Findings converged to activations of primary and secondary acoustic cortices and, surprisingly, not necessarily activation of the Wernicke region but even more of the Broca region, furthermore of supplementary motor cortices, ACC, and striatum, as reviewed by Bossong and Allen [46]. Targeted individualized repetitive transcranial magnetic stimulation (rTMS) onto left temporolateral areas hyperactive during hallucinations could considerably alleviate hallucinatory pathology [47].
20.4.5 Other Neuropsychiatric Disorders
In anxiety-spectrum disorders including specific phobia and social anxiety disorder, a series of activation studies under provocation conditions evidenced hyperperfusion/metabolism of a “fear network” [48] comprising the amygdalae, midbrain (periaqueductal gray) insula, and ACC, while activity in the orbitofrontal cortex (OFC) decreased as a function of fear [49]. In posttraumatic stress disorder, a related pattern was observed but with inconstant and rather inversed behavior of ACC and OFC [49].
In obsessive compulsive disorder (OCD), common findings were glucose hypermetabolism in ACC, caudatus, and OFC. Successful SSRI or cognitive behavioral therapy normalized metabolism in caudatus and OFC [50–52].
In multiple sclerosis, [18F]FDG showed gray matter hypometabolism in MS which longitudinally progressed, and the site of which was well related with dominating symptoms such as thalamic and hippocampal hypometabolism with memory dysfunction and scattered frontal hypometabolism with frontal syndrome [53].
In ALS, if the primary motoneurons are affected, hypometabolism of the motor cortex is observed as a “stripe” sign. Furthermore, frequently frontal glucose hypometabolism is observed [23]. In both, most cases of FTLD and most cases of ALS ubiquitin pathology are observed coming with inclusions of TDP-43 and more rarely of FUS, which can spread into the frontal lobes. In Creutzfeldt-Jakob disease, fronto-parieto-occipital hypometabolism was reported, while temporal [18F]FDG uptake was comparatively preserved [54].
20.4.6 Risk Assessment of Carotid Plaques/Chronic Ischemia
The advent of PET-CT combination enabled also the combination of CT contrast angiography and PET. In such combined datasets acquired after prolonged washout, 90 min after injection of 370 MBq [18F]FDG, it was possible to resolve active and non-active sectors of carotid plaques. The respective target-to-background ratio (TBR) may be further established as sensitive parameter of plaque activity, vulnerability, and inflammation which promises a closer link to the pathomechanism compared to purely morphologic measures of lumen obstruction. [18F]FDG TBR allowed good discrimination of asymptomatic plaques with and without microembolic transcranial Doppler signals registered over 60 min [55]. Also TBR was higher in the 60 symptomatic compared to the 63 asymptomatic patients examined. In a clinical trial of the anti-atherosclerotic drug dalcetrapib, carotid plaque [18F]FDG-PET/CT TBR obtained at baseline and in 3 and 6 months served as longitudinal readout biomarker in 92 patients. Dalcetrapib is a cholesteryl ester transfer protein (CETP) modulator. Unfortunately, none of the plaque measures changed differentially in the verum and placebo group [56]. Smaller precedent studies were concordant [57, 58]. This method could fully exploit its strengths when combined with a measurement of the cerebrovascular reserve such as [15O]H2O-PET with and without acetazolamide challenge, see 20.7.2.
20.5 Contribution of [18F]FDG and other PET Tracers to the Characterization of Epilepsies
In the clinical workup of epilepsy, the key interest is on focus localization. Highest accuracy can be achieved by comparing measurements of ictal and interictal brain functional state. Beyond electrophysiological techniques such as EEG and MEG, neuroimaging may contribute estimates of focus volume and shape and localize deep foci. In a considerable number of cases, extracranial EEG does not clearly localize the focus; here nuclear medicine techniques are of special value. As (i) the duration of most seizures is short within a time range of about 2 min and (ii) imaging “online” during clonic activity is hardly possible, an ideal tracer for seizure neuroimaging must have a (i) short uptake phase and (ii) a delayed washout behavior, ideally with trapping for several hours. Unfortunately the uptake period of [18F]FDG lasts for 30–45 min [59] so that it is unsuitable for ictal versus interictal comparisons. [99mTc]ECD (Neurolite™) in turn has proven almost ideal properties – high first-pass tissue extraction followed by metabolic trapping – and allows literally to freeze the functional state following the 60 s postinjection and to acquire the SPECT even 4 h later. This procedure has been established under the acronym of SISCOM (subtraction ictal SPECT coregistered to MRI) yielding spatial resolutions full width of half maximum (FWHM) of about 7 mm [60, 61]. In principle, the higher resolution of PET (FWHM down to 2 mm) could benefit established [99mTc]tracers (half-life, 6.0 h) when using [94mTc] (half-life 4.9 h), but, this cyclotron nuclide is rarely available and emits additional gamma at 703, 850, and 871 KeV, warranting special data correction algorithms. As there is no reactor PET nuclide with suitable half-lives – 67.6 h of 68Ga would be too long and 1.3 min of 82mRb too short – upcoming subtractive ictal versus interictal PET applications will be restricted to very specialized centers and research rather than routine applications. Cases of induced or very frequent seizures may be most suitable for such subtractive PET studies.
The second interest in epilepsy research is imaging the interictal state solely rather with a pathophysiological research purpose than in clinical routine. Only [18F]FDG found some larger dissemination and displays – in negative contrast – areas of interictal hypometabolism usually larger than the epileptogenic focus and of vague delimitation. [18F]FDG-PET/MRI is of special value in the search for focal cortical dysplasias and extra-temporal foci which are not apparent on MRI alone [59]. A recent Spanish study systematically acquired and compared MRI, coregistered [18F]FDG-PET, video-scalp EEG monitoring, [99mTc]HMPAO-SISCOM, and intracranial EEG in patients with refractory epilepsy [62]. Of all 35 patients, MRI, [18F]FDG-PET, and video-scalp EEG were available. In 11 of 15 patients with an MRI rated normal and in 19 of 20 patients with a lesion visible in MRI, [18F]FDG-PET/MRI could localize lesions concordant with the final EEG focus, making a sensitivity of 86 %. Remarkably, in three cases scalp EEG was discordant with intracranial EEG, while PET was in only one of these. In total intracranial EEG as a gold standard was available in ten cases, in which PET was concordant in eight cases and discordant in one and showed hypometabolism considerably exceeding the focus in another case. SISCOM in turn was acquired in 25 cases. In 16 (64 %) of these, SISCOM was concordant with best EEG findings, while SISCOM was non-localizing or normal in six and discordant in another three cases because of too late injection or artifacts. In 7 of these 25 cases, intracranial EEG as a gold standard were acquired, yielding concordant results in 4 cases, a non-localizing SISCOM in 1 case, and discordant findings in 2 cases, thus making a sensitivity of 57 % [62]. This study underlines that a rational diagnostic algorithm should first acquire interictal [18F]FDG-PET which should imperatively be coregistered to MRI and on a second-level SISCOM.
A New England-based study reported on 53 patients with refractory epilepsy which all had [99mTc]ECD-SISCOM injected within 30 s after seizure onset and interictal [18F]FDG-PET but without coregistration to MRI [63]. Upon isolated visual inspection, only 23 (43 %) PET showed hypometabolic zones concordant with EEG foci, while 4 were discordant and in 26 cases PET was normal or non-localizing. Forty-seven SISCOMs revealed concordant areas of ictal hyperperfusion, while in the other six, there was discordance to even intracranial EEG. Consequently, of 48 cases with intracranial EEG recordings available, 42 confirmed SISCOM, corresponding to a sensitivity of 88 %.
A recent study showed the feasibility of presurgical combined hybrid [18F]FDG-PET/MRI and MR-compatible 256-electrode EEG. Structural MRI, resting state functional MRI correlated to interictal epileptic discharges, PET coregistered to MRI, and electrical source imaging were performed. No MRI acquisition was performed during the about 30 min uptake period of [18F]FDG in order not to stimulate auditory areas. In total, 12 patients were studied; complete datasets of all four modalities were obtained in five patients and partial data in the other. In 8 of 11 patients, [18F]FDG-PET coregistered to MRI-detected focal hypometabolism. Key advantages are simultaneity and thus observation of an identical functional and medication state of the brain, precise coregistration of PET and MR, optionally exact imaging, and easy integration of the electrode positions [64].
For visual interpretation, tilting of 3D datasets not ac-pc but parallel to the temporal lobe may be helpful so that within a double-banana-shaped aspect the contour of the temporal cortex can be followed entirely while minimizing overlay with the orbitofrontal cortex. Partial volume correction and simultaneous acquisition in hybrid systems may further increase the sensitivity of [18F]FDG-PET/MRI.
[11C]flumazenil has been used – as in cerebrovascular disease and stroke – to image the viability of brain tissue. Reduced [11C]flumazenil binding helped to detect epileptic foci in MRI-negative cases and yielded results concordant with EEG, e.g., in 7 of 16 patients [65].
20.6 [18F]F-DOPA and [11C]raclopride
[18F]DOPA as presynaptic marker of dopamine reuptake transporters (DAT) and aromatic L-amino acid decarboxylase (AADC) and [11C]raclopride as postsynaptic D2 ligand have been established since decades in the differential diagnostics of movement disorders and particularly parkinsonian syndromes and Lewy body disease (LBD). In clinical routine, imaging the dopaminergic system is of particular interest for cases of mixed or unclear pathology, i.e., when there is no clear response to L-DOPA/dopamine agonist treatment and the contribution of a – potentially treatable – dopaminergic deficit to a complex pathology is in question. [18F]DOPA has meanwhile an EU market admission and in addition to the advantages of PET over SPECT is selective for dopaminergic terminals in contrast to the tropane derivative DAT ligands [18F]FP-CIT or [123I]FP-CIT, [123I]β-CIT, and [99mTc]TRODAT which show also some binding to serotonin reuptake transporters (SERT) and norepinephrine reuptake transporters (NET).
As a large panel of neuroactive drugs and especially the agonists used in PD act on D2R and have long terminal or brain tissue elimination half-lives, imperatively individual washout times have to be respected at least so that cerebral concentrations can be expected below 1/10 K D. Therefore, a large part of D2R imaging in clinical routine, also using [123I]IBZM, has to be interpreted with big care. Moreover [11C]raclopride is one of the rare exceptional receptor radioligands which is susceptible to displacement by the endogenous neurotransmitter and suitable for the measurement of transmitter release (c.f. 6.1). Therefore, [11C]raclopride has been used in a large number of interventional (c.f. 5) and activation studies. In addition to its D2R binding capacity, [11C]raclopride is well suitable as a perfusion marker, and a first-pass tissue extraction radioligand delivery rate R1 can be fitted from dynamic datasets. This additional information has been exploited to increase the discriminatory power between PD and multisystem atrophy [66]. Dopamine receptor imaging in PD has been reviewed recently [67].
20.7 rCBF by [15O]H2O or [15O]CO2, OEF by [15O]O2, rCBV by [15O]CO or [11C]CO, rCMRO2, and Tissue Viability by [11C]Flumazenil
20.7.1 General
The circulatory and blood supply state of brain tissue has been characterized by the key parameters cerebral blood flow (CBF, ml/min/100 g of tissue), oxygen extraction fraction (OEF or E, unitless), and cerebral blood volume (CBV, ml/100 g). [15O]H2O–, [15O]O2–, and [15O]CO-PET, respectively, are still considered and used as the gold standard for the quick and accurate quantitation thereof. A typical setting involves injection of, e.g., 555 MBq [15O]H2O and dynamic image acquisition for 80 s. Absolute quantitation necessitates arterial blood sampling to constitute the input function. Traditionally emission scans are acquired over about 80–120 s post start of injection and entirely put into statistical analysis. Recently the influence of length and position of the time interval p.i. selected for analysis was systematically investigated in datasets from a motor task versus baseline. Highest statistical power and thus sensitivity of comparisons could be reached using 20–50 s p.i. for all regions [68]. Rather historical is the steady-state method for measuring CBF by continuous inhalation of constantly delivered [15O]CO2 which within about 10 min equilibrates into blood. Images were acquired over 20–30 min necessitating very high radioactivity doses but only few arterial blood samples. [15O]O2 and [15O]CO are applied by single inhalation of a tracer dose which very quickly enters the blood and equilibrates within. Signal acquisition also lasts over about 80 s. For correction, not only full-blood activity but also plasma activity has to be measured. As [15O]O2 virtually completely binds to hemoglobin, plasma activity almost exclusively accounts for the metabolic product [15O]H2O and has to be subtracted from the full-blood input function. For calculation of CBF and OEF, the CBV fraction has to be subtracted from the respective time-activity curve [69].
The cerebral metabolic rate of oxygen consumption (CMRO2, in average 3.2 mL/min/100 g, gray matter 6 mL/min/100 g, white matter 2 mL/min/100 g) is a derived parameter: CMRO2 = CBF × OEF. As an alternative to deriving CMRO2 from a triple tracer experiment using [15O]H2O, [15O]O2, and [15O]CO, a kinetic model has been established which allows calculating CMRO2, CBF, and CBV from a single dynamic [15O]O2 acquisition [70].
In this context, it should be kept in mind that the brain takes about 20 % of the total body basal oxygen consumption and about 15 % of the cardiac output, equaling 750 ml/min and globally 50–55 mL/100 g/min (20 in white matter and 80 in gray matter). The oxygen consumption of the entire brain is 50 mL/min which burn 60 mg/min glucose [26]. Average glucose consumption is estimated at 100 mg/min.
20.7.2 Measuring the Cerebrovascular Reserve
Perfusion measurements, preferentially by [15O]H2O-PET, are applied in clinical neurology in some situations to support decisions before interventions. Before revascularization interventions (e.g., carotid endarterectomy) in atypical cases or ventricular shunt placement, cerebral hemodynamics and reserve capacity of blood supply may be assessed while comparing scans at baseline and scans under induction of a luxury perfusion in well-perfused regions using acetazolamide [71–73]. Atypical cases comprise, e.g., those with comorbidity or not fulfilling standard time and gravity criteria or cases with complex anomalies of vascular anatomy or arteriovenous malformations. For this indication, also perfusion SPECT can be applied, nowadays preferentially with [99mTc]ECD which is superior to [99mTc]HMPAO. [99mTc]ECD is more stable in vitro; the cerebral distribution is more stable allowing to freeze the state at injection and readout 4 h later and more. The dosimetry is more favorable. However, [99mTc]ECD to some part reflects cellular metabolic uptake, while [99mTc]HMPAO purely correlates to blood flow arrival [26]. Thus, images will differ in states of perfusion-metabolic uncoupling. Both tracers slightly underestimate rCBF as first-pass tissue extraction is incomplete versus [15O]H2O. Luxury perfusion can alternatively be induced by hypercapnia (CO2) or – more common in myocardial scintigraphy – by adenosine.
20.7.3 Preoperative Identification of “Speaking” Brain Tissue
Before neurosurgical removal of brain tissue or endovascular interventions with unavoidable obliteration of blood vessels, “speaking areas” of the individual brain may be identified by individual activation studies while comparing scans at baseline with scans during a task assumed to involve the operation area and its neighborhood such as motor, speech, recognition, etc. On an individual level, [15O]H2O-PET is superior to fMRI due to its considerably higher sensitivity, dynamical range, and spatial accuracy [74]. The big advantage of [15O]H2O-PET is that on an individual level, typically 6–18 tracer injections and scans (“shots”) can be performed, yielding high statistical power [74]. Just very recently, PET/MRI combinations offered the possibility to simultaneously acquire [15O]H2O-PET in combination with blood oxygen level-dependent (BOLD) or arterial spin labeling (ASL) MRI sequences and thus validate the latter. Thereby, e.g., ASL correlated better with [15O]H2O-PET than did BOLD.
20.7.4 Quantifying Damage Extent and Rescue in Stroke
Classical work studied the perfusion defect in stroke and the extent of the center of irreversibly damaged tissue and the penumbra of salvageable tissue therein. The survival perfusion threshold could be experimentally determined at 17–18 mL/min/100 g for infinity, 15 for 80 min, 10 for 40 min, and 0 mL/min/100 g for 25 min. Large series of [15O]H2O-PET obtained typically few hours after stroke allowed a classification of a core zone with CBF below 12 mL/min/100 g with regularly infarction on later cCTs, the penumbra with CBF between 12 and 22 mL/min/100 g with some chances of infarction and some chances of recovery, and, third, a solely functionally and temporarily compromised area with CBF > 22 mL/min/100 g. In the penumbra, OEF is compensatorily increased to a maximum, while in irreversibly damaged tissue, OEF is low. OEF thus is the marker of the penumbra. In the subacute phase after ischemic infarct, a luxury hyperperfusion was particularly observed in areas with secondary loss of initially increased OEF [8]. This corresponds to malignant infarction with edematous propensity [8].
PET was at the origin of understanding the pathophysiological cascade after acute ischemia and elaborating the salvageable penumbra concept and deepened the understanding of timing and effect of i.v. thrombolysis. With the advent of MRI technology, at the end of the 1990s, diffusion and perfusion-weighted MRI (PWI and DWI) took the relay [8]. The perfusion-diffusion mismatch thereby corresponds to the penumbra but, however, tends to overestimate it depending on fine-tuning of PWI parameters [75]. When it comes to absolute quantitation of tissue gain and loss, PET and SPECT are still unrivalled. A study assessed the perfusion deficit before thrombolysis by [15O]H2O-PET and the final infarct size by DWI-MRI 3 weeks later [75]. However in clinical trials on revascularization, they are largely replaced by MRI techniques. As [123]ECD SPECT allows to “freeze” the state at injection and the signal can be read out hours later, a cCT and tracer injection can save some minutes time versus MRI before revascularization. [18F]fluoromisonidazole ([18F]FMISO) selectively enriches within hypoxic tissue. The “cold” compound was initially developed as radiosensitizer for tumor therapy. [18F]FMISO has been proposed as an alternative marker of the penumbra with selective enrichment in hypoxic tissue with residual perfusion [8, 76]. However, [18F]FMISO-enriching areas where not as accurately delimited as hyper-OEF areas [8].
The GABAA ligand [11C]flumazenil ([11C]FMZ) turned out to be a good marker of salvageable tissue within the penumbra and for irreversibly damaged tissue in negative contrast, respectively. Reliable thresholds for core, penumbra, and intact tissue could be set. The PWI-DWI mismatch showed good correlations with [11C]FMZ uptake.
20.8 Amyloid Imaging May Guide Inclusion into Clinical Trials
The development of tracers for cerebral protein deposits of Aβ-amyloid, protein tau, α-synuclein/Lewy bodies, ubiquitin/TDP43, etc., has been driven by the interest in early etiologic therapies. Therefore, the gold standard for evaluation of these tracers cannot be a vague clinical semiology but postmortem neuropathological verification and quantitation. In about 20 % of autopsies, a previous purely clinical diagnosis of AD could be falsified. In autopsy series a mixed pathology of Aβ-amyloid and α-synuclein was rather the rule (50–80 %) in the continuum of DLB-PDD, while mixed pathology was rather the exception in frontotemporal lobe dementia (FTLD) where isolated tau was found in about 40 % (FTLD-tau) and isolated TDP-43 in about 60 % of cases (FTLD-U). Isolated α-synuclein pathology was detected in multisystem atrophy (MSA) [77].
20.8.1 Generations of Amyloid Tracers
At the beginning, a series of studies used the first-generation marker of cerebral protein deposits [18F]FDDNP which is not specific and recognizes Aβ and tau [78]. A breakthrough was achieved with the introduction of the 2-phenylbenzothiazole and thioflavin-T derivative [11C]PiB. This compound is virtually Aβ-selective. Unspecific white matter uptake is comparatively low. A high discriminatory power is provided between amyloid carriers and noncarriers, as confirmed by biopsy or autopsy. Still [11C]PiB is the amyloid tracer with the most measurements reported in the literature. In the recent years, three “3rd-generation” [18F] Aβ-amyloid tracers obtained admission to the market after extensive phase I–III validation, including biopsy or autopsy confirmation. These are the 3′-[18F]fluoro-analogue of PiB, [18F]flutemetamol (GE067, GE Healthcare), and the stilbene [18F]florbetabene (Piramal) in the EU and USA and its pyridine analogue [18F]florbetapir (AV45, Amyvid, Eli Lilly) in the USA and UK. An example of [18F]florbetabene PET scans is given in Fig. 20.3. Unfortunately, the white matter uptake of all these three [18F]-tracers is higher than of [11C]PiB, and accordingly the discriminatory power is reduced [77]. A cohort of 10 controls and 10 AD patients received [11C]PiB and [18F]florbetabene subsequently, yielding differences of SUVR of 75 % and 56 % and Cohen’s d as a measure of diagnostic discriminatory power of 3.3 and 3.0, respectively [79]. [18F]NAV4694 (Navidea, formerly [18F]AZD4696) which is in advanced P-IIb and P-III development at the threshold to market admission displays considerable lower white matter uptake. [18F]NAV4694, as flutemetamol and PiB, is a heteroaromatic planar analogue of thioflavin-T [80].

Fig. 20.3
Exemplary PET scans of a 69-year-old AD patient symptomatic since 5 years and a healthy control person aged 22 years using the amyloid ligand [18F]florbetaben, acquired 90–110 min postinjection of 342 MBq and 253 MBq, respectively. Note the gray matter uptake equaling and partially exceeding white matter in AD while there is exclusive white matter uptake in the control
20.8.2 White Matter Uptake
As a consequence of unspecific white matter uptake, amyloid imaging is particularly sensitive to motion artifacts. Due to partial volume effects coming with limited spatial resolution, brain areas with high atrophy risk to be rated as unaffected. This is not the case for the hippocampus, which almost regularly displays little amyloid deposition and only in state IV in histopathological examinations [81]. For precise detection of very early and localized cortical amyloid deposits, an accurate coregistration of structural MRI and PET is warranted which may best be provided by simultaneous acquisition at hybrid scanners. A high challenge and still matter of debate is also the choice of a (white matter) reference region which is little subdued to longitudinal changes [82]. In healthy controls amyloid tracer uptake reflects white matter distribution with perfect congruency. To turn this shortage into a virtue, amyloid imaging has been proposed for white matter quantitation in MS [83].
20.8.3 Uptake Pattern of Amyloid Tracers
In a typical AD case, homogeneous confluent white and gray matter uptake of the amyloid tracer or even prevailing cortical uptake is observed especially in the precuneus, PCC, lateral parietal lobe, and lateral temporal lobe in nearly perfect congruency to glucose hypometabolism in [18F]FDG scans. Notwithstanding, also in the dorsolateral prefrontal cortex, strong amyloid signals are observed. The comparatively preserved rCMR Gluc there may be due to lower neuronal vulnerability or compensatory mechanisms such as upregulated cholinergic or dopaminergic signaling [77]. In most cases, visual inspection allows already identifying a positive measurement, but quantitative analysis could considerably improve accuracy [84]. Interpretation should regard APO-ε4 status. The of APO-ε4 genotype is associated with higher amyloid burden. In AD populations >50% are carriers of at least one e4 allel versus 30% and less in control populations.
20.8.4 Validation of Amyloid Tracers
The specificity of amyloid tracers has been validated in large autopsy/biopsy series. Correlations of amyloid load determined in vivo and ex vivo were almost perfect. In the validation European Medicines Agency (EMEA) subcohort of the [18F]flobetaben phase III study, a total of 74 brains were collected. Aβ was histopathologically detected in 47, all of which had a positive PET. Within the 27 Aβ-negative cases, only one had a false-positive PET [85, 86]. Resuming the sum of trials, sensitivity and specificity of [18F]flobetaben are indicated at 98 and 89 % [86].
Furthermore, large series assessed the accuracy of clinical diagnosis of AD based on examination and structural MRI/CT by neuropathological verification. For instance, of 34 patients initially presenting with amnestic MCI and later having converted to dementia, finally 10 (29 %) of cases had non-AD pathology [87].
20.8.5 Applications of Amyloid Tracers in Clinical Settings/Gray Cases
In cognitively normal elderly control populations, about 30 % of amyloid-positive scans were reported, in mild cognitive impairment 60 %, and in clinical AD 80–90 %. Equal numbers were reported from autopsy series [81].
Smaller investigatory studies shed light onto caveats and shortcomings in practical settings especially in front of non-Alzheimer and mixed pathology/gray cases. In a very recent trial, eight FTLD cases showed a [18F]florbetapir SUVR relative to cerebellar cortex of 1.20 in PCC versus 1.31 in 10 controls and 1.94 in 10 AD cases. One FTLD case homozygous for APOE-ε4 was positive; two AD cases and all controls were amyloid negative upon quantitative analysis. Visual inspection alone yielded high uncertainty; only two of the eight FTLD scans were unanimously rated negative by all four raters. All cases were defined clinically and underwent additional diagnostic [18F]FDG-PET; CSF data were not provided [84]. It should be kept in mind that FTLD clinically may manifest as behavioral variant or more rarely as semantic dementia (SD) involving a rather Wernicke-like aphasia with difficulties of object naming and knowing the meaning of single words. SD is mostly associated to TDP43. The genetic background of FTLD is heterogeneous; mutations of the progranulin (GRN), the C9orf72, the TARDP, or the valosin-containing protein (VCP) gene corresponding to subtypes A-D are detected in TDP43 pathology including the overlap with ALS. Also FUS pathology accounts for a continuum of FTLD and ALS. Tau pathology includes strict sense Pick’s disease (PiD, with round tau-positive Pick bodies) and the overlap of FTLD with corticobasal degeneration (CBD), PSP and parkinsonism linked to chromosome 17 due to mutations of the microtubule-associated protein tau (MAPT). FTLD-UPS (tau and TDP43-negative ubiquitinated inclusions due to mutations of the CHMP2B gene) and FTLD-ni (no inclusions) account for the smaller number of other FTLD cases [88]. Classical CSF markers tau and 181-phospho-tau are slightly increased and can be even decreased in FTLD irrespective of TDP43 or tau pathology. Aβ is normal in FTLD [88]. Other CSF parameters such as TDP43 in conjunction with [18F]FDG-PET and MRI are under development, e.g., in the prospective LOF cohort [89].
Atypical Alzheimer variants with more focal cortical dysfunction and almost regularly widespread amyloid detection comprise (i) primary progressive nonfluent aphasia, rather resembling a Broca phenotype with agrammatism and apraxia of speech but spared single word comprehension (this type is however grouped to FTLD by some authors and mostly associated to tau pathology [88]), (ii) logopenic progressive aphasia, resembling the conduction aphasia type with impaired single word repetition but spared spontaneous speech production with some phonologic errors, (iii) frontal variant of AD, and (iv) posterior cortical atrophy [10, 90].
In DLB defined clinically – and confirmed by the occurrence of a L-DOPA-sensitive parkinsonian syndrome in the follow-up or DAT imaging – positive amyloid scans were reported in 54 of 92 cases (59 %) coming from 8 studies in the years 2007 and 2012 [91]. Remarkably, also isolated striatal amyloid deposition was observed in DLB-PDD [92]. An equal amount of amyloid binding may not account for an equal contribution to the functional deficit in DLB versus AD, as in DLB-PDD rather diffuse plaques may prevail and in AD rather the more malignant neuritic plaques, which of course cannot be discriminated by imaging [92, 93].
In a cohort of 39 patients with Down syndrome, [18F]FBB PET was positive for amyloid depositions in 90 % aged over 50 years, in 53 % aged 45–49 years, and in 7 % aged 40–45 years [86].
Meanwhile a multitude of diagnostic possibilities came up in the field of dementia and Alzheimer’s disease. Ongoing prospective and registry studies and expert panels/study groups such as the “Amyloid Imaging Task Force of the Society of Nuclear Medicine and Molecular Imaging and the Alzheimer’s Association” (AITF) or Alzheimer’s Disease Neuroimaging Initiative (ADNI) aim to conduct studies and identify most appropriate algorithms for applying sequences of diagnostic tests in front of a given setting of clinical symptoms.
In pure clinical routine, the symptoms are in the foreground, and the question of discriminating AD from FTLD in a case of aphaso-agrapho-agnosic symptom in progressed state seems academic. Rather fruitful applications of amyloid diagnostics may be cases of comorbidity where the detection of amyloid pathology implies clinical consequences. In a person affected since decades by major depressive disorder and recent complaints of memory loss, discrimination of depressive pseudodementia from degenerative dementia and discontinuation of antidepressants with anticholinergic side effect plus addition of an AChE inhibitor may be in question. When DLB is suspected, an eventual presynaptic dopaminergic deficit is accessible to effective therapy and may be scanned first (e.g., [123I]ioflupan SPECT) before Aβ. In those cases, it is however the question whether to use CSF or PET diagnostics.
20.8.6 Amyloid PET and/or CSF-Aβ/ Tau
It is of key interest to define indications for performing amyloid PET instead of or in addition to CSF analytics in clinical routine. As of the state of today, it can be stated that CSF has the advantage of multi-analyte capability, able to detect also non-degenerative, e.g., inflammatory pathology, and manometry can be performed upon sampling. Amyloid PET thus may be applied in patients who refuse lumbar puncture or where interruption of antiaggregation/anticoagulation therapy seems risky. The figures of merit of CSF versus PET seem quite comparable: e.g., the ratio t-tau/Aβ1-42 could discriminate autopsy-confirmed cases of FTLD (n = 30) from AD (n = 19) with 90–100 % sensitivity and 82–96 % specificity [88] compared to 98 and 89 % reported for [18F]FBB (in autopsy 47 AD, 4 normal, 23 diverse other neurodegenerative pathology) [86].
20.8.7 Amyloid Diagnostics in Clinical Trials
In the settings of clinical studies, it is plausible that the combination of amyloid PET and CSF analytics yields higher sensitivity and specificity than any method alone. In the presymptomatic course preceding AD, PET may convert more early than CSF and define the asymptomatic at-risk state of AD. This may be especially the case when localized cortical deposits can be detected in perfectly coregistered PET/MRI hybrid datasets. Both CSF analytics and amyloid PET can separate AD from other pathology with high accuracy but can neither discriminate among other pathologies nor other pathologies from normal cases [88]. Therefore, a key interest of amyloid PET is to clean up FTLD cohorts from contaminations with CSF-negative cases of atypical AD pathology.
Conversely, in recent AD trials, 36 % (14/39) of APOE-ε4-negative subjects and even 7 % (7/115) of APOE-ε4 carriers initially clinically diagnosed as AD revealed to be amyloid negative [94]. Therefore, including only double PET and CSF-positive subjects obviously yields higher enriched cohorts. This may be of special interest, when amyloid-modifying drugs are studied (c.f. 4.2). Thus, amyloid PET is paramount as exclusion marker in FTLD studies and as inclusion marker in AD studies.
20.8.8 Longitudinal Change of Amyloid Tracer Versus [18F]FDG Uptake and Others
Occurrence and levels of biomarkers in AD likely follow a stereotype sequence or cascade as formulated by Jack [58]. Thereby, levels are saturable and follow a sigmoid kinetics which, meanwhile, has been empirically confirmed. Very early in the presymptomatic at-risk phase, Aβ1–42 CSF levels decrease, and amyloid PET tracer uptake (SUV) increases. As second step with ongoing neurodegeneration, t-tau and p-tau levels increase and [18F]FDG uptake decreases. Third morphological changes such as hippocampal atrophy occur, and lastly clinical symptoms – first amnestic than aphaso-apraxo-agnostic – arise (c.f. Fig. 20.4). Therefore, the rate of change observed in a given biomarker much depends on the clinicopathological stage.

Fig. 20.4
Biomarkers in AD each follow a saturation kinetics and occur in a stereotypic sequence or cascade. Hypothetic plot of the evolution of biomarkers over time scaled from zero equalling normal to 100 % meaning maximum pathological level and time zero denoting phenoconversion/clinical onset (adapted from Jack et al. [81]). It is an open question whether genetic risk factors such as APOE ε4 or familiar variants Alzheimer (APP, PS1, PS2) shift the course of all biomarkers in parallel toward younger age of onset or whether the delay from pathological amyloid markers to neurodegeneration (tau, FDG, MRI) is shortened. Aβ1-42 tau, CSF parameters, Amyl-PET amyloid PET, clinics HR clinical symptoms in subjects “high risk” with low compensatory capacity, clinics LR clinical course at “low risk” in subjects with high compensatory capacity
However, we guess it noteworthy to give an idea of some annual rates of change observed in pathological cohorts versus controls assembled in Table 20.1
Table 20.1
Annual rate of change for different AD PET markers
Radioligand | Region or index, parameter | n, state | APO-ε4 status + | Follow-up, years | % annual change | Reference |
|---|---|---|---|---|---|---|
[18F]FDG | PCC, temporal cortex, angular gyrusa | 104 Ctrl | <27 % | 0–3 | −0.9 | Lo et al. [95] |
203 MCI | <53 % | 0–3 | −2.3 | |||
97 AD | <66 % | 0–2 | −5.0 | |||
[18F]FDG | PCC, temporal, parietalb | 11 Ctrl | 18 % | 0–(2–4) | 0.6 | Ossenkoppele et al. [96] |
12 MCI | 67 % | 0–(2–4) | −1.4 | |||
8 AD | 75 % | 0–(2–4) | −3.5 | |||
[11C]PiB | PCC-SUVrb | 11 Ctrl | 18 % | 0–(2–4) | 0.7 | Ossenkoppele et al. [96], identical subjects |
12 MCI | 67 % | 0–(2–4) | 0.9 | |||
8 AD | 75 % | 0–(2–4) | −1.3 | |||
[11C]PiB | PCC-SUVr | 10 MCI | 4 + | 0–2 2–5 | 5.3 4.4 | Kemppainen et al. [97] |
6 AD, | All + | 0–2 2–5 | 4.7 3.3 | |||
[11C]PiB | GCA-SUVr | 40 AD | All + | 0–0.8 0–1.4 | 1.6 4.2 | Salloway et al. [94], Bapineuzumab |
15 AD | All − | 0–0.8 0–1.4 | 4.0 −2.4 | |||
[18F]florbetapir | Frontal, parietal, temporal ctx, cingulumc | 14 Ctrl. A− | All − | 0–2 | 0.2 | Landau et al. [82] |
37 Ctrl. A+ | 41 % | 0–2 | 1.8 | |||
54 eMCI | 63 % | 0–2 | 1.1 | |||
[18F]florbetapir | Composite | 20 mild AD | n.d. | 1.9 | −0.6 |
Across several studies, a longitudinal increase of amyloid tracer uptake – however with wide variability in annual rates of change – has been evidenced in MCI, while several studies found stable levels in AD [96, 100–103]. This variability may be due to different stages included in the respective cohorts.
20.9 PET as Inclusion/Progression Parameter in Clinical Trials
Principally in large trials, PET can serve for cross-sectional cohort characterization during inclusion or as a longitudinal progression marker readout and secondary endpoint. Some ongoing AD studies defined amyloid PET as obligatory inclusion parameter (c.f. 2).
20.9.1 Longitudinal (Phases IIb and III) Drug Studies: Outcome Parameter
Amyloid imaging was used to monitor the effect of therapeutic anti-amyloid antibodies. In a phase III study, 2452 patients stratified for APO-ε4 received bapineuzumab or placebo. In subgroups (115 carriers and 39 noncarriers), [11C]PiB PET were obtained at baseline and at week 45 and week 71. Amyloid levels clearly rose over time under placebo and stayed constant under verum in APO-ε4 carriers. In noncarriers, this effect on imaging parameters could only be detected transitorily at week 45. In contrast, clinical benefit was only observed at the disability assessment in dementia (DAD) scale in the mildly affected subgroup (MMSE >20) of noncarriers [94]. As this study was conducted from 2007 to 2012, amyloid PET was not yet a criterion of eligibility, and 13 of the 39 noncarriers were amyloid negative at baseline.
Before and after 1½ years of solanezumab or placebo in a total of 2052 patients, 266 patients received a [18F]florbetapir scan without yielding any significant change vs. placebo. In the entire study population, 59 % were APO-ε4 carriers, while this number was not given for the PET subsample. Details about the PET data are not reported yet [104].
It is highly interesting to see forthcoming refined analyses of these phase III data especially differentiating patients with amyloid-negative versus amyloid-positive scan at baseline and converters versus nonconverters. The spectrum of clinical response may be plotted as a function of baseline amyloid load and of baseline cognitive scores.
In the REAL-PET study, [18F]F-DOPA PET was the key measurement to detect an eventual neuroprotective effect of the D-agonist ropinirole versus L-DOPA [105]; of 162 patients, at least 2 PET within 2 years of follow-up were available, and putaminal [18F]F-DOPA uptake decreased less, by 13 % under ropinirole versus 20 % under L-DOPA. An analysis by voxel-wise statistics revealed also significantly less decline in the substantia nigra. Whether these findings really reflect a higher density and inventory of dopaminergic branches and terminals or are due to less downregulation of DAT under more constant dopaminergic tonus is however questionable [105]; see also 1.2.6.
20.9.2 Studying Effects of Medical Devices/Various Therapeutic Interventions
20.9.2.1 Deep Brain Stimulation
The metabolic effects of deep brain stimulation (DBS) for various indications at various sites have been studied using [18F]FDG. Here acute and chronic effects in the neighborhood of active electrode contacts and at distance have to be discriminated. The best established application, the inhibitory 180 Hz stimulation of the nucleus subthalamicus (STN), in PD has the disadvantage that the intensive [18F]FDG uptake in the thalamus outshines the tiny subjacent STN. A series of novel targets are recently on the way of being established for indications such as refractory depression, obesity, Alzheimer’s disease, heroin addiction, Tourette syndrome, etc. Here mostly an about 30 Hz stimulation with stimulatory effect onto the surrounding is chosen. Indeed, PET findings actually seem to confirm a net stimulatory effect on the cube centimeters around the active contacts and also in distant cortical areas and basal ganglia [106, 107]. As psychiatric parameters do not respond as quickly as Parkinson symptoms to changes of stimulation parameters and are influenced by a series of confounders, the potential of PET in optimization of targets and of parameter selection – once an electrode is implanted – is promising.
20.9.2.2 Convulsive Therapy
A large series of metabolic and perfusion studies assessed the response to convulsive therapy for refractory depression mostly in the postictal and in one seminal study also in the ictal phase [108]. It could be demonstrated that the ictal territory after conventional electrode position, dimension, and polarization involved large fronto-parieto-temporal areas. In the immediate postictal phase, there was global cortical depression, while later (than 1 week) frontal metabolism recovered, exceeding the baseline and reaching control levels. The same behavior was observed after seizures induced inductively (termed “magnetic seizure therapy”) in the vertex region [109].
20.10 Drug Development: Dose Finding by Occupation/Displacement
20.10.1 P-II Studies of Successful Candidates
The partial D2– and 5-HT2A antagonist and partial 5-HT1A agonist aripiprazole introduced in 2002 has become a blockbuster among antipsychotics. D2-receptor occupation at the daily doses 0.5, 1, 2, 10, and 30 mg had been studied using [11C]raclopride. At 1 mg, 54 % of striatal D2R were occupied, at 10 mg 85 %, and at 30 mg 89 %. Indeed, in most patients, 10 mg/day exert the full antipsychotic effect, and 20 or 30 mg/day contribute no additional effect [110].
The SERT inhibitor and 5-HT3A-antagonist vortioxetine (Lu AA21004) introduced in 2013 − with less affinity on some other 5-HTR – has been dosed at 2.5, 5, 10, 20, and 60 mg before measuring SERT occupancy with [11C]MADAM and [11C]DASB. Both tracers yielded similar saturation curves [111]. The K D calculated from human PET data was 16.7 nM corresponding to the oral dose of 8.5 mg [112]. Twenty milligrams yielded 90 % occupancy in [11C]DASB PET and 60 mg 70 and 93 % in [11C]MADAM PET [111]. No significant occupancy of 5-HT1AR could be detected after 30 mg over 9 days using [11C]WAY100635 [112].
20.10.2 P-II Studies of Unsuccessful Candidates
Spending enormous effort in the clinical development of candidate compounds, which fail at the end brings some frustration. However, it is encouraging in the aftermath to have certainty that sufficient doses have been applied. So, a well-conducted initial PET dose-finding trial which yielded saturated receptor occupation after a single dose can help to avoid multiple useless subsequent studies at higher doses and eventually multiple dose applications. Some examples are the neuroleptic N-desmethylclozapine, ACP104 which had been studied using D2R-ligand PET [113] or the allosteric mGluR5 antagonist AZD2066. It was developed for neuropathic pain and depression and was studied at the doses 3.5 mg, 6.9 mg, and 13.5 mg using [11C]ABP688-PET. About 50 % occupation was observed after 6.9 mg and plasma K i calculated at 1.2 μM [114]. A similar dose-finding study was conducted for the allosteric antagonist AFQ056 developed for levodopa-induced dyskinesias [115]. The mGluR5 negative allosteric modulator STX107 is being studied with [11C]FPEB and [11C]SP203 (NCT01896843).
Related posts:

Stay updated, free articles. Join our Telegram channel

Full access? Get Clinical Tree


