Phakomatoses


Phakomatoses


Teresa Chapman, MD


INTRODUCTION

The skin and the central and peripheral nervous systems all arise from the ectoderm, and therefore numerous diseases involve these systems.1,2 Neurologic disorders such as stroke, vascular malformations, tumors, and epilepsy may be associated with specific ocular and cutaneous manifestations that enable the diagnosis. In this chapter, we discuss the manifestations of three important pediatric neurocutaneous disorders called phakomatoses, based on the Greek terms phakos, which means lens, and oma, which means tumor—Sturge-Weber syndrome, tuberous sclerosis complex, and neurofibromatosis. We will focus on the diagnostic imaging of their central nervous system (CNS) findings.


STURGE-WEBER SYNDROME

Sturge-Weber syndrome (SWS) is also known as encephalotrigeminal angiomatosis. This rare congenital nonfamilial syndrome is characterized by three abnormalities: (1) a facial cutaneous capillary angioma (port-wine stain) that is usually unilateral and involves at least the forehead, (2) glaucoma, and (3) cerebral leptomeningeal venous malformation, or pial angiomatosis, resulting in abnormal cortical and white matter venous drainage, venous stasis, and chronic hypoxia.3, 4 and 5 Of individuals with a facial angioma involving the V1 trigeminal branch distribution (the forehead), approximately 18% to 46% have Sturge-Weber syndrome.5, 6 and 7 The most commonly affected cerebral lobes are parietal and occipital.7, 8 and 9 Neurologic symptoms include seizure, hemiparesis, visual field deficits, and cognitive deficits. Interestingly, cognitive impairment may be disproportionate to the apparent extent of cerebral surface venous malformation.4 Although uncommon, spontaneous intracranial hemorrhage from venous obstruction has also been reported.10 Buphthalmos, or enlargement of the globe, may also be present on the ipsilateral side.11

In children with a congenital facial port-wine stain, or in individuals with visual impairments and ophthalmologic examination indicating glaucoma and/or retinal angiomas, further evaluation with brain imaging is indicated.4,6,7 Head CT imaging findings of SWS will be ipsilateral to the facial angioma and include gyriform calcifications and cerebral volume loss (Fig. 32.1).7,8 More detailed evaluation of the cerebral parenchyma and venous system is accomplished by MRI. Of importance, infratentorial findings are also frequently present, though subtle.12 T1-weighted postgadolinium contrast sequences have historically been the most reliable sequence for detection of the typical brain abnormalities seen in SWS. Advances in neuroimaging have propelled wider use of susceptibility-weighted imaging (SWI), which is sensitive to changes in the ratio of deoxyhemoglobin to oxyhemoglobin. SWI offers the advantage of elucidating neurovascular abnormalities, hemorrhage, calcification, iron deposition, and changes of oxygenation levels induced by blood flow alterations.13,14

Findings typical of SWS include the following: (1) focal or regional cortical atrophy, (2) presence of transmedullary veins, (3) enlargement of periventricular veins, (4) enlargement of choroid plexus, (5) leptomeningeal abnormal signal or enhancement, (6) cortical gyriform abnormal signal or enhancement, and (7) abnormal signal or enhancement at gray-white matter junctions (Fig. 32.2).7, 8 and 9,11,12 In SWS cases, SWI complements conventional MR sequences by more readily showing enlarged transmedullary veins, connecting periventricular veins, and cortical gyriform abnormality.9 An additional finding reported in SWS is accelerated myelination in the affected cerebral hemisphere, thought to be due to chronic hypoxia.15 Severe hypometabolism is readily demonstrated by 18-FDG positron emission tomography (PET) (Fig. 32.3).3,4,8

Treatment of SWS is individualized depending on extent of disease and symptoms. The facial angioma can be treated with laser therapy, and glaucoma is treated medically.6 Seizures refractory to medical therapy may be approached with surgery.


FIG. 32.1 • Sturge-Weber syndrome (SWS) on head CT. Axial (A) and coronal (B) reformatted images from noncontrast head CT study performed on a 2-year-old female with SWS show asymmetric volume loss of the left cerebral hemisphere and gyriform increased attenuation (arrowheads), reflecting cortical mineralization. Coarse and linear subcortical and periventricular white matter calcifications are also present in the left frontal lobe (A).


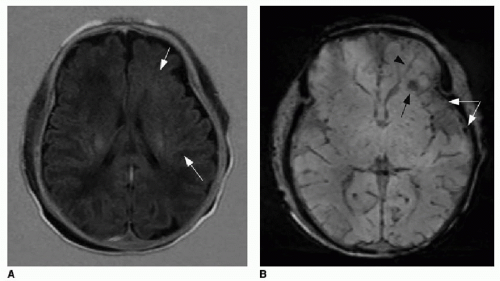
FIG. 32.2 • Examples of MRI findings seen in Sturge-Weber syndrome (SWS). A: Axial T1-weighted fluid-attenuation inversion recovery (FLAIR) image of a 1-day-old neonate already shows mild left cerebral volume loss and advanced myelination, evidenced by asymmetrically increased T1 hyperintensity in the left-sided white matter (arrows). B: Axial susceptibility-weighted image of the same neonate shows increased number of hypointense veins within the extra-axial space (white arrows), consistent with leptomeningeal angiomatosis. Linear dark signal through the left frontal lobe (black arrowhead) represents a transmedullary vein. Globular susceptibility artifact in the left frontal periventricular white matter (black arrow) represents calcification. 
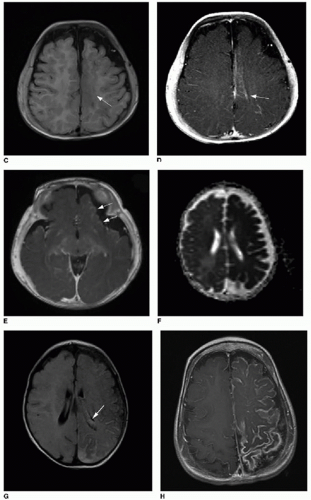
C: Axial T1-weighted image of the same patient imaged later at age 5 months shows area in the superior medial left frontal lobe with abnormal blurring of the gray-white matter junction (arrow). Postcontrast T1-weighted (D) images of superior left hemisphere and at level of inferior (E) left frontal lobe show abnormal cortical enhancement (arrows). F: Apparent diffusion coefficient (ADC) map reconstructed from diffusion-weighted imaging of different patient at 6 weeks of age, showing diffuse left cerebral hemisphere dark signal, indicating restricted diffusion and ischemia. 
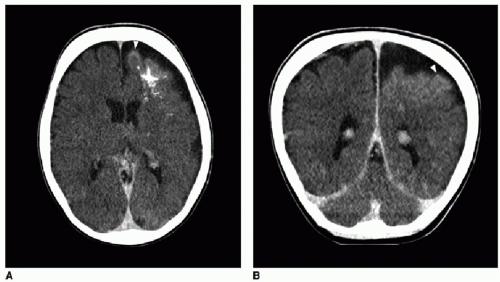
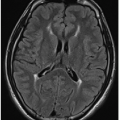
G: Axial T2-weighted FLAIR image of same study in a 6-week-old infant shows extensive left-sided subarachnoid hyperintense signal. Note also the asymmetrically larger left choroid plexus (arrow), typical of SWS. H: Axial T1-weighted postcontrast image of a 2-year-old patient (same patient as shown in Fig. 32.1) shows extensive, abnormal leptomeningeal and gyriform enhancement along the left cerebral hemisphere.


FIG. 32.2 • (Continued)


FIG. 32.3 • Hypometabolism of the cerebrum affected by Sturge-Weber syndrome (SWS) on 18-FDG positron emission tomography (PET). Axial PET images from study performed on a 3-year-old patient with SWS show decreased radiotracer uptake indicating hypometabolism in the left occipital (A) and parietal (B) lobes, which are most commonly involved by this disease. Note volume loss in the left cerebral hemisphere.


TUBEROUS SCLEROSIS COMPLEX

Tuberous sclerosis complex (TSC) is an uncommon genetic neurocutaneous disorder characterized classically by the clinical triad of seizures, cognitive delays, and adenoma sebaceum. However, only a fraction of affected individuals present with this triad-half of TSC patients have normal intelligence and approximately one quarter of patients do not have seizures.16 Multiple systems other than the skin and brain are potentially involved, with a variable spectrum of benign tumors, hamartomas, and cysts in the heart, kidney, lung, liver, bowel, and bone. The prevalence of TSC is estimated to be 1 in 6,000 to 12,000.16,17


Table 32.1 CLINICAL DIAGNOSTIC CRITERIA FOR TUBEROUS SCLEROSIS COMPLEX


Major Features


Minor Features


Hypomelanotic macules (≥3, at least 5 mm diameter)


“Confetti” skin lesions


Angiofibromas (≥3)


Dental enamel pits (≥2)


Ungual fibromas


Intraoral fibromas (≥2)


Shagreen patch


Retinal achromic patch


Multiple retinal hamartomas


Multiple renal cysts


Cortical dysplasias, including tubers and white matter radial migration lines


Nonrenal hamartomas


Subependymal nodules


Subependymal giant cell astrocytoma (SEGA)


Cardiac rhabdomyoma


Lymphangioleiomyomatosis (LAM)*


Angiomyolipomas (AMLs) (≥2)*


* *A combination of the two major clinical features (LAM and AMLs) without other features does not meet criteria for a definite diagnosis. “Definite” diagnosis requires two major features or one major feature with greater than two minor features. “Possible” diagnosis requires either one major feature or greater than or equal to two minor features.


From Northrup H, Krueger DA; International Tuberous Sclerosis Complex Consensus Group. Tuberous sclerosis complex diagnostic criteria update: recommendations of the 2012 International Tuberous Sclerosis Complex Consensus Conference. Pediatr Neurol. 2013;49(4):243-254.


TSC may be inherited in an autosomal dominant pattern or may be sporadic. The molecular basis of TSC has been attributed to genetic defects in one of two genes: TSC1 (encodes hamartin, on chromosome 9) and TSC2 (encodes tuberin, on chromosome 16). Hamartin stabilizes tuberin, and this protein complex inhibits downstream signaling pathways and effectively serves as a tumor suppressor mechanism.18,19 The diagnostic criteria for TSC are summarized in Table 32.1.20 Molecular testing of the TSC1 and TSC2 genes yields a positive mutation result for 75% to 90% of TSC-affected individuals with a “definite” diagnosis of the disorder.20


Intracranial findings include abnormalities of the cortex and white matter, as well as subependymal nodules and giant cell astrocytomas. Imaging by head CT is less sensitive than MR imaging for the detection of the parenchymal abnormalities, and brain MR imaging is more commonly used for diagnosis and for follow-up.21,22 All individuals with a new diagnosis of TSC or suspected TSC should have a brain MRI study as well as a baseline electroencephalogram.23

Cortical and subcortical tubers can be thought of as cerebral hamartomas. Histologically, these areas are characterized by disordered architecture of the normal cortical layering pattern, and dysmorphic neurons and glial cells.24 A greater burden of tubers is associated with a more significant degree of cognitive delays and TSC-associated neuropsychiatric disorders, such as autism and aggressive behaviors.23,

Only gold members can continue reading. Log In or Register to continue

Stay updated, free articles. Join our Telegram channel

May 24, 2016 | Posted by in PEDIATRIC IMAGING | Comments Off on Phakomatoses

Full access? Get Clinical Tree

Get Clinical Tree app for offline access