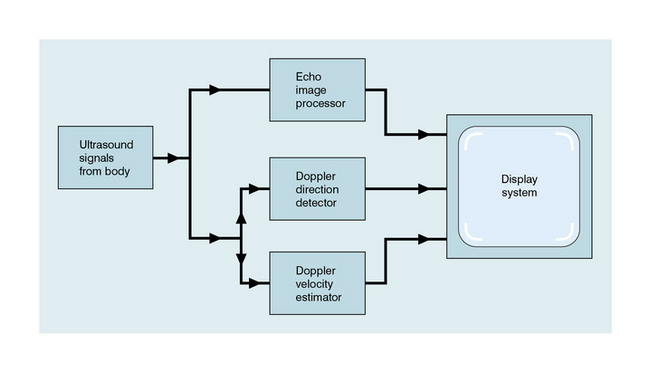
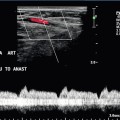
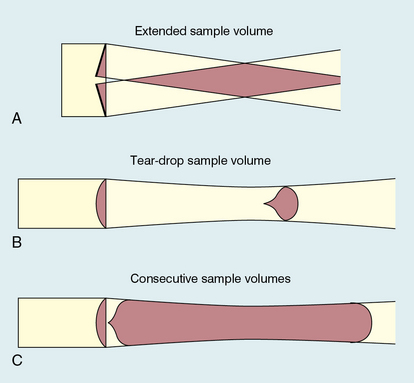
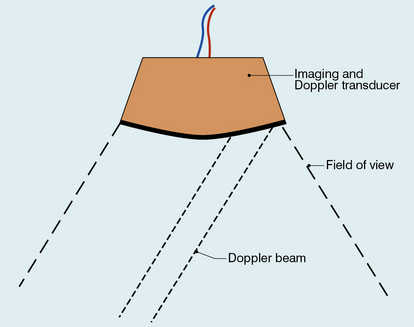
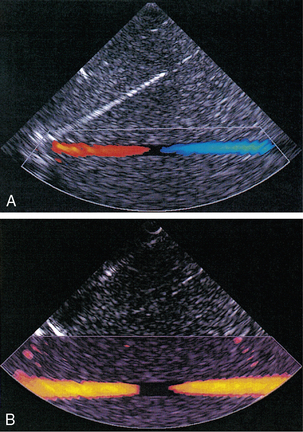
Chapter 1 A number of techniques have been developed which exploit the shift in frequency of ultrasound when it is reflected from moving blood. This frequency shift is known as the ‘Doppler effect’.1 Five types of diagnostic Doppler instrument are usually distinguished: 1. Continuous wave (CW) Doppler 4. Colour Doppler imaging (CDI; colour velocity imaging, colour flow imaging) The characteristics of an ultrasound beam, the propagation of ultrasound in tissue and the design of transducers as found in B-mode imaging are all relevant for Doppler techniques.2–6 For all waves such as sound or light the Doppler effect is a change in the observed frequency of the wave because of motion of the source or observer. This is due either to the source stretching or compressing the wave or the observer meeting the wave more quickly or slowly as a result of their motion. In basic medical usage of the Doppler effect, the source and observer (receiver) are a transmitting and a receiving element usually positioned next to each other in a hand-held transducer (Fig. 1-1A). A continuous cyclic electrical signal is applied to the transmitting element and therefore a corresponding CW ultrasound beam is generated. When the ultrasound is scattered or reflected at a moving structure within the body, it experiences a Doppler shift in its frequency and returns to the receiving (detecting) element. Reflected ultrasound is also detected from static surfaces within the body but it has not suffered a Doppler shift in frequency. After the reflected ultrasound is received, the Doppler instrument separates the signals from static and moving structures by exploiting their different frequency. FIGURE 1-1 Sample volumes in Doppler techniques. (A) For dual crystal continuous wave Doppler unit. (B) For pulsed wave Doppler unit. (C) Neighbouring sample volumes along a beam for imaging Doppler units. where ft is the transmitted frequency, fr is the received frequency, c is the speed of ultrasound and u.cosθ (i.e. u × cosineθ) is the component of the velocity of the reflecting agent along the ultrasonic beam direction. For a typical case of blood flow in a superficial vessel: Transmitted frequency, ft = 5 MHz = 5 × 10⁶ Hz Velocity of sound in soft tissue, c = 1540 m/s Velocity of blood movement, u = 30 cm/s Angle between ultrasonic beam and direction of flow, θ = 45° The Doppler shift is therefore: The shift in frequency is small and within the audible range. In an ultrasonic Doppler instrument, the electronics are designed to extract the difference in frequency, fD = ft – fr (the Doppler shift frequency). The instrument can therefore feed a signal of frequency fD to some output device such as a loudspeaker or frequency analyser. In the PW Doppler technique, the electrical excitation signal is applied to the transmitter element at regular intervals as pulses, each containing typically 10 cycles, and therefore a corresponding train of pulses of ultrasound are transmitted, separated by non-transmission intervals of duration around 20 times that of each pulse. Regularly spaced echoes are then received back from a reflector and they can be regarded as samples of the signal which would be received if a continuous wave had been transmitted. If the reflector is moving the system electronics can extract a Doppler shift signal from the samples. The Doppler equation again applies to this Doppler shift and can be used to calculate the speed of the reflector.7 The transmitted ultrasound field and the zone of maximum receiving sensitivity overlap for a particular range in front of the transducer (Fig. 1-1A). Any moving structure within this region of overlap will contribute a component frequency to the total Doppler signal. The shape of the region of overlap (the beam shape) can be considered as having a crude focus which depends on the field and zone shapes and on their angle of orientation to each other. In practice, the beam shapes are rarely well known for CW Doppler transducers. A 5 MHz blood flow instrument might be focused at a distance of 2 or 3 cm from the transducer and a 10 MHz device at a distance of 0.5–1 cm. CW Doppler instruments normally have ultrasonic output intensities (Ispta) of less than 10 mW cm−2 although they may be significantly higher when used in conjunction with duplex systems to measure high velocities. Since the ultrasound is pulsed and the excitation time is short, a stand-alone PW unit uses a single crystal transducer for transmission and reception (Fig. 1-1B). On setting the electronic gate to select a signal from a specific range, reflectors within a volume, known as the sample volume, contribute to the signal. The shape and size of the sample volume are determined by a number of factors: the transmitted pulse length, the beam width, the gated range length, and the characteristics of the electronics and transducer. The sample volume is often described as a tear drop in shape (Fig. 1-1B). Sample volume lengths are usually altered by changing the gated range length. In a blood flow unit for superficial vessels, the sample volume length may be as short as 1 mm, whereas in a transcranial device it can be 1 or 2 cm; however, the precise lengths are rarely known. A summary of technical factors relating to the use of continuous wave and pulsed wave Doppler instruments is given in Box 1-1. There are three types of imaging used with Doppler techniques. The first, known as ‘duplex Doppler’, uses a real-time B-scanner to locate the site at which blood flow is to be examined then a Doppler beam interrogates that site. The second type creates an image from Doppler information, i.e. an image of velocities in regions of blood flow.8 Known as ‘colour Doppler’, ‘colour flow imaging’ or ‘colour velocity imaging’, it is normally combined with a conventional real-time B-scan so that both tissue structure and areas of flow are displayed. The third type of Doppler imaging is similar to colour Doppler, but generates an image of the power of the Doppler signal from pixel locations throughout the field of view and is known as ‘power Doppler imaging’ (power Doppler).9 A power Doppler image depicts the amount of blood moving in each region, i.e. an image of the detected blood pool. Duplex systems link CW or PW Doppler features and real-time B-scanners so that the Doppler beam can interrogate specific locations in the B-scan image (Fig. 1-2). CW duplex is normally only used where very high velocities have to be measured without the aliasing artefact, for example in the estimation of the velocity of a jet through stenosed heart valves. The direction of the CW beam is shown as a line across the B-scan image. In the case of PW Doppler, markers on the beam line show the position of the sample volume. The Doppler beam is often directed across the field of view so that it does not intersect the blood flow at 90°. FIGURE 1-2 Duplex system combining real-time B-mode (- – – – ) and a Doppler beam (—-) of variable position across the B-mode field of view. A summary of technical factors relating the use of duplex Doppler instruments is given in Box 1-2. Pulsed Doppler techniques require between 50 and 100 ultrasonic pulses to be transmitted in each beam direction for the determination of velocities of blood in a sample volume. It is therefore not possible to move the beam rapidly through the scan plane to build up real-time Doppler images of velocity of flow. Such imaging became possible when signal processing was developed which could quickly produce a measure of mean blood velocity at each sample volume from a small number of ultrasonic echo pulses. A technique called ‘autocorrelation processing’ of the signals from blood quickly gives the mean velocity in each small sample volume along the beam (Fig. 1-1C). This real-time colour Doppler imaging processes between 2 and 16 echo signals from each sample volume. In addition, the direction of flow is obtained by examining the signals for the direction of the shift as for CW and PW Doppler devices. Each image pixel is then colour-coded for direction in relation to the transducer and mean Doppler shift (Fig. 1-3A). FIGURE 1-3 (A) Colour flow image of flow from left to right in a straight tube. When the flow velocity component is along the beam towards the transducer it is colour-coded red, when the component along the beam is away from the transducer it is coded blue. (B) Power Doppler image of flow in a straight tube. Direction of flow is not measured so it is not colour-coded. B-scanning and Doppler imaging are carried out with the common types of real-time transducer. Echo signals from the blood and tissues are processed along two signal paths in the system electronics (Fig. 1-4). Going along one path, the signals produce the real-time B-scan image; going along the other path, autocorrelation function processing and direction flow sensing are employed to give a colour flow image. An important exclusion circuit in the autocorrelation path separates large-amplitude signals which arise from tissue and excludes them from the blood velocity processing. The B-mode and mean velocity images are then superimposed in the final display. Strictly speaking, the flow image is of the mean Doppler shift frequency and not the mean velocity, since the beam–vessel angles throughout the field of view are not measured. Colour shades in the image can indicate the magnitude of the velocity, for example light red for high velocity and dark red for low velocity. Turbulence, related to the range of velocities in each sample volume, may be presented as a different colour or as a mosaic of colours. A summary of technical factors relating to the use of colour Doppler imaging is given in Box 1-3. The power of the Doppler signal from each small sample volume in the field of view may be displayed rather than the mean frequency shift (Fig. 1-3B). The power of the signal from each point relates to the number of moving blood cells in that sample volume. The power Doppler image may be considered to be an image of the blood pool. The power mode does not measure velocity or direction and therefore the image shows little angle dependence, nor does it suffer from aliasing; however, it obviously presents less information about blood flow. The attraction of power Doppler images is that they suffer less from noise than velocity images, as the power of the background noise for any sample volume with no blood flow signal is less than the power of the background noise plus Doppler signal when blood flow is present. The background noise may be used to set a threshold above which signals are accepted for Doppler flow. Noise from sample volume regions lacking blood flow is therefore reduced in the power image by a threshold detector. However, when the same signal is used in the velocity imaging mode, the noise will produce a mean velocity value which the machine will treat as a genuine blood velocity and which will therefore appear in the image. The power Doppler mode is therefore less prone to noise and hence more sensitive and can be used to detect small vessels. Further sensitivity can be obtained by averaging power images over several frames to reduce spuriously distributed noise even more. In velocity imaging there is interest in showing quick changes in blood flow and hence less averaging is used. A summary of technical factors relating to the use of power Doppler imaging is given in Box 1-4. A number of agents have been considered which can enhance the scattering of ultrasound from blood and hence could be employed as echo-enhancing or contrast agents. Ophir and Parker10
Physics
Principles, Practice and Artefacts
The Doppler Effect and Its Application
Continuous and Pulsed Wave Doppler Instruments
Imaging and Doppler
DUPLEX INSTRUMENTS
COLOUR DOPPLER IMAGING
POWER DOPPLER IMAGING
Ultrasonic Microbubble Contrast Agents
![]()
Stay updated, free articles. Join our Telegram channel

Full access? Get Clinical Tree


Radiology Key
Fastest Radiology Insight Engine