Fig. 4.1
A 64-year-old male with unresectable HCC. The segment II lesion (arrow) demonstrates hyperenhancement on the contrast-enhanced gradient echo MRI images before treatment (a). Immediately after administration of radioembolization particles, DynaCT shows distribution of therapy throughout the lesion (b). Follow-up MRI demonstrates loss of enhancement compatible with a complete response to therapy (c)
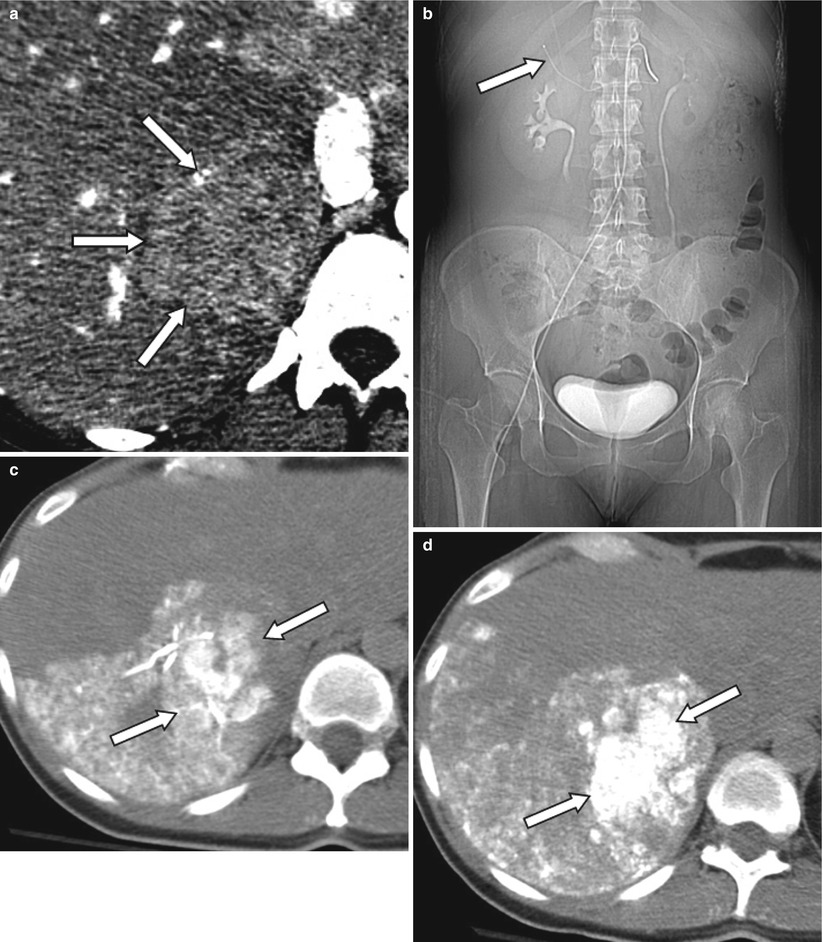
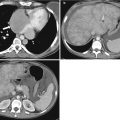
Fig. 4.2
A 48-year-old female patient with ocular melanoma metastasis to liver. Pre-treatment contrast enhanced CT demonstrates a large mass in the right lobe posterior segment of the liver (arrows) (a). Patient subsequently received TACE treatment (b–d) with superselective catheterization of the posterior branch of the right hepatic artery as seen on the scout CT image (arrow) (b). In order to assess ethiodized oil retention within the tumor, patient was evaluated with CT right after administration of ethiodized oil (c). Since there was insufficient treatment of tumor, additional chemoembolization material was administered, and sufficient therapy was confirmed with a second CT examination performed 2 h after the procedure (d)
Currently, there is no consensus in angiographic end points for transcatheter therapies. Stasis or substasis to antegrade flow on DSA evaluation is typically the goal of therapy with substasis postulated as being more efficacious as excessive embolization may be counterproductive and harmful for the patient [15]. Relatively newer techniques such as transcatheter intraarterial perfusion (TRIP) MR offer direct intraprocedure verification of therapy as well as an assessment of tumor perfusion after embolization to help guide therapeutic end points (Fig. 4.3) [15]. The ability to objectively quantify perfusion changes during therapy may serve as a functional imaging biomarker in the optimization of transcatheter therapies.
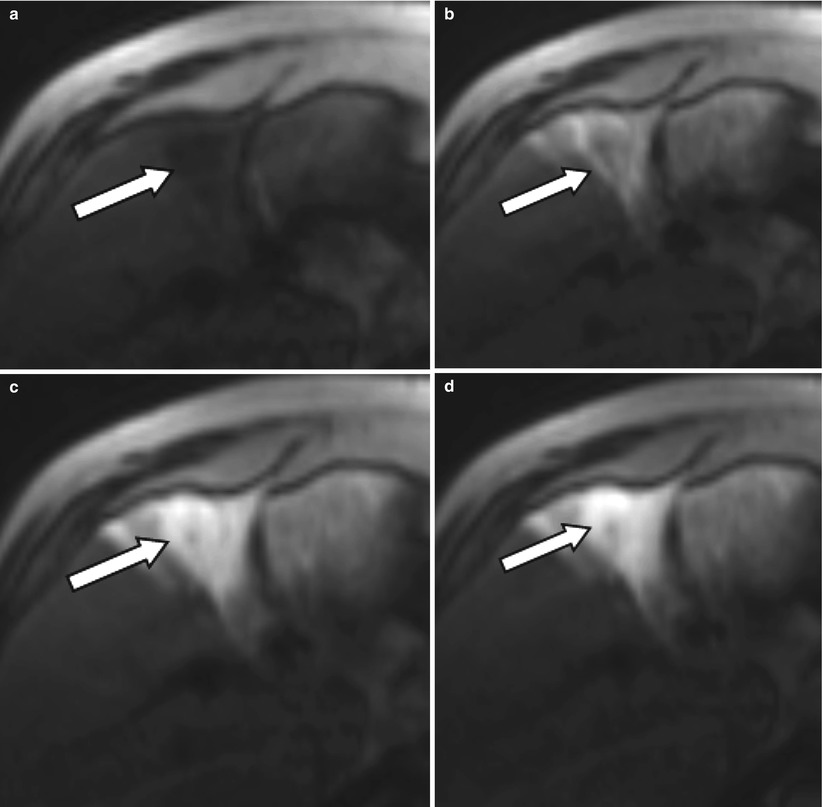
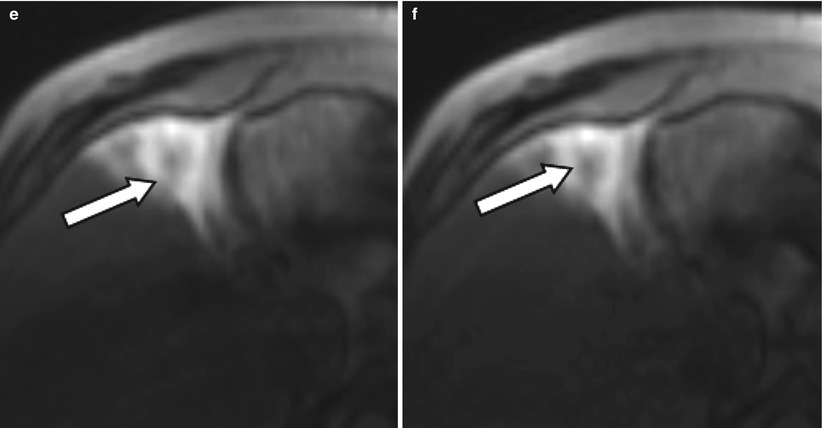
Fig. 4.3
A 54-year-old male patient with an HCC lesion involving segment 4b of the liver (arrow) for treatment with radioembolization. After selective catheterization of the right hepatic artery, patient was transferred to the MR suit to obtain TRIP MRI images before treatment. Serial dynamic MRI images were obtained by administration of contrast agent through intra-arterial catheter (a–f) confirming the therapeutic site
In the immediate post-LRT setting, for example, within 24 h after thermal ablation, a multiphase contrast-enhanced CT in the arterial, portal, and equilibrium phase may be performed to evaluate the effectiveness and extent of the therapy [12]. In centers utilizing contrast-enhanced US, evaluation of a well-delineated single tumor using this modality may be an option given the comfort and experience of the ultrasound operator [16].
With thermal ablation, a successful treatment is defined as a non-enhancing ablation zone encompassing the entire index tumor with ablative safety margins of at least 5 mm of the non-tumor hepatic parenchyma [17]. Safety margin should be evaluated in all three orthogonal planes. Evaluation of the safety margin can be performed by the image fusion of the pre- and post-thermal ablation CT [12]. As the zone of ablation may not be spherical due to causes such as a “heat sink” effect, evaluation can be challenging, and reliance on the multiplanar capabilities of reformatted CT images is essential in determining the safety margins of the entire ablative zone [18]. Although a safety margin of 5 mm is not always possible, the presence of unablated tumor within the ablative bed is clearly a technical failure, and additional treatment is required [12].
Nodular or thick enhancing areas along the margin of the treated zone are consistent with residual tumor in cases of hypervascular lesions, such as HCC or neuroendocrine metastasis [12]. In cases of hypovascular metastasis, evaluation can be difficult with low-attenuation nodular protrusions along the treatment margin being suspect for tumor recurrence [4]. In challenging cases, the FDG avidity of the tumor can be utilized to evaluate the tumor margin on PET imaging [4]. Alternatively, contrast-enhanced US may be beneficial with the advantage of immediate re-treatment [16]. However, in inconclusive cases short-term follow-up in 3 months or sooner may be necessary to assess the manifestation/progression of residual disease along the therapy margin.
Transient hyperemia manifested by a thin uniform enhancement of the ablation zone is an expected finding in the peri-ablative setting and although challenging should be differentiated from residual malignancy (Fig. 4.4) [5]. The hyperemia represents a transient physiologic response to thermal injury to the hepatic parenchyma [4]. Typically the transient enhancement resolves within 1 month on follow-up imaging but may last for several months [5]. However, a small amount of residual tumor may be obscured by the transient hyperemia, and careful evaluation of the ablative safety margin and close attention for persistent enhancement on short-term follow-up should be performed to determine whether further invasive treatment is needed [4].
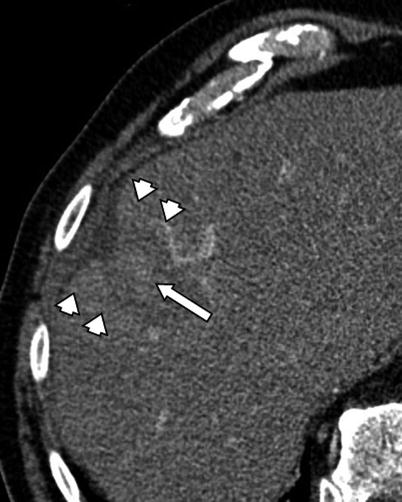
Fig. 4.4
A 74-year-old male patient with HCC. CT image 2 h after RFA procedure demonstrates central hyperdensity within the ablation cavity (arrow) consistent with hemorrhagic necrosis. Please note the enhancement of peri-ablative liver indicating transient hyperemia (arrowheads)
A central hyperdense area is often seen within the treated site in the location of the electrode and should not be confused for an area of persistent enhancement. The hyperdense area is felt to represent an area of coagulative necrosis and typically resolves on subsequent follow-up imaging (Fig. 4.4) [5]. This coagulative necrosis will result in hyperdense attenuation within the treated area on CT and hyperintense signal on T1-weighted MRI, limiting assessment of residual tumor enhancement when comparing unenhanced and contrast-enhanced images. Arterial-portal shunts can be seen after thermal injury to small vessels in the hepatic parenchyma with resolution on follow-up evaluation [19]. Additionally, tiny air bubbles that result from the boiling of tissue can be seen in the immediate post-procedure setting and typically resolve within 1 month follow-up (Fig. 4.5) [12]. The air bubbles should be distinguished from the mottled persistent air densities seen with a hepatic abscess or the arborizing air densities seen within a peripheral wedge-shape defect of a hepatic infarct [12].
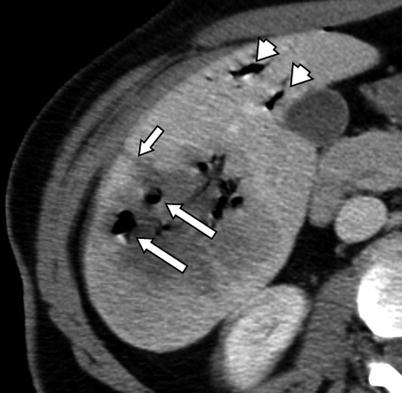
Fig. 4.5
A 42-year-old female patient with metastatic melanoma to the liver. Immediate post-procedure CT image after RFA demonstrates multiple air bubbles secondary to necrosis induced by RFA (large arrows). Note the needle tract extending from the ablation zone to the liver capsule (small arrow). There is also air in the biliary system secondary to the intervention (arrowheads)
Subsequent Follow-up Imaging Evaluation
In general, follow-up post-LRT evaluation is performed initially 3–4 weeks after treatment and then subsequently every 3–4 months with contrast-enhanced dynamic CT or MR imaging being the preferred modality [20]. Objective evaluation of the effectiveness of LRT can serve as a surrogate imaging marker for treatment response. Conventionally, oncologic imaging focused on anatomic biomarkers to assess tumor response to a therapy. The World Health Organization (WHO), incorporating bidimensional perpendicular measurements, and the Response Evaluation Criteria in Solid Tumors (RECIST), incorporating unidimensional measurements, guidelines were intended to evaluate change in tumor size and number for systemic treatments over months to years [21, 22]. The emphasis being on size with no regard to the extent or degree of necrosis produced, which is the primary goal of LRT. In fact, a treated lesion can increase in size secondary to intratumoral edema, hemorrhage, necrosis, or ablative margins [20]. For example, a non-enhancing RFA-treated tumor with a 5 mm safety margin will initially be larger than the index tumor and therefore by anatomic biomarkers alone would imply treatment failure (Fig. 4.6). Additionally, the guidelines assume tumors are spherical in shape, and thus high interobserver variability of 5–28 % has been noted in the measurement of ill-defined/irregular lesions [23]. Volumetric evaluation of the treated tumor eliminates this variability and when available offers the most comprehensive anatomic biomarker for determining treatment response [24].
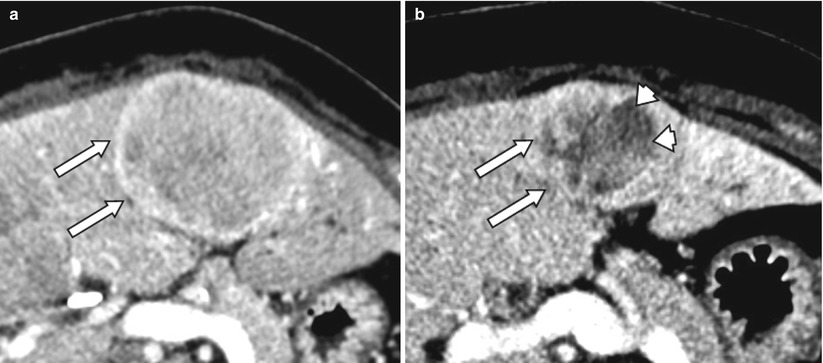
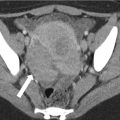
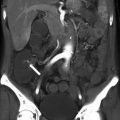
Fig. 4.6
A 52-year-old male with carcinoid metastases to liver (arrows, a). After treatment with radioembolization, the tumor has decreased in size. Also, the lesions shows central necrosis (arrowheads) consistent with partial response per mRECIST criteria (b)
Functional imaging biomarkers provide information on the viability, cellularity, vascularity, and metabolism of a tumor [25]. These biomarkers can detect response earlier than anatomic changes and are more applicable in assessing treatment response for LRT. The reduction in viable tumor volume is felt to be the optimal method in assessing local response to LRT [13]. The European Association for the Study of the Liver (EASL) criteria evaluate local treatment response by determining the degree of necrosis in two dimensions (Table 4.1), whereas the more recently introduced modified RECIST (mRECIST) evaluates the decrease in intratumoral arterial enhancement (Table 4.1) using the single largest diameter (Fig. 4.7) [26, 27]. However, these measurements are again only estimates of the tumor volume and are prone to interobserver measurement variability (Fig. 4.8). Volumetric quantification of necrosis has been found to be a more reproducible method of assessing necrosis compared to two-dimensional measurements [24]. Additionally, volumetric quantification is particularly helpful in cases where necrosis is heterogeneously distributed.
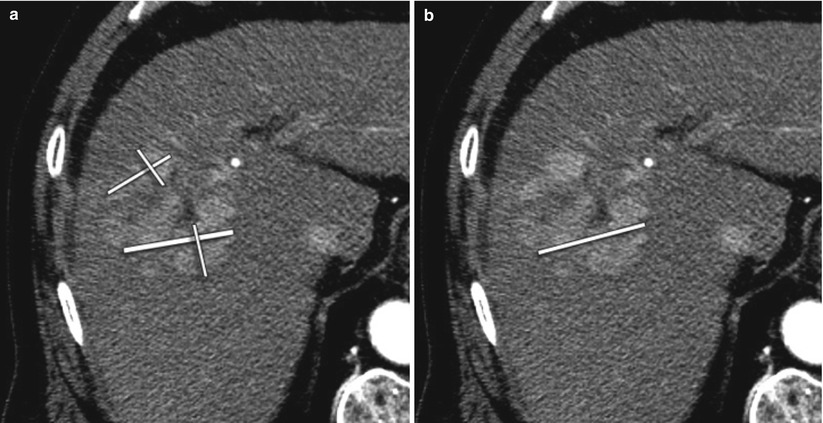
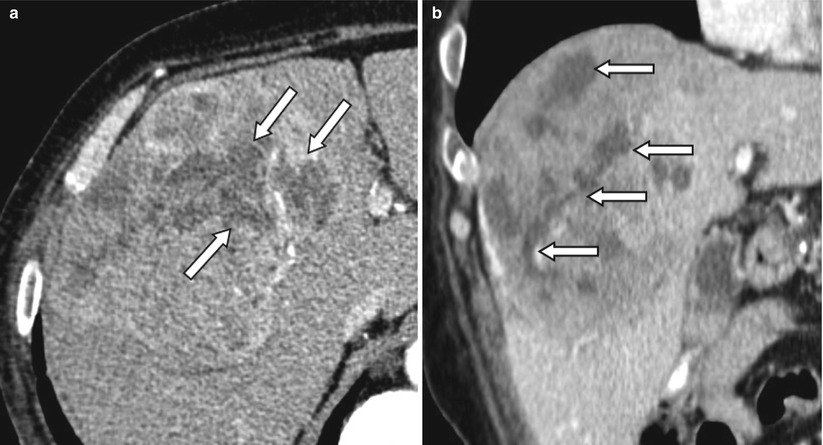
Fig. 4.7
A 64-year-old male with HCC treated with radioembolization. (a) EASL requires assessment of the sum of all viable tissue area using bidimensional measurements. (b) mRECIST requires measurement of the longest axial diameter of the enhancing tumoral tissue without comprising any necrotic tissue
Fig. 4.8
Contrast-enhanced CT of a 67-year-old male patient with HCC treated with radioembolization. (a) The percentage of necrosis after treatment on the axial slices can be measured differently depending on which level it was measured. (b) Coronal view shows the heterogeneous distribution of necrosis within the tumor. Arrows indicate necrotic portion of the tumor on the axial (a) and coronal (b) planes
Table 4.1
Comparison of EASL and mRECIST criteria
EASL | mRECIST | ||
|---|---|---|---|
Definition of target lesions | Previously untreatedlesions | NA | 1. The lesion can be classified as a RECIST measurable lesion (i.e., the lesion can be accurately measured in at least one dimension as 1 cm or more)
Related posts:Stay updated, free articles. Join our Telegram channel
Full access? Get Clinical Tree
 Get Clinical Tree app for offline access

|