Predicting Prognosis, Therapy Selection, Guidance, and Treatment Monitoring
Mark S. Shiroishi
Jesse G.A. Jones
Jalal B. Andre
Marco Essig
Pia C. Sundgren
Paul E. Kim
Meng Law
Conventional contrast-enhanced magnetic resonance imaging (MRI) is limited in its ability to depict the full extent of brain tumor biology. Focusing on the contrast-enhancing part of a tumor can be misleading because it underestimates tumor volume in high-grade gliomas (HGGs), and low-grade gliomas (LGGs) often do not significantly enhance.1 Several studies have shown that as many as 75% of anaplastic astrocytomas do not show contrast enhancement.2,3,4 The sensitivity for the grading of gliomas with conventional MRI is reported to range between 55.1% and 83.3%.5,6,7,8,9 The assessment of brain tumor vascularity is critical because of the close association between prognosis and angiogenesis.10 The addition of functional imaging techniques like perfusion MRI to complement conventional MRI can provide quantitative imaging biomarkers of tumor vascularity and angiogenesis. Although there is abundant documentation in the literature, particularly with T2*-weighted dynamic susceptibility contrast (DSC) MRI, demonstrating characterization of tumor microvasculature with perfusion MRI techniques, these techniques are predominantly performed in academic centers and are not yet used in routine clinical practice.
The main focus of most brain tumor perfusion MRI studies centers on evaluation of cerebral blood volume, flow, and permeability using a variety of techniques. The physical principles underlying these techniques are covered in detail elsewhere in this book, however, a brief overview of image acquisition and processing will be presented here as well as a discussion on the importance of technical standardization.
The Biology of Tumors
All tumor growth relies on angiogenesis to provide oxygen and nutrients to allow increased cell proliferation and metabolism and to discard waste products. Interestingly, tumors are unable to develop their own blood supply, and when malignant neoplasms are tiny, they mainly use substrate diffusion for survival.11 For a tumor to enlarge more than a few millimeters in size, angiogenesis is needed.12 Most perfusion MRI studies on brain tumors have focused on gliomas, and this will be the primary focus of this chapter.
Many pro-angiogenic factors are produced by glioblastomas, including vascular endothelial growth factor (VEGF), platelet-derived growth factor, basic fibroblast growth factor, and scatter factor/hepatic growth factor.13 The most studied of these is VEGF.14,15 There are several subtypes of VEGF, including VEGF-A, VEGF-B, VEGF-C, VEGF-D, and placental growth factor, however, only VEGF-A appears to be involved in tumor angiogenesis.16 VEGF also appear to function as a vascular permeability factor that is central to vasogenic edema production.17,18,19 The greatest expression of VEGF is seen in gliomas, where it is directly correlated to tumor grade.20,21,22 Malignant degeneration of an LGG into an HGG involves an angiogenic “switch” driven by overexpression of factors such as VEGF.23 The initial growth of gliomas occurs around existing vasculature, termed blood vessel cooption, and growth beyond this zone results in hypoxia and necrosis, with an increase in hypoxia inducible factor, which in turn stimulates the expression of VEGF.24
Perfusion Magnetic Resonance Imaging Techniques
The major methods to assess brain tumor perfusion with MRI are T2*-weighted DSC), T1-weighted dynamic contrast enhanced, and arterial spin labeling (ASL) MRI. Although the technical principles underlying these techniques are covered in detail in other chapters in this book, a brief overview will be provided here (Table 58.1).
TABLE 58.1 SUMMARY of MAJOR PERFUSION MAGNETIC RESONANCE IMAGING METHODS IN NEURO-ONCOLOGY | ||||||||||||||||
|---|---|---|---|---|---|---|---|---|---|---|---|---|---|---|---|---|
| ||||||||||||||||
T2*-Weighted Dynamic Susceptibility Contrast Magnetic Resonance Imaging
T2*-weighted DSC MRI, also referred to as bolus-tracking MRI, is the most commonly used method to assess perfusion in brain tumors with MRI (see Chapters 11 to 14 and 24 to 28 and 32). The relative cerebral blood volume (rCBV) calculated with this technique is the most robust and widely used metric obtained from DSC MRI.25 Relative, rather than absolute values of CBV, are usually derived because of the technical difficulties involved with derivation of the arterial input function (AIF). The rCBV is typically normalized to contralateral normal appearing white matter.25 In DSC MRI, rapid repeated imaging is performed that depicts reduction of signal intensity during the first-pass of bolus administration of an exogenous, nondiffusible, paramagnetic gadolinium-based contrast agent (GBCA). Within each voxel, a signal intensity time curve is generated, and in the absence of significant contrast agent leakage or recirculation, the transverse relaxivity on the spin echo (R2) or gradient echo (R2*) is expressed as:

where SIt is signal intensity at time t, SI0 is the baseline signal prior to contrast arrival, and TE denotes echo time. The ΔR2* is assumed to be linearly proportional to the contrast agent concentration, however, this relationship may not always be valid and could lead to errors in cerebral blood flow (CBF) and CBV determination.26,27,28,29 The area under the contrast agent concentration–time curve is proportional to CBV.30,31,32
DSC MRI most often uses single-shot echo-planar imaging (EPI) with multislice gradient echo (GRE) sequences to rapidly acquire images. Spin-echo (SE) EPI methods have also been used, however, GRE sequences provide a higher signal-to-noise ratio (SNR) than SE. Although GRE sequences appear to be sensitive to both capillaries and larger vessels, SE appears to be more sensitive to capillaries.33 In addition, there are fewer susceptibility artifacts associated with SE compared with GRE sequences. GRE techniques appear to have a better correlation with glioma grade compared with SE, likely because the angiogenesis of these tumors results in enlarged microvessels that do not resemble capillaries.34,35,36,37
T1-Weighted Dynamic Contrast Enhancement Magnetic Resonance Imaging
T1-weighted dynamic contrast enhancement (DCE) MRI, sometimes referred to as permeability MRI, also measures changes in tissue signal intensity over time following administration of a GBCA (see Chapters 23 and 29). Nevertheless, it usually employs more complex pharmacokinetic models (PKMs) than DSC MRI. In general, the T1 relaxation rate is measured before, during, and after the intravenous administration of a GBCA for several minutes by repeatedly imaging a region of interest using a T1-weighted GRE or spoiled gradient echo type. The latter is less sensitive to T2 effects that degrade the T1 signal intensity, but with inferior SNR compared with GRE. Nevertheless, improvement of SNR can be accomplished with the use of three-dimensional spoiled gradient echo or equivalent techniques.38 There are often conflicting demands on high temporal resolution, high spatial resolution, SNR, and anatomical coverage.39
Acquisition of T1-weighted DCE data usually involves the use of precontrast T1 mapping techniques and dynamic three-dimensional acquisition to obtain images that provide an estimated GBCA concentration at each location and time point. Then an estimate of the AIF and a PKM are incorporated to derive metrics, such as the volume transfer constant between the capillary plasma space and extravascular-extracellular space (EES), (Ktrans), initial area under the contrast agent concentration–time curve and the fractional volume of the extravascular-extracellular space (ve). PKMs, which also include the contribution of the intravascular tracer to the MR signal, will also provide estimates of the fractional plasma volume (vp). Note that Ve = ve·Vt, with Vt being the total tissue volume and Vp = vp·Vt.40
The changes of signal intensity with time will be converted into GBCA concentration–time curves. Unlike the case with computed tomography perfusion, the relationship between MR signal intensity and GBCA concentration is not always linear.41 Accurate determination of GBCA tissue concentration from T1 mapping can be facilitated by numerous techniques such as the variable flip angle approach, in which baseline precontrast T1-weighted images with multiple flip angles are acquired just prior to the DCE acquisition. Pathologic tissues enhance rapidly, and greater temporal resolution allows for more sophisticated PKM, which can determine physiologic markers such as Ktrans with superior specificity.42
Arterial Spin Labeling Magnetic Resonance Imaging
Rather than relying on an exogenous contrast agent, ASL is an MR perfusion technique that uses magnetically labeled arterial water protons as an endogenous tracer (see Chapters 15 to 22 and 30).27 It is capable of providing an estimate of absolute CBF, although for brain tumor evaluation, relative values appear to be sufficient because absolute CBF must be corrected for age- and patient-dependent mean perfusion.43 Absolute CBF can, however, allow comparison of values in a given individual patient throughout the course of treatment.
There are relatively fewer ASL MRI brain tumor perfusion studies compared with those for perfusion MRI
techniques that employ exogenous GBCAs. ASL does offer some advantages compared with DSC or DCE MRI. ASL can be considered completely noninvasive because it does not require the use of GBCAs. This would allow repeated measurements and also is notable given the recognition of nephrogenic systemic fibrosis (NSF) associated with GBCAs.44,45 For some pediatric patients, ASL would be advantageous where intravenous access might be difficult, although a contrast-enhanced MRI is generally desired in brain tumor patients.46 Also, because ASL uses a diffusible tracer, it appears to be relatively insensitive to permeability, a major obstacle in DSC CBF determination.47
techniques that employ exogenous GBCAs. ASL does offer some advantages compared with DSC or DCE MRI. ASL can be considered completely noninvasive because it does not require the use of GBCAs. This would allow repeated measurements and also is notable given the recognition of nephrogenic systemic fibrosis (NSF) associated with GBCAs.44,45 For some pediatric patients, ASL would be advantageous where intravenous access might be difficult, although a contrast-enhanced MRI is generally desired in brain tumor patients.46 Also, because ASL uses a diffusible tracer, it appears to be relatively insensitive to permeability, a major obstacle in DSC CBF determination.47
Some disadvantages of ASL include intrinsically low SNR, longer acquisition times, and overall technical complexity.46,48,49 Also, prolonged arterial transit times in severe ischemia can result in relaxation of the spin label and produce underestimation of CBF, particularly in white matter or regions of otherwise prolonged label arrival times.50
ASL typically uses a fast acquisition method like EPI or spiral imaging.46 Arterial blood water is magnetically “labeled” using a radiofrequency pulse. Because this label decays with T1 relaxation, only a small amount of ASL water accumulates in the brain.50 In order to allow flow of magnetically labeled blood water into the microvasculature and tissue, a postlabeling delay is necessary.51 Images where there is no magnetic labeling of arterial blood water but where magnetization transfer effects are accounted for, referred to as “control” images, are also obtained. Labeled acquisitions are subtracted from control experiments without magnetization to determine CBF in milliliters per 100 g per minute.50 A 0.5% to 1.5% signal difference is seen between inverted and control spins, so experiments must be repeated to improve this poor SNR.49
Perfusion Magnetic Resonance Imaging Clinical Applications
The inclusion of perfusion MRI sequences is routine in academic settings for evaluation of brain tumor patients. Information gained from these functional imaging techniques can be very helpful to diagnose brain tumors, predict prognosis, and evaluate therapeutic efficacy. There are many studies in the literature, usually from a single-institutional setting, regarding the usefulness in these capacities. Nevertheless, it is currently not possible to quote universal threshold values given the lack of standardization in acquisition, postprocessing, and interpretation methods. In fact, one will note quite a bit of variability in quoted values. Therefore, when a particular study is being examined for its applicability to a particular clinical scenario, it is important to carefully examine the imaging and data interpretation techniques to assess the study’s relevance to one’s institutional setting. In addition, it is advisable for a particular institution to develop its own cutoff values of various metrics until more widespread standardization and multicenter data become available. It is also important to be aware of the limitations of certain techniques, especially DSC MRI and rCBV, and the confounding effect of GBCA leakage as well as susceptibility artifact.
Although DSC MRI is undoubtedly the most common technique to measure brain tumor perfusion, it is still unclear which ultimate perfusion technique should be applied and at what time intervals.52 Some institutions obtain both DCE and DSC MRI data in a single acquisition. Nevertheless, concern stemming from NSF risk and increased GBCA dosage has resulted in some institutions, including the authors’, to split a 0.1 mmol/kg body weight GBCA dose among the two acquisitions.
Predicting Prognosis
The grading of gliomas is critical to determine prognosis and therapeutic management.25 The clinical management for LGGs may vary from conservative follow up to surgical resection, while HGGs will usually require surgery and adjuvant chemoradiation therapy.49 Most perfusion MRI studies in the literature have focused on prediction of tumor grade. In practice, most suspicious tumors are biopsied, and while histopathologic diagnosis remains the gold standard, these studies can potentially validate these microvascular biomarkers.53 Reliance on conventional contrast-enhanced MRI to predict glioma grade can be problematic because, although HGGs more commonly display contrast enhancement, it is not uncommon to be seen in LGGs as well.54 Brain tumor biopsies have traditionally relied on contrast-enhanced computed tomography or MRI.55,56 Nevertheless, because the most malignant part of a tumor might not enhance, up to 25% of tumors appear to be undergraded.1,57
Other limitations to histopathologic grading include a lack of consensus regarding multiple approaches in grading systems58,59,60,61 and relatively low reproducibility of interpretation.62 Incorporation of rCBV parametric maps has been used in some centers to improve biopsy targeting of the most malignant portions of a tumor (Fig. 58.1).33 Because metrics such as rCBV might be able to predict clinical outcome, microvascular imaging biomarkers could potentially serve as an adjunct to histopathologic grading of gliomas.63
Elevation of microvascular density, a histopathologic marker of malignancy, is directly related to rCBV.64 Multiple studies have demonstrated a strong correlation between glioma grade and rCBV (Figs. 58.2 and 58.3).9,54,65,66,67 It should be kept in mind, however, that glioma grading with rCBV should be limited to fibrillary astrocytomas, because other gliomas, especially oligodendrogliomas, could have elevated rCBV regardless of histologic grade.25
Oligodendrogliomas possess what has been called “chicken-wire” vasculature, delicate neoangiogenic vasculature that can result in even low-grade tumors demonstrating quite elevated rCBV, even comparable to that of glioblastoma.68 Another DSC MRI metric that is strongly correlated with rCBV and thought to reflect tumor vasculature is peak height, which is calculated as the maximum difference between the precontrast T2*-weighted signal intensity and the greatest drop in signal intensity during the first passage of contrast bolus through the investigated tissue.69 Barajas et al.64 demonstrated that recurrent glioblastoma multiforme (GBM) showed both increased rCBV and peak height compared with delayed radiation necrosis (DRN) using DSC MRI.
Oligodendrogliomas possess what has been called “chicken-wire” vasculature, delicate neoangiogenic vasculature that can result in even low-grade tumors demonstrating quite elevated rCBV, even comparable to that of glioblastoma.68 Another DSC MRI metric that is strongly correlated with rCBV and thought to reflect tumor vasculature is peak height, which is calculated as the maximum difference between the precontrast T2*-weighted signal intensity and the greatest drop in signal intensity during the first passage of contrast bolus through the investigated tissue.69 Barajas et al.64 demonstrated that recurrent glioblastoma multiforme (GBM) showed both increased rCBV and peak height compared with delayed radiation necrosis (DRN) using DSC MRI.
 FIGURE 58.1. Use of relative cerebral blood volume (rCBV) parametric maps for biopsy target guidance. (A) A minimally enhancing left frontal glioma in a 50-year-old man. (B) The rCBV color map from dynamic susceptibility contrast magnetic resonance imaging perfusion demonstrates focal increase in rCBV within the lesion (red arrow). This patient had a biopsy directed to that region, resulting in a diagnosis of glioblastoma. Biopsy of a region with lower rCBV may have resulted in a lower grade tumor, an effect of sampling error. (Reproduced by permission from Lacerda S, Law M. Magnetic resonance perfusion and permeability imaging in brain tumors. Neuroimaging Clin North Am. 2009; 19(4):527–557.) |
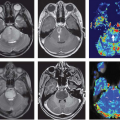
 FIGURE 58.2. High-grade glioma in a 73-year-old man. (A) Axial postcontrast T1-weighted image demonstrates a rim-enhancing right frontal mass with central necrosis. (B) Perfusion color map shows elevated relative cerebral blood volume within the lesion. (C) Ktrans color map displays increased permeability around the periphery of the lesion. |
 FIGURE 58.3. Low-grade glioma in a 53-year-old female. (A) Axial fluid-attenuated inversion recovery image demonstrates a hyperintense mass in the medial left temporal lobe. (B) Perfusion color map reveals no elevation of relative cerebral blood volume and (C) Ktrans compared with the contralateral white matter. |
Without including tumors with oligodendroglial components, Bisdas et al.70 found that astrocytomas with an rCBVmax greater than 4.2 was predictive of recurrence and rCBVmax of 3.8 or less was predictive of 1-year survival. These values appear to be higher than those reported previously by Lev et al.71 (1.5) and Law et al.72 (1.75). These differences could be a reflection in methodologic differences in these studies, including variations in image acquisition, derivation of rCBV values using regions of interest, and methods of assignment of threshold rCBV values. Lev et al.71 used am SE EPI and found that an rCBV less than 1.5 was predictive of prolonged survival for patients with astrocytomas. Law et al.72 examined 189 LGG and HGG patients and found that an rCBV threshold of 1.75 was able to predict median time to progression independent of histopathology (Fig. 58.4). Patients with high initial relative rCBV appeared to have more rapid progression than those with low rCBV. Using a standardized imaging and postprocessing protocol at two separate institutions, Caseiras et al.63 found that LGG patients with an adverse event exhibited a significantly higher baseline rCBV than those without. A longer time to progression was seen in patients with an rCBV less than 1.75 than those greater than 1.75, implying that LGGs with higher rCBV are more likely to behave like HGGs. Danchaivijitr et al.73 demonstrated an increase in rCBV up to 12 months prior to the appearance of contrast enhancement on conventional MRI in LGGs undergoing malignant transformation (Fig. 58.5).
 FIGURE 58.4. Kaplan-Meier survival curves for progression-free survival in the low-grade glioma (LGG) group with low relative cerebral blood volume (rCBV) (<1.75) and the LGG group with high relative CBV (>1.75), showing a significant difference in time to progression in LGGs stratified according to rCBV alone (P <0.0001). When high-grade gliomas (HGGs) were compared, there was a significant difference in progression in HGGs with high rCBV versus low rCBV (P <0.0001). Among subjects with low rCBV, there was a significant difference between HGGs and LGGs with respect to progression-free survival (P = 0.047). Among subjects with high rCBV, time to progression was not significantly different (P = 0.266) for LGGs and HGGs. (Reproduced by permission from Law M, Young RJ, Babb JS, et al. Gliomas: predicting time to progression or survival with cerebral blood volume measurements at dynamic susceptibility-weighted contrast-enhanced perfusion MR imaging. Radiology. 2008;247(2):490–498.)
Related posts:Stay updated, free articles. Join our Telegram channel
Full access? Get Clinical Tree
 Get Clinical Tree app for offline access

|