Chapter 21 Primary Adrenal Malignancy
Introduction
Adrenal masses are found in 2% to 9% of adults.1,2 The majority are either benign adenomas or metastases. The primary adrenal neoplasms, adrenal cortical carcinoma (ACC) and malignant pheochromocytoma, are relatively rare cancers discussed separately in this chapter. Both are usually diagnosed at advanced stages of disease when curative surgical resection is no longer possible and, because of this, have grim survival rates.
IAdrenal Cortical Carcinoma
Epidemiology and Risk Factors
ACC has an incidence of 0.5 to 2 per million of the population, with an annual incidence of 0.78 per million.3–6 The age distribution is bimodal, with the first peak in children before the age of 5 and a second peak in adults in the fifth to sixth decades. The mean age at diagnosis in adults is approximately 45.7 ACC is more common in female adults, with a ratio of 1.5:1, and is slightly more common on the left side.8 Bilateral tumors are uncommon.
Most cases of ACC are sporadic with no clear etiology. Smoking and oral contraceptives may be risk factors.9,10 ACC is associated with complex hereditary syndromes in some patients, including Li-Fraumeni’s syndrome, Carney’s complex, Beckwith-Weidmann syndrome, multiple endocrine neoplasia (MEN) type I, and Gardner’s syndrome. Sporadic cases are associated with mutations of the tumor suppressor gene p53.11
Anatomy and Pathology
Anatomy
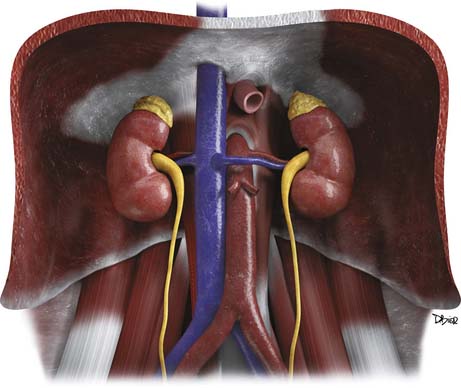
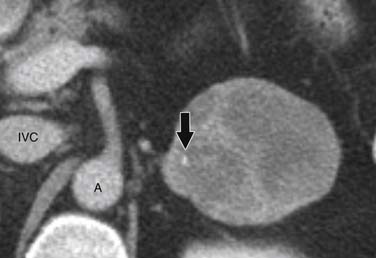
The adrenal glands are located in the retroperitoneum in the superior aspect of the perirenal space and are bounded by the perirenal fascia. The glands are composed of medial and lateral limbs that converge upon a central ridge. The right adrenal tends to have a pyramidal or inverted V shape, and the left is triangular with an inverted Y appearance. The right gland is usually the more superiorly located, lying just above the right kidney, posterior to the liver and inferior vena cava (IVC) and lateral to the right diaphragmatic crus. The left gland lies anteromedial to the superior pole of the left kidney, posterior to the pancreatic tail and splenic vessels, and lateral to the left diaphragmatic crus.12,13
Arterial supply to the glands is provided by superior, middle, and inferior adrenal arteries. There are usually six to eight superior branches, which are branches of the inferior phrenic arteries. The middle arteries arise from the aorta, and the inferior arteries arise from the renal arteries. The right adrenal vein usually drains directly into the IVC, but in 8% to 21% of people, it forms a common trunk with an accessory hepatic vein before draining into the IVC.14,15 The left adrenal vein drains into the left renal vein. Both glands have lymphatic drainage via the retrocrural, upper caval, and aortic lymph nodes.13
The adrenals have an outer cortex that accounts for 90% of the volume of the adult adrenal gland. The cortex is derived from the mesoderm and is part of the endocrine system, secreting androgens and the corticosteroids: cortisol and aldosterone (Figure 21-1). ACC arises from the cortex.
Pathology
On gross pathology, ACC is usually a bulky, coarsely lobulated, yellow to tan tumor with an average weight range of 510 to 1210 g.16,17 Areas of necrosis and hemorrhage cause a variegated appearance.
ACC is most commonly diagnosed histopathologically using the Weiss criteria. The nine criteria are (1) nuclear grades 3 to 4, (2) mitotic rate greater than 5 per 50 high-power fields, (3) atypical mitoses, (4) tumors with 25% or fewer clear cells, (5) diffuse architecture, (6) microscopic necrosis, (7) venous invasion, (8) sinusoidal invasion, and (9) capsular invasion. An adrenal mass is considered malignant if it is positive for three or more of these criteria.16
Pathologic features with prognostic significance for ACC include tumor size, the presence of intratumoral hemorrhage, and the number of mitotic figures. Primary tumors larger than 12 cm have a 5-year survival rate of 22% versus 53% for smaller tumors. Intratumoral hemorrhage is a negative prognostic factor compared with tumors without hemorrhage.18 Patients with a mitotic rate greater than 20 per 50 high-power fields have a median survival time of 14 months compared with 58 months for mitotic rates lower than 20.19
ACCs do not have pathognomonic immunohistochemical findings, although they frequently stain positive for vimentin and negative for cytokeratin.20
Clinical Presentation
The presenting symptoms of ACC depend on tumor size, the presence of metastases, and functional status. Functional tumors account for 50% to 79% of ACCs, and they can secrete cortisol, estrogens, androgens, or aldosterone. Tumors can also secrete a mixture of hormones, usually a combination of cortisol and aldosterone. Cortisol hypersecretion is the most common and presents as Cushing’s syndrome with weight gain, proximal muscle weakness, hyperglycemia, hypertension, and hypokalemia.21,22 Aldosterone hypersecretion causes hypertension and hypokalemia, but these symptoms are more commonly seen with cortisol excess. Virilization can be seen in women with androgen-secreting tumors, whereas men with estrogen-secreting tumors may develop symptoms of feminization.
Nonfunctional tumors can produce symptoms related to mass effect, including abdominal or back pain, early satiety, nausea, vomiting, and/or a palpable mass. They can also present with fever and weight loss. Nonfunctional tumors tend to present in older patients, with a male predominance.23,24 Nonfunctional masses can be discovered incidentally in patients who are undergoing imaging for other reasons. Finally, patients can present with symptoms related to metastatic disease.
Staging Classification
The TNM classification system is based on the primary tumor size and local invasion (T), regional lymph node involvement (N), and the presence or absence of metastatic disease (M).
Tumor-Node-Metastasis Staging of Adrenal Cortical Carcinoma
| T1 | Tumor ≤ 5 cm, no invasion |
| T2 | Tumor > 5 cm, no invasion |
| T3 | Tumor extends outside of adrenal gland into the surrounding fat |
| T4 | Tumor invades adjacent organs |
| N0 | No positive lymph nodes |
| N1 | Positive lymph node(s) |
| M0 | No distant metastases |
| M1 | Distant metastases |
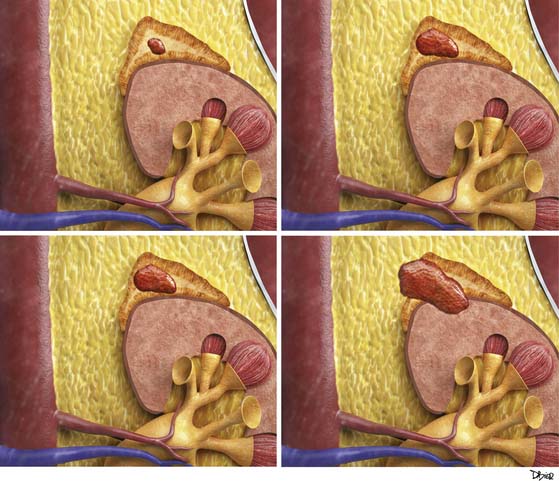
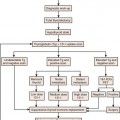
Stages I and II disease are localized to the adrenal gland. Stage III disease is locally invasive or has regional nodal metastasis. Stage IV disease is locally invasive with regional nodal involvement, invades adjacent organs, or is metastatic (Figure 21-2).
Staging of Adrenal Cortical Carcinoma
| Stage I | T1, N0, M0 |
| Stage II | T2, N0, M0 |
| Stage III | T1, N1, M0 |
| T2, N1, M0 | |
| T3, N0, M0 | |
| Stage IV | T3, N1, M0 |
| T4, N0-N1, M0 | |
| Any T, any N, M1 |
ACC has a grim survival rate, with a 5-year overall survival of only 32% to 48%. This is because approximately 70% of ACCs present at stages III and IV. Stages I and II disease have a 5-year survival rate of 62% compared with 7% for stage IV disease.25
Patterns of Tumor Spread
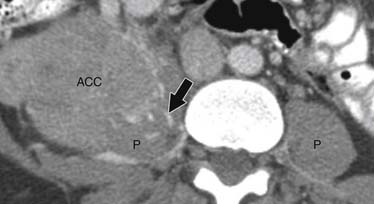
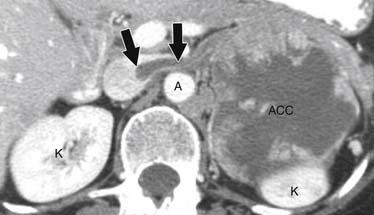
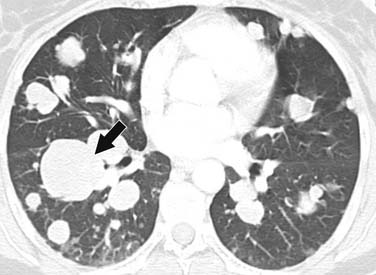
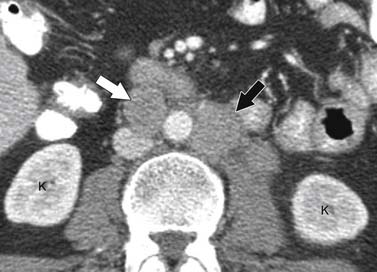
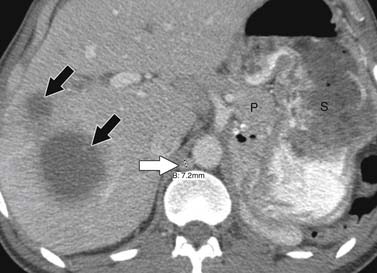
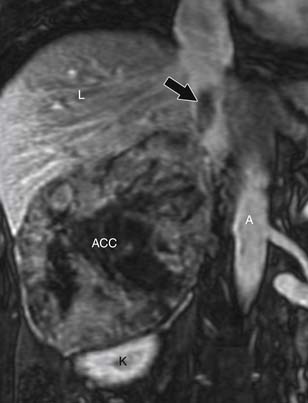
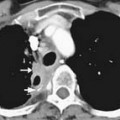
ACCs can spread by direct extension, first into the surrounding fat and then into adjacent structures such as the liver and kidneys (Figure 21-3). Tumor thrombus can involve the adrenal and renal veins and IVC (Figure 21-4). Metastases from hematogenous dissemination most commonly involve the bones, liver, and lungs (Figure 21-5).26 ACC also spreads through the lymphatic system to involve the retrocrural and upper caval and aortic nodes (Figure 21-6). Simultaneous hematogenous and lymphatic dissemination frequently occurs (Figure 21-7).
Imaging
Tumor
Computed Tomography
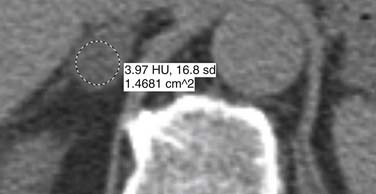
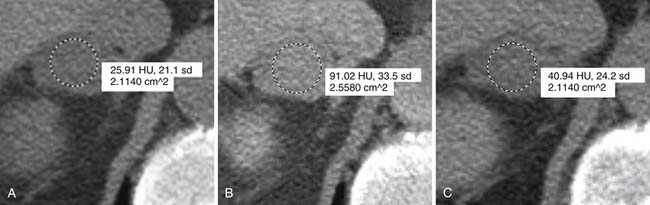
Malignant adrenal masses need to be differentiated from benign adenomas, which are the most common adrenal mass that can be found in up to 7% of the population, their incidence increasing with age.27 Adenomas are usually well circumscribed, homogeneous, round or oval soft tissue masses that have an average size of 2 to 2.5 cm.28 Most have abundant intracellular lipid causing them to measure less than 10 Hounsfield units (HUs) on unenhanced images (Figure 21-8).
However, up to a third of adenomas are lipid-poor and have higher attenuation on nonenhanced images, usually approximately 20 to 25 HU.28–30 These adenomas need further evaluation with a contrast-enhanced examination that takes advantage of adenoma’s rapid wash-out of contrast. Both lipid-rich and lipid-poor adenomas demonstrate this feature and should have greater than 60% absolute percentage wash-out or greater than 40% relative percentage wash-out on delayed images (Figures 21-9 and 21-10).30–32 A study by Caoili and coworkers30 found a sensitivity of 98% and specificity of 92% for characterizing adrenal masses as adenomas using a protocol that combined the Hounsfield units of unenhanced scans with delayed contrast-enhanced wash-out values.
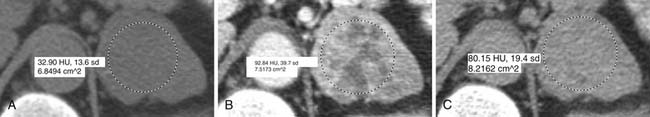
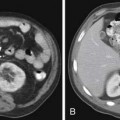
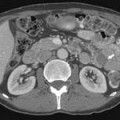
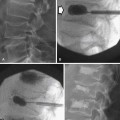
ACCs are typically large at presentation, with a mean diameter of 9.8 cm and a range of 4 to 25 cm.33 Smaller tumors can be well-defined homogeneous masses, but as they enlarge, they typically develop areas of necrosis that leads to a heterogeneous appearance on both pre- and postcontrast images (Figure 21-11). ACCs tend to enhance peripherally with ill-defined margins. Calcification can be present in up to a third and is usually central.34 Because most tumors present at an advanced stage, it is common to see local invasion of the surrounding fat and adjacent organs.
Magnetic Resonance Imaging
At our institution, phased array surface coils are used when possible for adrenal imaging because they offer improved visualization and a better signal-to-noise ratio than body coils. Breathhold gradient echo and fast spin echo sequences are used to minimize motion artifact.
Chemical shift imaging exploits the different proton resonance frequency rates in fat and water molecules to identify lipid-rich adenomas and is currently considered the most sensitive modality for distinguishing between benign and malignant adrenal masses, with a sensitivity of 79% to 100% and specificity of 82% to 100%.35–40 Sensitivity increases to 91% and specificity to 94% when chemical shift and dynamic gadolinium-enhanced imaging are combined.41
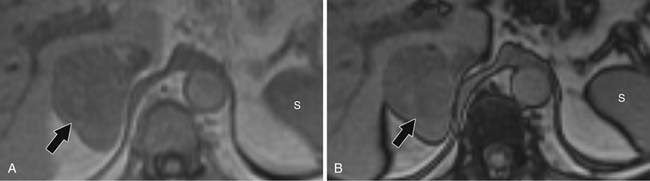
For chemical shift imaging, a dual-phase acquisition is performed, in which both in-phase (IP) and out-of-phase (OOP) images are acquired during a single breathhold. The adrenal mass signal intensity is analyzed visually against the splenic signal intensity. An adrenal adenoma will show greater signal loss than the spleen on the OOP sequence (Figure 21-12), whereas a malignant mass will not (Figure 21-13). The signal intensity percentage decrease can also be calculated, using the formula:
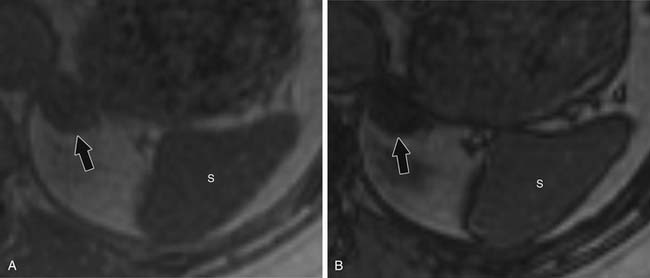
The percentage of decrease is proportional to the amount of lipid in the tissue.37,42,43 The spleen or kidney serves as a baseline comparison to normalize the value. Adenomas will have a decrease in signal intensity of more than 20%, whereas malignant masses will decrease less than 20%.36,38,42
Contrast-enhanced images are used for further characterization of the mass and to evaluate for vascular involvement and metastases. MRI is the best test for assessing venous involvement.44 It can accurately distinguish tumor thrombus from bland thrombus and detect venous wall invasion. MRI is also the most accurate test for delineating the superior extent of venous involvement (Figure 21-14).45,46
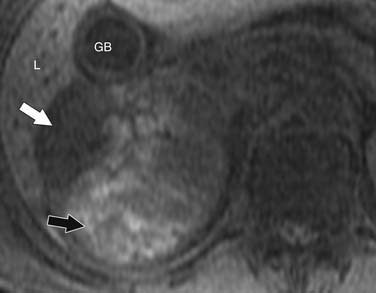
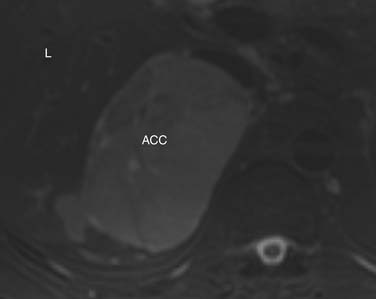
Findings that suggest a mass is an ACC are the same as they are in CT, including size greater than 4 cm, irregular margins, heterogeneous enhancement, and evidence of metastases, lymphadenopathy, or local invasion. ACCs are usually isointense to hypointense compared with the liver on T1-weighted images. Areas of hemorrhage will be hyperintense on T1 (Figure 21-15). On T2 weighted images, ACC is hyperintense relative to the liver (Figure 21-16), with areas of heterogeneity related to necrosis or hemorrhage.47 Occasionally, an ACC will contain foci of intracytoplasmic lipid, causing it to lose signal on OOP images, mimicking an adenoma.47
Ultrasound
Ultrasound is not typically used to evaluate adrenal masses. Although ultrasound has been shown to have a sensitivity of 96% in detecting adrenal masses, it is very operator-dependent and becomes less sensitive when evaluating obese patients or patients with little retroperitoneal fat.48,49
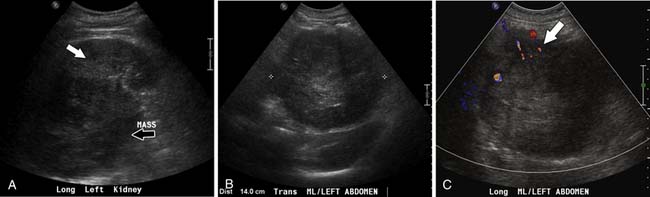
Both ACCs and pheochromocytomas tend to be larger and have a more heterogeneous echotexture than nonmalignant adrenal masses (Figure 21-17). However, there is significant overlap between the gray-scale and the duplex Doppler findings of malignant and nonmalignant lesions, and differentiation is not possible using these two parameters.
A recent study by Friedrich-Rust and colleagues49 found contrast enhanced sonography to have a sensitivity and specificity similar to those of CT and MRI in differentiating adenomas from nonadenomatous lesions, but this modality is not in widespread use in the United States.
Positron-Emission Tomography/Computed Tomography
Fluoro-2-deoxy-D-glucose (FDG)-PET/CT has a sensitivity of 93% to 100% and specificity of 90% to 96% for distinguishing malignant from benign adrenal masses.50–53 A study by Tenenbaum and associates54
Stay updated, free articles. Join our Telegram channel

Full access? Get Clinical Tree


