Principles of Angiography

CHAPTER 8


Principles of Angiography


Angiography is defined as “the x-ray visualization of the internal anatomy of the heart and blood vessels after the intravascular introduction of radiopaque contrast medium.”1 The contrast medium is introduced by an intravenous or intra-arterial injection or through a catheter that is inserted into a peripheral vessel and guided to the desired target area.


Before the discovery of x-rays, the injection of materials into the vessels of the body was performed primarily on cadavers. The procedure was limited to the injection of various vital dyes that stained the tissues of the body and facilitated the study of human anatomy after dissection. This practice was continued after Roentgen’s famous discovery and extended to the introduction of radiopaque materials that permitted physicians and anatomists to record the anatomy with x-rays. The use of this technique was not successfully applied to live subjects until about 1920, when a contrast agent was developed that could be safely introduced into the vascular system.


Improvements in radiographic and ancillary equipment and the development of safer contrast agents fostered research in angiographic procedures. Angiography became a safe, reliable diagnostic technique. The angiographic catheterization procedure provided a springboard for the use of angiography for therapeutic purposes.


HISTORICAL PERSPECTIVE


Angiography is a general term for the radiographic examination of the blood vessels. These studies are used to image pathologic and physiologic changes in visceral, cerebral, peripheral, and cardiac anatomy by injecting a contrast agent into specific portions of the vascular system.


In 1844, Claude Bernard performed catheterization of both the right and left ventricles of the heart of a horse. This first step enabled investigators to develop innovative techniques that were ultimately used in human subjects. Angiography had its beginnings in the late 1800s when investigators injected radiopaque materials into the vessels of corpses to outline the anatomy. These early contrast agents were highly toxic and could not be used in living subjects.


During 1918 through 1919, Walter Dandy, a neurosurgeon at The Johns Hopkins University, developed a procedure that used air to image the ventricular system of the brain of living humans. The technique was called pneumoencephalography. This development created an interest in the exploration of other substances that could be used to image anatomic structures not easily visualized with conventional radiography.


In early 1920, sodium iodide, a radiopaque substance, was found to be safe for use in living subjects. Egas Moniz and J. P. Caldas began performing cerebral angiography. They used sodium iodide as the contrast agent and the radiocarousel to image the vascular system of the brain. The radiocarousel, which was invented by Caldas, could image at the rate of one image per second for a maximum of 6 s. Simultaneously, B. Brooks was investigating the use of sodium iodide in imaging the femoral arteries. This marked the beginning of the era of angiography.


Werner Forssmann searched for a method of delivering medication directly to the location of need and is credited with performing the first human cardiac catheterization. In 1929, at the age of 25, he passed a 65-cm catheter through his left antecubital vein into his right atrium. He documented this achievement with a chest x-ray demonstrating the placement of the catheter. His research was used as a foundation by many investigators for the study of cardiovascular physiology.


Various changes were made in contrast agents, equipment, and methods between these first attempts at angiography and the early 1970s. During the 1940s, rapid sequence cassette changers were further developed, and image intensifiers, generators, and x-ray tubes were beginning to be developed. In the 1950s and 1960s, automatic injection devices were used to deliver the bolus of contrast agent to the desired location. Rapid sequence imaging devices were improved, and the Schonander cut film changer was introduced.


Catheters were being investigated for the introduction of the contrast agents directly to a desired location. H. A. Zimmerman reported a successful cardiac catheterization in a human. The method of choice in the early years of angiography for the introduction of the catheter was by direct approach. This involved making an incision, exposing the vessel of interest, and placing the catheter directly in its lumen.


In 1953, S. I. Seldinger described a method for the introduction of the catheter through the percutaneous replacement of the needle. This technique improved the safety of angiographic studies and simplified the procedure. In 1959, J. Ross Jr. and C. Cope described the transseptal catheterization procedure. Cope was also perfecting a method for selective coronary arteriography, and he experimented with a variety of catheter shapes to achieve this goal.


Serial magnification techniques and subtraction were introduced during this period, and the use of computer systems in connection with radiographic equipment was beginning to be investigated.


Through the 1980s, refinements in digital techniques advanced the basic subtraction principles and launched digital subtraction angiography as the modality most often used for cardiac catheterization. The development of computed tomography and magnetic resonance as imaging tools further reduced the use of angiography as the primary tool for diagnosis. Interventional procedures were perfected during this period, and angiography shifted from a purely diagnostic tool to an adjunct to the nonsurgical intervention in many disease processes. Interventional radiography has become the primary focus of vascular and cardiac therapy. The basic principles underlying diagnostic angiography still apply to interventional studies, and although the discussion of these principles may refer to diagnostic procedures, a transfer to interventional radiography is just a small leap away.


The evolution of faster computed tomography units, magnetic resonance angiography, and positron emission tomography has made possible noninvasive diagnosis in the heart and vascular system. However, invasive advanced procedures are still used for diagnosis and have provided the basis for the field of interventional radiology. Each year heralds new interventional procedures. This poses a challenge for both the radiologist and the radiographer. An increased knowledge of pharmacology, communication, and an ever-changing array of technical skills are required to safely and effectively perform these procedures. Interventional radiology has overshadowed diagnostic angiography and become a specialty field in its own right.


In January 2003 the American Registry of Radiologic Technologists (ARRT) introduced two postprimary advanced level examinations to replace its existing cardiovascular–interventional technology examination: vascular–interventional and cardiac–interventional technology examinations. (See www.ARRT.org for content specifications and additional information.) Although the diagnostic portion of the procedures plays an important part of the total patient care, the field of interventional (therapeutic) radiology is rapidly becoming the primary focus of the radiographer’s responsibilities in the advanced procedure field. The techniques learned and practiced in the diagnostic studies are critical to the understanding and practice of interventional procedures.


MONITORING TECHNIQUES


Physiologic Monitoring


During the procedure physiologic monitoring of the patient is essential. This involves the measurement of several factors, including blood pressure, renal output (if appropriate, heart rate and rhythm, respiration, and pharmacologic monitoring. The values and observations should be documented in the procedural notes, and the physician should be made aware of variations from the normal as they occur.


Pulse Oximetry (Oxygen Saturation)


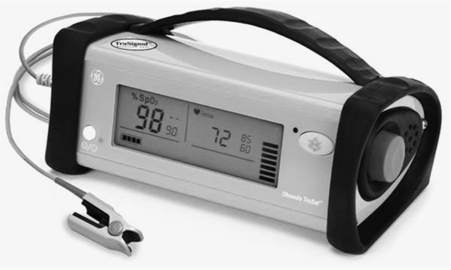
The amount of oxygen that is bound to the hemoglobin contained in the red blood cell can easily be monitored throughout the procedure. It is accomplished noninvasively by means of a pulse oximeter and provides real-time information regarding the oxygen saturation. The physiologic process is the binding of hemoglobin and oxygen to form oxyhemoglobin (HbO2). Pulse oximetry provides a measurement of the oxyhemoglobin saturation of the arterial capillaries (SaO2). The measurements are made by means of a sensor that is attached to the patient’s finger or toe. Figure 8-1 illustrates the TruSat pulse oximeter manufactured by Datex-Ohmeda. This system has a display range from 0% to 100% displayed on a highly visible backlit screen. It provides a measurement of the oxyhemoglobin saturation (SpO2) value and pulse rate. This unit is also equipped with both audio and visual alarms for SpO2 and pulse rate limits.


The most common type of sensor is the finger probe. It contains two light-emitting diodes (LEDs) and a silicone photodiode. The sensors transmit light through the capillary bed and receive the information on the opposite side.


When using this device it is important to follow the manufacturer’s instructions for correct alignment of the digit and the sensors. If this is not accomplished, the readings will not be accurate. It is also important that the location chosen be checked for adequate perfusion. If the circulation in the area is not sufficient, readings will also be inaccurate. A simple check can be performed by gently applying pressure on the area of interest by squeezing the distal end between the thumb and forefinger for several seconds. When the pressure is released there should be a rapid return of color to the digit. This is indicative of proper circulation. Other factors that can affect the readings are nail polish and excessive pigmentation. The readings should be documented throughout the procedure. The normal oxygen saturation range is between 90% and 100%.


BASIC PRINCIPLES OF ELECTROCARDIOGRAPHY


Electrical changes in the heart muscle taking place during systole can be led off from the surface of the body by electrodes to a recorder capable of producing an electrocardiogram (ECG) tracing. This tracing represents the pattern of electrical activity in the heart.


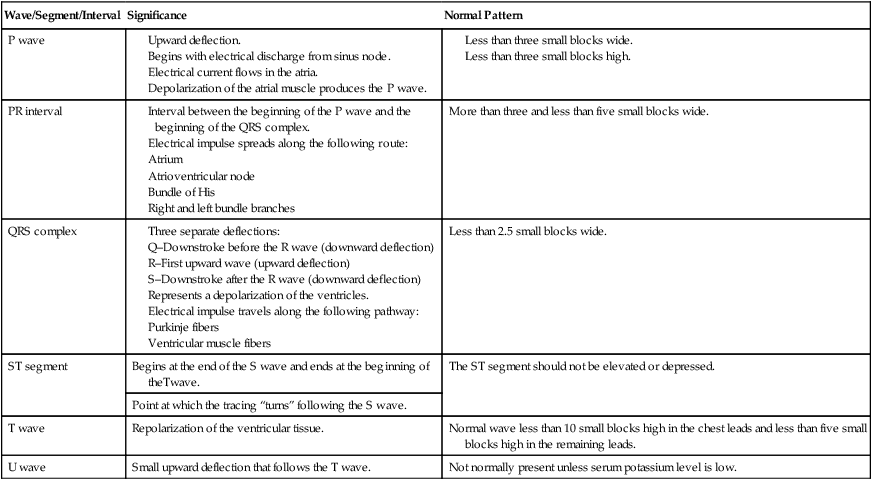
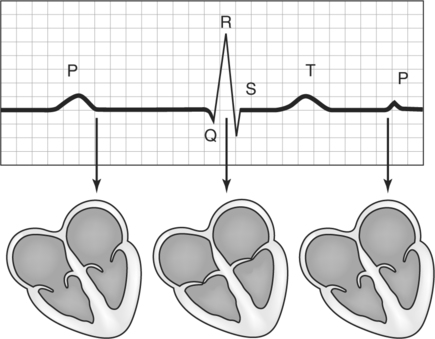
Standard locations on the body for these electrodes are the right and left arms, right arm and left leg, and left arm and left leg. Each segment of the ECG shows the electrical cycle of the heart (Fig. 8-2). The P wave initiates the cycle, and the excitation spreads from the sinoatrial node over the atrium to the atrioventricular node. Peaks Q, R, and S follow as the impulse spreads throughout the atrioventricular bundle of His over the ventricles. At this time, the heart is in ventricular systole. Finally, as ventricular excitation subsides, the T peak is recorded. The U wave is not usually attendant in the normal ECG; it is usually present when the serum potassium level is low and appears as a small upward wave.


A normal single heartbeat comprises five waves (P, Q, R, S, and T). The P wave occurs when the atria contract. The presence of the QRS complex indicates that the ventricles are undergoing contraction. The T wave is the electrical recovery from the ventricular contraction phase.


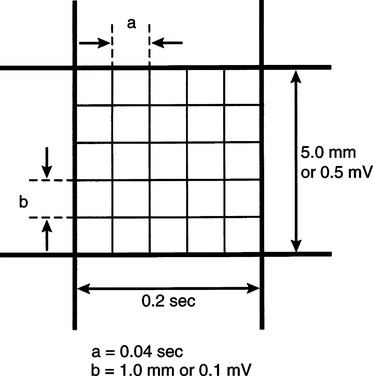
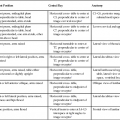
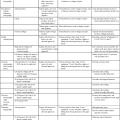
The small and large blocks on the ECG paper and tracing illustrate the interval in seconds (horizontal blocks) and the measurement of electrical activity in millimeters (vertical blocks) of the wave. Each of the small horizontal blocks represents 0.04 s on the horizontal line and 1 mm on the vertical line (Fig. 8-3). Because each of the large blocks comprises five horizontal and five vertical blocks, its value can be stated as 0.2 s (0.04 s × 5 = 0.2 s) horizontal and 5 mm (1 mm × 5 = 5 mm) vertical. The vertical height is correlated to the electrical activity. Five millimeters of height (one large block) is equal to 0.5 mV of electrical activity. Table 8-1 summarizes the normal ECG tracing and lists the wave, segment, or interval, the significant physiology, and how the normal pattern should be represented on the ECG paper.


Stay updated, free articles. Join our Telegram channel

Feb 27, 2016 | Posted by in GENERAL RADIOLOGY | Comments Off on Principles of Angiography

Full access? Get Clinical Tree

Get Clinical Tree app for offline access