Principles of Cancer Imaging with 18-F Fluorodeoxyglucose (FDG)
Richard L. Wahl
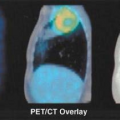
Anatomic imaging has been the fundamental approach to cancer imaging for more than 100 years. The continued utility of anatomic methods is supported by their daily use in managing individual patients with cancer in the third millennium, with estimates of over 20 million computed tomography (CT) scans for cancer performed annually in the United States. Currently, the most widely used systems for assessing response tumor response to therapy, World Health Organization (WHO) and Response Evaluation Criteria in Solid Tumors (RECIST), are anatomically based, reflecting the continued importance of anatomic imaging. Although widely applied, a major limitation of anatomic imaging is detection of a phenotypic alteration that is sometimes, but not invariably, associated with cancer—a mass. Although a mass may often represent cancer, with anatomic imaging, it cannot be distinguished if masses are due to malignant or benign etiologies, such as can occur in solitary pulmonary nodules or borderline-sized lymph nodes. Small cancers are often undetectable with traditional anatomic methods, as they have not yet formed a mass or the mass is so small it can be visualized, but is indistinguishable from normal tissues in its CT or magnetic resonance imaging (MRI) anatomic characteristics. After surgery or other treatments, it is even more difficult to assess for the presence or absence of recurrent tumor with anatomic methods. Posttreatment anatomic scans are complicated by dependence on comparisons with normal anatomy, often symmetries, to detect altered morphologic findings due to cancer. Anatomic methods do not predict response to treatment and do not quickly reveal those tumors responding to therapy (1,2,3). Delays in change in tumor size, despite substantial antitumor activity, have been seen with several targeted biological therapies, such as treatment of gastrointestinal stromal tumor with imatinib and other agents. Despite these challenges, anatomic images remain routine in cancer management. Positron emission tomography (PET), a functional imaging method, helps address many of the limitations of anatomic imaging, and when combined with anatomic images in fusion images, especially those generated with dedicated hardware PET/CT systems, is emerging as a particularly valuable—indeed now a standard—tool, providing both anatomic precision and functional information in a single image set (3) (Table 8.1.1).
Molecular and Functional Alterations in Cancer
The molecular etiologies of neoplasia are increasingly being understood. Mutations in genomic DNA typically precede development of overt neoplasia (4). These mutations can be both activating through oncogenes or mutations of tumor suppressor genes. With sufficient alterations in genotype, phenotypic changes occur (Table 8.1.2). These genotypic and phenotypic changes in cancer antedate development of discrete mass lesions and represent potential targets for innovative imaging agents.
The concept of an altered “genome,” “proteome,” and resulting alterations in metabolism are consistent with an altered “metabolosome” are increasingly recognized as present in cancers. Recently, alterations in methylation of genes have been described in DNA of malignant cells, causing silencing of key genes and contributing to the malignant phenotype. PET, due to its superb sensitivity to low concentrations of radioactivity, is able to detect signals from tracers targeting downstream phenotypic alterations preferentially present in cancer.
With a greater understanding of the causes of cancer, it is appreciated that there are many “hallmarks” of cancer, which are quite commonly seen across tumor types but include the following characteristics as reported by Hanahan and Weinberg (5): (a) self-sufficiency in growth signals; (b) evading apoptosis; (c) insensitivity
to antigrowth signals; (d) tissue invasion and metastasis; (e) limitless replicative potential; and (f) sustained angiogenesis. Although these are widely present, it is also true that many of the following characteristics are often present:
to antigrowth signals; (d) tissue invasion and metastasis; (e) limitless replicative potential; and (f) sustained angiogenesis. Although these are widely present, it is also true that many of the following characteristics are often present:
Table 8.1.1 Limitations of Anatomic Imaging Methods for Cancer Assessment | |
|---|---|
|
Increased rate of proliferation
Over- or underexpression of receptors/tumor antigens (e.g., somatostatin receptors)
Presence of hypoxia in regions of the tumor
Presence of necrosis
Increased metabolism of:
Glucose
Amino acids
Membrane precursors
Other substrates such as glutamine, DNA precursors
Accelerated rate of apoptosis
Each of these downstream phenotypic features represents a possible target for tumor imaging with PET tracers, and many of these processes have been targeted with PET tracers. Thus, the PET tracers in current and evolving use to a substantial extent target the tumor biological features that are reasonably common across cancer types. With a few exceptions, the characteristics of cancer that are biologically suitable targets for imaging are not totally specific for cancer. For example, the most commonly used target for tumor imaging at present, increased glucose metabolism, is not a tumor-specific process.
Table 8.1.2 Molecular and Functional Alteration in Cancer | |||||||||||||||||||||||||||||||||||||||||||||
|---|---|---|---|---|---|---|---|---|---|---|---|---|---|---|---|---|---|---|---|---|---|---|---|---|---|---|---|---|---|---|---|---|---|---|---|---|---|---|---|---|---|---|---|---|---|
|
There are also tumor-, or at least tissue-, specific targets on tumor cells. For example, the norepinephrine transporter (NET) is highly specific to neuroblastomas, pheochromocytomas, and neuroendocrine tumors, but the transporter is also expressed on normal tissues like the adrenal glands and brown fat. Similarly, estrogen receptors are very specific markers of a subtype of breast cancer, however, these receptors are clearly not specific for this cancer as they are expressed on many cells from the normal breast and uterus. Another quite specific tracer is the somatostatin receptor family, which can be targeted in certain neuroendocrine tumors like carcinoid, for example. Some of these more specific PET tracers are discussed in selected chapters, such as the chapter on neuroendocrine tumors, thyroid cancer imaging (e.g., iodine-124), hypoxia, and breast cancer. This section mainly focuses on the use of fluorine- 18-fluoro-2-deoxy-D-glucose ([18F]-FDG) in cancer imaging as it is by far the most commonly used agent at present in clinical PET, or as in vogue “clinical molecular imaging.”
Glucose Metabolism as a Target
Accelerated glucose metabolism has been known to be present in cancers for about 80 years (6). Increased glucose metabolism is not specific for cancer, however. Indeed, the dominant tracer used in clinical PET imaging to date, [18F]-FDG was developed as a tracer to study the initial steps of glucose metabolism in the brain (7). This tracer is transported into glucose-consuming cells, such as those in the brain or cancers, phosphorylated by hexokinase, typically type II, to FDG 6-phosphate, and then retained mainly as the polar molecule FDG 6-phosphate and can be imaged by PET (Fig. 8.1.1).
The development of FDG as a tumor imaging agent was not as rapid as its use in brain imaging. Although the Brookhaven group and others recognized and showed the promise of FDG for tumor targeting in animal models, this agent achieved only limited application to visceral imaging for many years following its introduction (8,9). As early as 1982, the feasibility of imaging brain tumors and colorectal cancer with PET was shown in humans (10,11). Several other reports of successful tumor imaging with FDG and either planar imaging or PET appeared in small clinical studies in the late 1980s (12,13,14). Pioneering studies of tumor imaging were also being performed in this time period by investigators in Japan using carbon-11 ([11C])-L-methionine (15). The tumor targeting properties of FDG were further developed in a series of animal studies performed in the late 1980s (16,17). In these studies, the targeting of FDG to a wide variety of human tumor xenografts was evaluated in nude mice and compared with the targeting ability of monoclonal antibodies, which were the more typical agents of that time. The author and his colleagues found that across a very wide range of human tumors, including breast, lung, renal, bladder, ovarian, testicular,
head and neck, and lymphoma and melanoma, the uptake of FDG was very much higher (in terms of tumor-to-background uptake ratios) than that which was seen with the higher molecular weight, and in theory, more “specific” monoclonal antibody tracers. Higher tumor/blood uptake ratios were commonly seen within a few hours of intravenous tracer injection. Similarly, targeting to tumor metastases in lymph nodes was very high in comparison to targeting seen with comparable monoclonal antibody agents. These preclinical data strongly suggested that tumor imaging of both primary and metastatic disease would be possible in man.
head and neck, and lymphoma and melanoma, the uptake of FDG was very much higher (in terms of tumor-to-background uptake ratios) than that which was seen with the higher molecular weight, and in theory, more “specific” monoclonal antibody tracers. Higher tumor/blood uptake ratios were commonly seen within a few hours of intravenous tracer injection. Similarly, targeting to tumor metastases in lymph nodes was very high in comparison to targeting seen with comparable monoclonal antibody agents. These preclinical data strongly suggested that tumor imaging of both primary and metastatic disease would be possible in man.
In brief, in nearly every circumstance in which animal models predicted that FDG would allow for successful imaging of tumors, the human studies showed the same: FDG targeted and imaged well breast cancer, bladder cancer, ovarian cancer, melanoma, lung cancer, germ cell tumors, many renal cancers, and many others (18,19,20,21,22,23). Many groups made similar observations in humans in a variety of cancers (24,25,26,27). It quickly became abundantly clear that FDG PET imaging would be a useful technique for cancer imaging, although the precise roles of PET in a variety of cancers continue to be refined to this day and the limitations of the technique are also increasingly recognized.
Understanding the Signal Seen with Fluorodeoxyglucose PET
Although superb images of many common kinds of cancer are feasible using FDG PET, it is important to understand the mechanisms of tracer uptake in cancers to fully understand the images and, more practically, the causes of false-positive and false-negative imaging results. In the past 15 years, improved understanding of some of the molecular alterations in glucose metabolism in cancer has been achieved. For example, overexpression of facilitative glucose transporters on the cell surface is common, with the GLUT1 transporter and sometimes GLUT3, overexpressed in many cancers (28,29,30). Glucose transporters are the molecular species that facilitate FDG transit from outside the cancer cell into the cell. Similarly, some of the hexokinase enzymes, such as hexokinase II, can be overexpressed in cancer (31). These are important proteins in the early phases of glucose metabolism, most notably the transport and phosphorylation of glucose to glucose 6-phosphate. Glucose 6-phosphate is metabolized further, but the tracer [18F]-FDG is not substantially further metabolized after this step of conversion to FDG 6-phosphate. FDG 6-phosphate is a polar molecule and has been shown to be the major species accumulated and imaged within cancers using FDG PET. By contrast, renal and genitourinary activity seen with PET, which can be vexing in image interpretation due to the presence of [18F] activity in the urine and elsewhere, in the form of FDG.
These generally prevalent alterations in glucose metabolism in cancer occur for several reasons. It has been shown that oncogenic transformation of cells, for example, by transforming oncogenes such as myc, sarc, and ras, can result in increased glucose metabolism as a part of the transformation to a malignant phenotype (32,33). There has also been an increased understanding that after malignant transformation, due to a number of key mutations in the cellular DNA, cancer cells will grow, and before they are well vascularized, or possibly after, they are vascularized but outgrow their blood supplies and can reach a state of hypoxia, where they cannot supply their intrinsic energy metabolism via oxidative metabolism (34). In such circumstances, tumor growth can be sustained through glycolytic metabolism, which does not require oxygen and can occur at the hypoxic edge of the growing tumor. Increased FDG uptake in hypoxic cells has been shown in several studies in vitro (35).
As cancers often outgrow their blood supply, an adaptive mechanism to hypoxia is activation of the hypoxia-inducible factors, such as HIF-1α and HIF-2α (36,37,38,39,40). These proteins are made more active, under conditions of hypoxia (in the case of HIF-1α, the protein is not destroyed under hypoxic conditions), and this can lead to increases in a variety of key glycolytic enzymes including hexokinase II. Under the influence of HIF-1α, at least some tumors have accelerated glucose metabolism. However, the biological story is more complex because although HIF-1α protein levels are correlated with glucose uptake as measured by PET in some tumors, this is not always the case (30). Indeed, in some instances, HIF-1α levels are not clearly elevated in cancers with high glycolytic rates. Another enzyme of some importance in glycolysis is pyruvate dehydrogenase kinase I. This enzyme inactivates pyruvate dehydrogenase, which is essential for conversion of pyruvate to acetyl Co-A. Acetyl Co-A enters the Krebs cycle, allowing for oxidative metabolism to occur. The enzyme that inactivates pyruvate dehydrogenase, PDK1, tends to prevent pyruvate from entering the mitochondria. With increased levels of PDK1, oxidative glycolysis is not favored (41). It is of interest that up-regulation of vascular endothelial growth factor is also seen in the presence of hypoxia, increasing blood vessel growth and facilitating tumor growth. Thus, considerable interlinkage of glycolysis with the survival advantages of cancer is increasingly appreciated. Preferential glucose metabolism is very likely a survival advantage for rapidly growing tumors under conditions of hypoxia. These tumors also use glucose at high rates even under conditions of normoxia. It has been shown, however, that high FDG uptake in cancers is apparent in the cells that are most hypoxic, consistent with hypoxia’s role in the FDG signal.
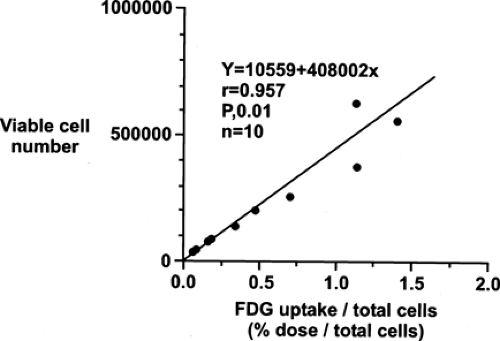
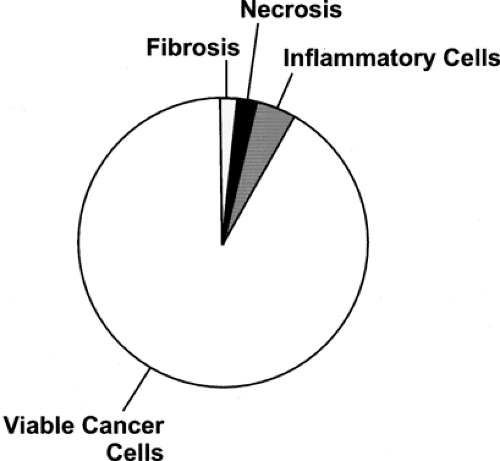
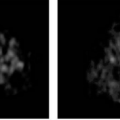
Although the reasons for increased glucose utilization in cancer are multifactorial, some general observations have been seen in a wide range of cancers as relates to the biological significance of the FDG signal. In general, across a wide range of tumor types, the extent of FDG uptake in tumors seems, at least in untreated tumors, is reasonably well and positively correlated with the viable cell number in that tumor (Figs. 8.1.2 and 8.1.3), both in vitro and in vivo
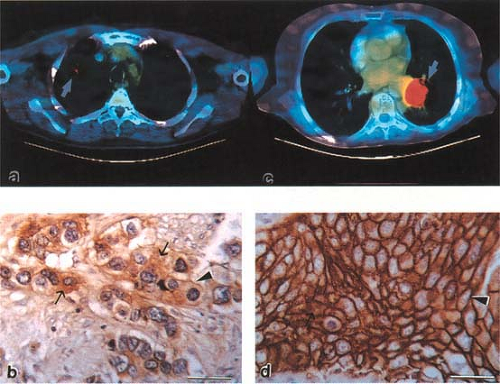
(28,42,43,44,45). In our hands, the number of viable cancer cells expressing GLUT1 on the cell membrane appears best correlated with the extent of FDG uptake in a given type of cancer (Fig. 8.1.4). This association between GLUT1 protein levels and tumor FDG uptake is generally the case, but not invariably present. Strong relationships between GLUT1 membrane expression and FDG uptake have been shown in breast cancer, esophageal cancer, and lung cancer as examples (46,47). Some studies in humans have shown FDG uptake to be correlated with HIF-1α levels and proliferating cell nuclear antigen (PCNA) levels as well. Correlations with PCNA and HIF-1 has been less strong than correlations with GLUT1 expression. In some cancer systems, the uptake of FDG in tumors is strongly and positively correlated with tumor blood flow rates (48). The glycolytic pathway has also been shown to be closely linked to the AKT pathway as well (49,50,51).
(28,42,43,44,45). In our hands, the number of viable cancer cells expressing GLUT1 on the cell membrane appears best correlated with the extent of FDG uptake in a given type of cancer (Fig. 8.1.4). This association between GLUT1 protein levels and tumor FDG uptake is generally the case, but not invariably present. Strong relationships between GLUT1 membrane expression and FDG uptake have been shown in breast cancer, esophageal cancer, and lung cancer as examples (46,47). Some studies in humans have shown FDG uptake to be correlated with HIF-1α levels and proliferating cell nuclear antigen (PCNA) levels as well. Correlations with PCNA and HIF-1 has been less strong than correlations with GLUT1 expression. In some cancer systems, the uptake of FDG in tumors is strongly and positively correlated with tumor blood flow rates (48). The glycolytic pathway has also been shown to be closely linked to the AKT pathway as well (49,50,51).
The relationships between cancer cell number, glucose transporters, flow, hexokinase levels, insulin levels, oxygen tension, cell-cycle status, adenosine triphosphate levels, receptor status, and the [18F] signal seen at PET are complex (Table 8.1.3). Of some note is that FDG uptake and GLUT1 expression rise markedly in vitro in many types of cancer cells that are made hypoxic. Tumors with low flow and high FDG uptake might well be expected to be hypoxic (52). Some studies have suggested that low blood flow and high FDG uptake in breast cancer is associated with a poor prognosis. Studies have shown high frequencies of GLUT1 positive cancer cells near necrotic regions, suggesting these border-zone cells are hypoxic (35,53). This has been confirmed in animal studies by several groups, who have shown that hypoxic tumors, as evidenced by pimonidazole staining, have higher FDG uptake than nonpimonidazole stained (less hypoxic) tumors (54). Such border zones often have elevated HIF-1α staining as well.
Determining which process—delivery of tracer to the tumor, transport of FDG into the cancer cell, or phosphorylation of the tracer into the form of FDG—is rate limiting has been a topic of some discussion. In the brain, delivery of FDG to brain is excellent. Due to the high blood flow rates, transport across blood vessels to the brain is rapid, and the glucose phosphorylation rate k3 is generally felt to represent the rate-limiting step in FDG accumulation into normal brain, with the accumulated [18F] activity in the form
of FDG 6-phosphate (7). Tumors are somewhat different in that their perfusion rate is lower than normal brain, on average, and they have areas of very low perfusion, which are hypoxic in many cases due to continued growth of tumor. Thus, delivery of tracer and transport may be more critical than the phosphorylation rate in some of these tumors (29) or at least in areas of the tumors. This area is quite complex and controversial (55,56).
of FDG 6-phosphate (7). Tumors are somewhat different in that their perfusion rate is lower than normal brain, on average, and they have areas of very low perfusion, which are hypoxic in many cases due to continued growth of tumor. Thus, delivery of tracer and transport may be more critical than the phosphorylation rate in some of these tumors (29) or at least in areas of the tumors. This area is quite complex and controversial (55,56).
Table 8.1.3 Factors Affecting Fluorodeoxyglucose Uptake in Tumors | |||||||||||||||||||||||||||||||||||||||||||||||||||
|---|---|---|---|---|---|---|---|---|---|---|---|---|---|---|---|---|---|---|---|---|---|---|---|---|---|---|---|---|---|---|---|---|---|---|---|---|---|---|---|---|---|---|---|---|---|---|---|---|---|---|---|
|
It is clear that higher levels of transporter molecules alone, such as in transgenic animals with an overexpression of GLUT1, can result in lower serum glucose levels, greater total body glucose utilization, and lesser susceptibility to the development of diabetes. This supports the concept that glucose transport can have important influences on glucose consumption rates, seemingly separate from the influence of the hexokinase levels (56). Using kinetic modeling approaches, some studies in humans have shown that tumors with higher standard uptake values (SUVs) actually had lower k3 values than a group of tumors with high k3 values (lung k3 averaged lower than breast k3, but lung SUVs were much higher than breast SUVs). This supports the importance of delivery and transport of the tracer to the net [18F] accumulation in tumors (57). Studies have also shown that when flow is measured by H2[15O](15O-water) and compared with FDG uptake, they correlate reasonably strongly, suggesting tumor [18F] uptake and flow are reasonably well linked. Thus, factors other than GLUT1 positive viable tumor cell number contribute to the net accumulation of FDG in the form of FDG 6-phosphate in tumors, but the signal is clearly correlated with the number of living, glycolytically active cancer cells in the tumor.
Stay updated, free articles. Join our Telegram channel

Full access? Get Clinical Tree


