Prostate Cancer
Olivier Rouvière
Peter L. Choyke
Baris Turkbey
Henkjan Huisman
Prostate cancer remains difficult to image. Particularly, ultrasound-based methods have yielded disappointing results in detecting and localizing cancer foci within the gland. As a result, prostate cancer is still diagnosed using random biopsy distributed within the gland in a systematic manner. It is currently recommended to obtain 10 to 14 samples per biopsy session in patients with suspicion of prostate cancer, but some authors obtain 20 samples or more in some clinical settings such as in patients with high prostate-specific antigen (PSA) levels and negative prior biopsy.1,2 Unfortunately, such a strategy based on systematic random biopsy is prone to sampling errors, with missed cancers, and is of limited value in predicting tumor burden and aggressiveness in individual patients.3,4
Intensive research has been done during the past 15 years to develop an imaging method that could show the position and size of prostate cancer foci within the gland. Such a method could indeed allow an earlier diagnosis and a better estimation of the tumor burden. Targeted (rather than random) biopsies could even provide a better evaluation of the tumor aggressiveness.
Magnetic resonance imaging (MRI), particularly the so-called multiparametric MRI that combines T2-weighted imaging and functional techniques such as dynamic contrast-enhanced (DCE) imaging, diffusion-weighted imaging, or MR spectroscopy, has recently yielded promising results in prostate cancer detection and localization and local staging.4,5,6
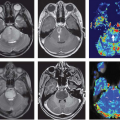
DCE-MRI is an important component of the multiparametric MRI approach. It indeed offers assessment of the vascularity and capillary permeability characteristics within the prostate gland. It has been widely used for various cancer types in the body; however, recent developments in image acquisition and image processing have made it an indispensable part of multiparametric prostate MRI for lesion detection and staging (Fig. 64.1).
This chapter discusses the role of DCE-MRI in the detection and staging of prostate cancer and its local recurrences after treatment.
Pharmacokinetic Analysis Methods
DCE-MRI provides information about tissue perfusion and vascular permeability by monitoring contrast agent uptake in repeated T1-weighted images. Tumor physiology often differs from normal tissue in high vascularity, increased capillary permeability, and an increased interstitium due to hypertension.7 As a result, DCE uptake curves in tumor are often stronger, rise more rapidly, and show stronger decay or washout.7,8,9,10,11 Manual inspection of all curves is tedious; therefore, DCE analysis is often aided by providing parametric images. Two types of DCE parameters can be distinguished: basic, semiquantitative parametric and quantitative, pharmacokinetic (PK) parameters.
Semiquantitative DCE parameters summarize enhancement curves into a few basic curve shape parameters (e.g., peak, washout, or the currently fashionable maximum slope).12 These DCE parameter maps can be displayed as color-coded overlays. Several vendors provide such maps in their prostate analysis software. These three-dimensional maps help locate focal regions by observing either asymmetric patterns or very strongly deviating values. A disadvantage of these basic DCE curve shape parameters is that they show strong dependence on machine, injector settings, and vascular condition of the patient.13
PK analysis methods aim to provide quantitative estimates of tissue compartment model parameters such as the volume transfer constant (Ktrans [1/min]) and the relative volume of extravascular-extracellular space (EES).14 Many studies have shown that Ktrans provides good diagnostic power in prostate MR analysis.15 PK analysis aims to reduce the variability between centers by standardizing the parameters and providing a biologic basis. An underrated concept in PK modeling is the arterial input function (AIF). Indeed, AIF directly affects the PK estimates because it is input into the compartment model and thus changes in vascular condition between patients will affect PK estimates. Many studies show high variability in PK estimates10 in normal prostate tissue regions, which is indicative of per-patient dependence. Several studies acknowledge the significant effect of AIF and provide AIF estimators to compensate.16,17 Other AIF estimators are reference tissue,18 and phased based.19 The effect of AIF on PK was most clearly demonstrated in a study evaluating a computer-aided diagnostic system completely relying on quantitative PK parameters.20 A constant AIF resulted in an area under the curve (AUC) of 0.65, while using per-patient AIF estimated using the reference tissue method resulted in an AUC of 0.8. Unfortunately, automated, robust estimation of the reference tissue is still under investigation. Some vendors provide manual AIF estimator methods, but these methods are time-consuming.
 FIGURE 64.1. A 67-year-old man with a serum prostate-specific antigen of 5.35 ng/dL. Axial T2-weighted magnetic resonance image (MRI) demonstrates a hypointense lesion in the left mid anterior peripheral zone (arrow) (A), raw dynamic contrast-enhanced (DCE) MRI (B), Ktrans (volume transfer constant between vascular space and extravascular-extracellular compartment), (C) and kep (rate constant between the extravascular-extracellular compartment and blood plasma) (D) maps derived from DCE MRI localize the tumor (arrows). Transrectal ultrasound-MRI fusion-guided biopsy of the lesion revealed a Gleason score 4 + 5 (70%) tumor. |
Thus, DCE analysis can significantly be aided by computerized analysis tools. Simple DCE parameters provide pixel maps that allow for rapid inspection of DCE imaging. PK offers standardized quantitative analysis, yet requires per-patient estimation of AIF for optimal performance. Good quality, automatic PK analysis methods, including per-patient AIF, are currently not available.
Dynamic Contrast-Enhanced Magnetic Resonance in the Assessment of Untreated Prostate Cancer
Detection and Localization of Prostate Cancer
As a stand-alone parameter, DCE-MRI has a highly variable reported sensitivity (46% to 96%) and specificity (74% to 96%) for the detection of prostate cancer. These large ranges are the result of patient selection and diagnostic criteria, but also of technical parameters and particularly of temporal and spatial resolution.21,22,23,24,25,26,27 A consistent result of published research is that prostate cancer is associated with rapid early enhancement and rapid washout. Ocak et al.21 evaluated 50 patients with DCE-MRI at 3T, which were analyzed with compartmental modeling (Toft’s model), and concluded that sensitivity, specificity, positive predictive value, and negative predictive value of DCE-MRI were 73%, 88%, 75%, and 75%, respectively, and noted an incremental improvement over T2-weighted (T2W) imaging for the detection of cancer. The parameters Ktrans and kep (rate constant between the extravascular-extracellular compartment and blood plasma) were used in this study to assess positivity.
Isebaert et al.27 evaluated semiquantitative DCE-MRI parameters (time to peak [TTP], maximal contrast enhancement [Cpeak], speed of contrast uptake [wash-in], and clearance
rate of the contrast agent [wash-out]) in a cohort of 53 patients. They reported that within individual patients, a consistently higher Cpeak and faster washin were present in cancers and the TTP and washout were also more rapid in tumor than in normal prostatic tissue. Despite a considerable interpatient overlap of parameter values, area under the receiver operating characteristic curve analysis demonstrated that the washin rate was a good discriminator for cancer and benign tissue (AUC = 0.82). Moreover, the combination of the washin and the washout were even more accurate (AUC = 0.87) to discriminate between cancerous and benign prostatic regions.
rate of the contrast agent [wash-out]) in a cohort of 53 patients. They reported that within individual patients, a consistently higher Cpeak and faster washin were present in cancers and the TTP and washout were also more rapid in tumor than in normal prostatic tissue. Despite a considerable interpatient overlap of parameter values, area under the receiver operating characteristic curve analysis demonstrated that the washin rate was a good discriminator for cancer and benign tissue (AUC = 0.82). Moreover, the combination of the washin and the washout were even more accurate (AUC = 0.87) to discriminate between cancerous and benign prostatic regions.
 FIGURE 64.2. Turbo-spin echo axial T2-weighted image (A), apparent diffusion coefficient map (B) and dynamic magnetic resonance image after contrast injection (C) of the prostate apex, obtained in a 64-year-old man with a prostate-specific antigen level of 9.5 ng/mL. A typical cancer is seen in the left apex, showing hyposignal at T2-weighted imaging (A, arrow), restriction of diffusion (B, arrow) and early enhancement (C, arrow). Targeted biopsy showed a Gleason score 6 (3 + 3) cancer. |
Valentini et al.28 also studied the washin rate parameter within T2W hypointense lesions in a cohort of 30 patients and reported accuracy, sensitivity, and specificity values of 91.2%, 82.5%, and 97.2%, respectively, for the washin rate set at 4.2/s as a threshold. Thus, the rapid rate of washin relative to background enhancement of the prostate is a crucial parameter. Some have referred to this as early enhancement because it appears earlier than the background tissue (Fig. 64.2). Moreover, the current experience in the literature reveals that DCE-MRI is almost always used in conjunction with anatomic T2W MRI and more recently with diffusion-weighted (DWI) MRI. Note that these combinations can be very helpful in defining lesions likely to represent prostate cancer.
In the past decade, the multiparametric approach has been reported to result in more accurate tumor detection and staging for prostate cancer. The earlier applications of the multiparametric prostate MRI included T2W MRI, MR spectroscopy, and DCE-MRI combination, and this approach yielded promising results. Panebianco et al.29 determined the role of DCE-MRI in combination with MR spectroscopy in 150 patients with a negative prior transrectal ultrasound (TRUS) guided prostate biopsy. They evaluated the subtracted DCE-MRI for regions of maximum and minimum enhancement in conjunction with T2W MRI and assessed onset time (time between contrast injection and onset of signal enhancement), TTP, and peak enhancement (Cpeak). Their criteria for tumor were lesions demonstrating early onset of enhancement and TTP as well as high Cpeak. They found out that DCE-MRI alone had sensitivity, specificity, positive predictive value, and negative predictive value of 76.5%, 89.5%, 84.5% and 83.7%, respectively, and these numbers demonstrated improvement with combined use of DCE-MRI and MR spectroscopy. The same group also reported on improved yield of prostate biopsies under visual guidance of combined DCE-MRI and MR spectroscopy with a sensitivity and accuracy of 92.6% and 90.7%, respectively, in a randomized trial including 180 patients.30
Although DCE-MRI is clearly useful in the peripheral zone, its use in the transitional zone is more controversial. Indeed, if the peripheral zone enhancement is slow and homogeneous, making it easy to detect cancers with early and strong washin, the transitional zone, where most benign prostatic hyperplasia nodules reside, shows heterogeneous and early enhancement (Fig. 64.3) that is close to that of cancer.31 Scherr et al.32 examined T2W, DWI, DCE-MRI, and MR spectroscopy in the detection of prostate cancer in 27 patients and concluded that quantitative DCE-MRI parameters of plasma flow, plasma volume, plasma mean transit time, extraction flow, extraction fraction, interstitial volume, and interstitial mean transit time obtained via applying a two-compartment exchange model were accurate in the peripheral zone but were not reliable for lesions in the transitional zone. DWI has recently been more extensively used for prostate cancer imaging, and its inclusion in the existing multiparametric prostate MRI schema has resulted in improvement in diagnostic yield. Oto et al.33 reported that combined use of the apparent diffusion coefficient and Ktrans value can potentially improve tumor detection in the transitional zone, but the results were modest. Tamada et al.34 evaluated 50 patients with T2W MRI, DWI and DCE-MRI and concluded that DCE-MRI alone had sensitivity and specificity of 43% and 95%, respectively; they also reported that combining all three modalities yielded an improved
sensitivity of 83%. Recently, Turkbey et al.35 reported that a multiparametric approach including all four sequences (T2W MRI, DWI, DCE-MRI, and MR spectroscopy) results in nearly 100% sensitivity in a prospective trial of 45 patients with pathologic validation. Based on the current experience in the past decade, multiparametric MRI has a better performance in lesion detection and local staging and DCE-MRI is an important component of this diagnostic study.
sensitivity of 83%. Recently, Turkbey et al.35 reported that a multiparametric approach including all four sequences (T2W MRI, DWI, DCE-MRI, and MR spectroscopy) results in nearly 100% sensitivity in a prospective trial of 45 patients with pathologic validation. Based on the current experience in the past decade, multiparametric MRI has a better performance in lesion detection and local staging and DCE-MRI is an important component of this diagnostic study.
 FIGURE 64.3. Turbo-spin echo axial T2-weighted (A) and dynamic magnetic resonance image after contrast injection (B). Both images show normal findings. The peripheral zone (A and B, long arrow) is located posteriorly and laterally and shows homogeneous hypersignal at T2-weighted imaging (A) and slow and homogeneous enhancement at dynamic contrast-enhanced (DCE) (B) image. The benign hyperplasia nodules located in the transitional zones (A and B, large arrows) are heterogeneous at T2-weighted imaging (A) with an early enhancement that can mimic that of cancer (B). Note the central zone (A and B, arrowhead) that is located posterior the transitional zones and is surrounded by the peripheral zone. It shows hyposignal at T2-weighted imaging and slight enhancement at DCE and should not be mistaken for cancer. |
However, multiparametric MRI remains difficult to interpret. Besides typical cancers appearing as nodules with unambiguous, marked, signal abnormalities on all MR sequences, multiparametric MRI often shows focal abnormalities with various shapes, subtle signal changes, or discrepant results on the different MR sequences (e.g., marked signal abnormality on one sequence and normal appearance on another). Research is now focusing on how the results of the different sequences of multiparametric MRI could be combined in a single diagnostic score.36 European guidelines have recommended the use of the 5-point Likert scale (1: definitively benign, 2: probably benign, 3: indeterminate; 4: probably malignant; 5: definitively malignant) to characterize focal abnormalities at multiparametric MRI,11,37 but such a scale remains subjective and prone to wide interobserver variations. Scoring systems based on more objective criteria are needed. The European Society of Uro-Radiology has recently described the so-called Prostate Imaging-Reporting and Data System scoring system,11 but it still remains to be evaluated, even if preliminary results seem interesting.38
Related posts:


Stay updated, free articles. Join our Telegram channel

Full access? Get Clinical Tree


