Pediatric Dose
Actual doses for pediatric patients may vary in different institutions based on empirical data. As rough guidelines use:
1. Clark’s rule (body weight):
DosePed = Body weight [in lbs] / 150 x DoseAdult
2. Young’s rule (child up to age 12):
DosePed = Age of child / (Age of child + 12) x DoseAdult
3. Surface area:
DosePed = (weight [in kg] 0.7 / 11) / 1.73 x DoseAdult
Lactating Patients
1. Nursing mothers must be counseled about the need to interrupt / discontinue breast feeding
2. Pumped milk may be refrigerated and used after the radioactivity has decayed
Complete cessation of breast feeding:
67Ga-citrate
131I-sodium iodide therapy
Interruption of breast feeding for 12 hours:
99mTc-labeled RBCs (in vivo labeling)
111In-labeled WBCs
Interruption of breast feeding for 24 hours:
99mTc-pertechnetate
123I-metaiodobenzylguanidine
99mTc-labeled WBCs
Interruption of breast feeding for 168 hours:
210Tl-chloride
QUALITY CONTROL OF RADIOPHARMACEUTICALS
◊ Quality control logs should be kept for 3 years!
Production of Radionuclides
Reactor-produced Radionuclides
◊ Not carrier free = contamination with other forms
» Thermal neutrons captured by stable nuclides
» Used to produce standard generators
Accelerator / Cyclotron-produced Radionuclides
◊ Generally carrier-free product
• collision of charged particles (protons, deuterons, helium, alpha particles) with target nuclide
• used to produce 67Ga, 123I, 201Tl
Fission-produced Radionuclides
◊ Carrier-free product
• splitting of a heavy nucleus into smaller nuclei
• used to produce 131I, 99Mo
Radionuclide Impurity
= amount (µCi) of radiocontaminant per amount (µCi/mCi) of desired radionuclide
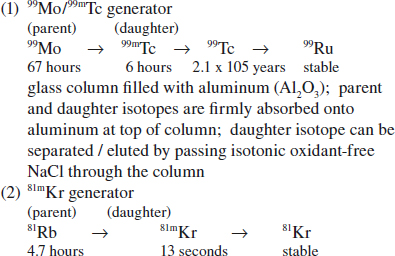
99Mo Breakthrough Test
Test frequency: with every elution
(a) NRC allowable contamination of 1÷1,000
= 1 µCi 99Mo per 1 mCi of 99mTc
(b) USP limit of 0.15 µCi 99Mo per 1 mCi 99mTc
(c) < 5 µCi 99Mo per administered dose (NRC dropped this requirement, but nonagreement states may still require this)
(d) chemical evaluation: 99Mo contaminated eluate forms colored complexes with phenylhydrazine (for reactor product generators)
• measured in dose calibrator with lead shielding of vial (filters 140 keV but permits 740 and 780 keV of 99Mo to pass through)
Effect of impurity: increased radiation dose, poor image quality
Radiochemical Impurity
Test frequency: with every elution
Precise registration of different compounds of 99mTc, eg,
› hydrolyzed reduced technetium (HR Tc) a radiocolloid [TcO(OH)2• H2O]
Limit: < 2% (presently no legal limit)
› free pertechnetate [TcO4]-1
• can be monitored by paper chromatography
Effect of impurity with hydrolyzed reduced Tc:
RES uptake, poor image quality, increased radiation dose
Chemical Impurity
Chemicals from elution process are restricted in their amount (NRC limit):
99mTc: < 10 µg Al3+ per 1 mL eluate if radionuclide from fission generator; < 20 µg Al3+ per 1 mL eluate if radionuclide from thermal activation generator
Aluminum Ion Breakthrough Test:
Test frequency: with every elution
• one drop of generator eluate placed on one end of special test paper containing aluminum reagent
• equal-sized drop of a standard solution of Al3+ (10 ppm) is placed on other end of strip
• if color at center of drop eluate is lighter than that of standard solution, the eluate has passed the colorimetric test
Effect of impurity: degradation of image quality
Radiopharmaceutical Sterility and Pyrogenicity
USP XX Test
Monitor rectal temperature of 3 suitable rabbits after injection of material via ear vein
Acceptable results: no rabbit shows a rise of > 0.6°C; total rise for all three rabbits < 1.4°C
Limulus Amoebocyte Lysate Test (LAL)
◊ Highly specific for Gram-negative bacterial endotoxins, sensitivity 10 x greater than USP XX test
| Amoebocyte = | primitive blood cell of horseshoe crab (Limulus polyphebus); lysate formed by hydrolysis of amoebocyte |
| Positive result: | in the presence of minute amounts of endotoxin LAL forms an opaque gel; response to other pyrogens (particulate contaminations, chemicals) doubtful |
QUALITY CONTROL OF CALIBRATORS
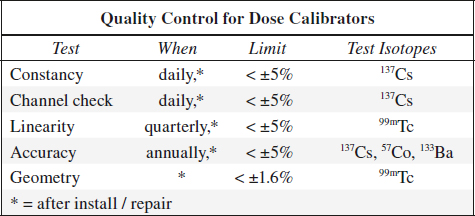
Dose Calibrator
= gas ionization chamber → transforms photon flux into current with digital readout
Disadvantages:
(1) open top geometry
(2) nonlinearity between photon energy and measured current (corrected with a calibration factor)
Constancy = Precision
= reproducibility over time
Test frequency: daily
Method: measurement of a long-lived source, usually 137Cs standard
Evaluation: measurement must fall within ± 5% of the calculated activity
Linearity
= accurate measurement over large range of activity levels
Test frequency: 4 x per year
Method: 1 mCi source activity is measured every 4 hours for 10 / more measurements (down to 10–100 µCi)
Evaluation: measurements must fall within ± 5% of the calculated physical decay curve
Accuracy
Test frequency: annually
Method: measurements of three different activity standards whose amount is certified by the National Bureau of Standards (NBS); standard values are decayed mathematically to calibrator date
| 99mTc: | 140 keV, half-life of 6.01 hr |
| 57Co: | 123 keV, half-life of 270 d |
| 133Ba: | 356 keV, half-life of 10.5 yr |
| 137Cs: | 662 keV, half-life of 30.1 yr |
Evaluation: measurements must fall within expected range
Geometry
= to ensure that measurement is not dependent upon location of tracer within ionization chamber (usually done by manufacturer)
Test frequency: at installation / after factory repair / recalibration
Method: 0.5 mL of 99mTc (activity 25 mCi) is measured in a 3-mL syringe; syringe contents are then diluted with water to 1.0 mL, 1.5 mL, and 2.0 mL and each level remeasured; test is repeated with a 10-mL glass vial
QUALITY CONTROL FOR SCINTILLATION CAMERA
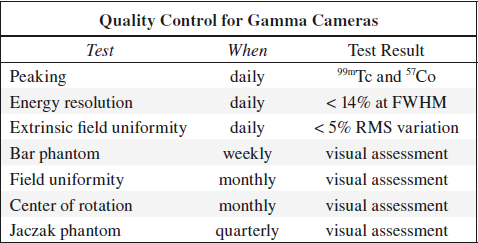
Peaking
= ensures that window of pulse height selector is correctly set to desired photopeak
(a) for 99mTc source: between 137 and 143 keV
(b) for 57Co source: between 117 and 123 keV
Frequency of quality control: daily
Field Uniformity
= ability of camera to reproduce a uniform radioactive distribution = variability of observed count density with a homogeneous flux
| (a) Integral uniformity | = | maximum deviation |
| (b) Differential uniformity | = | maximum rate of change over a specified distance (5 pixels) |
Causes for nonuniformity:
(1) High kilovoltage drift of photomultiplier tubes
(2) Physical damage to collimator
(3) Improper photopeak setting
(4) Contamination
Frequency of quality control: daily
Evaluation:
(1) Compare uncorrected with corrected images. Note acquisition time!
(2) Store correction flood
(3) Rerecord image with corrected flood + check for uniformity
(4) Variation in image should be < 5% RMS
Intrinsic Field Uniformity Test
(without collimator)
1. Remove collimator + replace with lead ring (to eliminate edge packing)
2. Place a point source at a distance of at least 5 crystal diameters from detector (4–5 feet for small, 7–9 feet for large crystals)
3. Point source contains 200–400 µCi of 99mTc for minimal personnel exposure (avoid contamination of crystal)
4. Set count rate below limit of instrument (< 30,000 counts)
5. Adjust the pulse height selector to normal window settings by centering at 140 keV with a window of 15% (for 99mTc studies only)
6. Use the same photographic device
7. Acquire 1.25 million counts for a 10” field of view, 2.5 million counts for a 15” field of view
8. Register counts, time, CRT intensity, analyzer settings, initials of controller
Extrinsic Field Uniformity Test
(with collimator on)
1. Collimator is kept in place
◊ Only 1 of 2,000 gamma rays that reach the collimator are transmitted to the sodium iodide crystal!
2. Sheet source / flood of 2–10 mCi activity is placed on collimator
(a) fillable floods: mix thoroughly, avoid air bubbles, check for flat surface
(b) nonfillable: commercially available 57Co source
3. Other steps as described above
Spatial Resolution / Linearity
A. SPATIAL RESOLUTION
= parameter of scintillation camera that characterizes its ability to accurately determine the original location of a gamma ray on an X,Y plane; measured in both X and Y directions; expressed as full width at half maximum (FWHM) of the line spread function in mm
(a) intrinsic spatial resolution
(b) system spatial resolution
B. INTRINSIC SPATIAL LINEARITY
= parameter of a scintillation camera that characterizes the amount of positional distortion caused by the camera with respect to incident gamma events entering the detector
(a) differential linearity = standard deviation of line spread function peak separation (in mm)
(b) absolute linearity = maximum amount of spatial displacement (in mm)
Frequency of quality control: every week
Method:
1. Mask detector to collimated field of view (lead ring)
2. Lead phantom is attached to front of crystal
(a) Four-quadrant bar pattern (3 pictures each after 90° rotation to test entire crystal)
(b) Parallel-line equal-spacing (PLES) bar pattern [2 pictures]
◊ Change bar direction angles weekly
(c) Smith orthogonal hole test pattern (OHP) [one picture only]
(d) Hine-Duley phantom [2 pictures]
3. Set symmetric analyzer window to width normally used
4. Place a point source (1–3 mCi) at a fixed distance of at least 5 crystal diameters from detector on central axis (remove all sources from immediate area so that background count rate is low)
5. Acquire 1.25 million counts for a small field, 2.5 million counts for a large field on the same media used for clinical studies
6. Record counts, time, CRT intensity, analyzer setting, initials of controller
(All new cameras are equipped with a spatial distortion correction circuit)
Evaluation:
visual assessment of (1) Spatial resolution over entire field (2) Linearity
Intrinsic Energy Resolution
= ability to distinguish between primary gamma events and scattered events; performed without collimator; expressed as ratio of photopeak FWHM to photopeak energy (in %)
Limit: 11% for SPECT, 14% for some planar cameras
Frequency of quality control: daily (may be weekly for some cameras)
CRT-output / Photographic Device
(1) Check for dirt, scratches, burnt spots on CRT face plates
(2) Adjust gray scale + contrast settings to suit film
SPECT QUALITY CONTROL
= SINGLE PHOTON EMISSION COMPUTED TOMOGRAPHY
= gamma cameras rotating about a pallet supporting the patient obtain 60–120 views over 180° / 360° rotation with typically a field of view of 40–50 cm across the patient and 30–40 cm in axial direction
Spatial resolution: ~8 mm for high-count study
SPECT Uniformity
1. 64 x 64 word matrix = 30 million count flood with collimator, orientation and magnification same as patient study
2. 57Co sheet source with < 1% uniformity variance is necessary
3. 128 x 128 word matrix = 120 million count flood with collimator, orientation, magnification same as patient study
Frequency of quality control: weekly
Center of Rotation (COR)
1. 99mTc-filled line source (5–8 mCi) positioned 3–5 cm off the center of rotation while keeping scanning palette out of field of view
2. Direction of rotation to be the same as in patient study
3. Number of steps (32, 64, or 128) to be the same as in patient study
4. Time per step such that at least 100K counts are acquired
5. COR must be done with same collimator, orientation, and magnification as patient study
Frequency of quality control: weekly
Jaczak Phantom SPECT Study
tests multiple camera systems with a final image
• phantom contains multiple objects of various sizes (hot and cold rods and cold balls)
• final reconstructed image is visually assessed
SPECT Sources of Artifacts
1. Scanning palette in field of view
2. Collimator shifting + rotation on camera face
3. Noncircular orbit of camera head
4. PMT failure
5. PMT uncoupling
6. Cracked crystal
7. Improper peaking of camera
SOURCES OF ARTIFACTS
A. Attenuator between source and detector
Materials: cable, lead marker, solder dropped into collimator during repair, belt buckle / watch / key on patient, defective collimator
(a) at time of correction flood procedure:
√ hot spot
(b) after correction flood procedure:
√ cold spot
B. Cracked crystal
√ white band with hot edges
C. PMT failure + loss of optical coupling between PMT + crystal
√ cold defect
D. Problems during film exposure + processing
1. Double exposed film
2. Light leak in multiformat camera
3. Water lines from film processing
4. Frozen shutter:
√ part of film cut off
5. Variations in film processing
E. Improper window setting
1. Photopeak window set too high:
√ hot tubes
2. Photopeak window set too low:
√ cold tubes
F. Administration of wrong isotope
√ atypically imaged organs
G. Excessive amounts of free 99mTc-pertechnetate
√ too much uptake in choroid plexus, salivary glands, thyroid, stomach
H. Faulty Injection Technique
eg, inadvertently labeled blood clot in syringe leading to iatrogenic pulmonary emboli
I. Contamination with radiotracer
on patient’s skin, stretcher, collimator, crystal
J. CRT problems
1. Burnt spot on CRT phosphor
2. Dirty / scratched CRT face plates
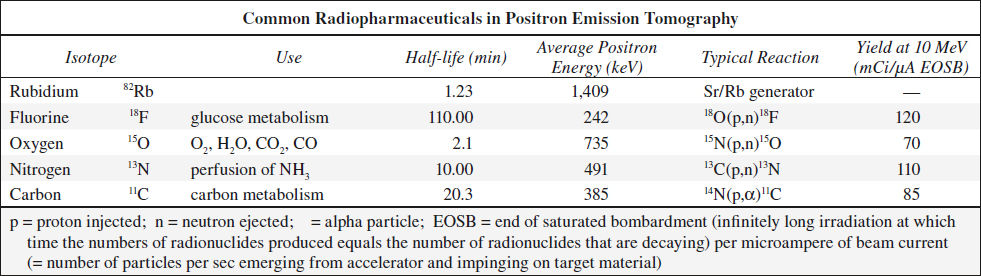
POSITRON EMISSION TOMOGRAPHY
= PET = technique that permits noninvasive in vivo examination of metabolism, blood flow, electrical activity, neurochemistry
Concept: measurement of distribution of a biocompound as a function of time after radiolabeling and injection into patient
Labeling: PET compounds are radiolabeled with positron-emitting radionuclides
Physics:
18F = positron-emitting (β+) radionuclide → positron matter-antimatter annihilation reaction with an electron (β–) → formation of annihilation photons (511 keV each) emitted in exactly opposite directions
Detection of positron annihilation photons:
simultaneous arrival of dual photons at detectors (bismuth germanate-68) on opposite sides of the patient (= electronic collimation through coincidence circuitry)
N.B.: lead collimators not necessary (= advantages in resolution + sensitivity over SPECT); spatial reconstruction similar to transmission CT
Radionuclide Production in PET
in nuclide generator / particle accelerator (positive / negative ion cyclotron; linear accelerator)
Expected amount of radionuclide: 500–2,000 mCi
Generator characteristics:
beam energy (radionuclide production rate increases monotonically with beam energy), beam current (production rate directly proportional to beam current), accelerated particle, shielding requirement, size, cost
Radiopharmaceutical Production in PET
(1) Initialize accelerator, setup
(2) Irradiation
(3) Synthesis
(4) Sterility test, compounding
Sensitivity of PET
= fraction of radioactive decays within the patient that are detected by the scanner as true events (measured in counts per sec per microcurie per milliliter)
◊ 30–100 times more sensitive than SPECT ← electronic collimation as opposed to lead collimation!
Resolution of PET
= resolving power = smallest side-by-side objects that can be distinguished as separate objects in images with an infinite number of counts (measured in mm); determined by
› distance a positron travels before annihilation occurs (usually 0.5–2 mm depending on energy)
› angle variation from 180° (±5° = 0.5 mm)
› physical size of detector (1–3 mm)
◊ Typical spatial resolution: 4–7 mm (reconstructed spatial resolution = 5–6 mm full width at half maximum in phantom measurements)
◊ In clinical practice spatial resolution is about 10 mm
Detection dependent on:
(1) Tumor size
(2) FDG activity
(3) Tumor-to-background ratio
(4) Effect of motion
◊ A smaller than 1 cm lesion can be detected when conditions are favorable
Radioactivity Distribution in PET
Pixel values proportional to radioactivity per volume
Unit: mg of glucose per minute per 100 g tissue
Imaging time: 1–10 min
Organ-specific Concentration
(a) heart, brain: contain little glucose-6-phosphatase → resulting in high concentrations of 18F-fluorodeoxyglucose
› metabolic rate of glucose is proportional to phosphorylation rate of FDG
(b) liver: abundance of glucose-6-phosphatase + low levels of hexokinase resulting in rapid clearing of FDG
(c) urine: 50% of injected activity excreted unmetabolized in urine
(c) neoplasm: enhanced glycolysis with increased activity of hexokinase + other enzymes
FDG Distribution
Intense accumulation in: brain, myocardium, intrarenal collecting system + ureter + bladder
Moderate accumulation in: liver, spleen, bone marrow, renal cortex, mediastinal blood pool
Sites of variable physiologic uptake:
@ Brown (baby) fat
= highly specialized heat producing tissue in response to cold exposure / ingestion of food (= nonshivering / diet-induced thermogenesis)
Histo: increased vascularity + high density of mitochondria → generation of heat
Location:
suboccipital cervical and supraclavicular region; paraspinal region of neck and chest; intercostal spaces at costovertebral junction; lipomatous hypertrophy of the interatrial septum, axilla; retrocrural; mediastinum adjacent to thoracic vessels; perinephric fat
◊ Keep uptake room warm; use warm blankets
@ Brain & spinal cord intense uptake in cerebral > cerebellar cortex, basal ganglia, thalamus; moderate uptake in cervical + upper thoracic spine
◊ Often used as a reference for semiquantification
@ Bone marrow usually mild uptake with homogeneous distribution; moderate to intense uptake after chemotherapy + treatment with GCsF (granulocyte colony-stimulating factor) + in anemic patients
@ Nasopharynx Waldeyer ring (negative correlation between age and uptake intensity); sublingual glands (mucous gland with inverted V-shaped uptake at floor of mouth)
@ Thyroid gland moderate / intense uptake in ⅓ of euthyroid patients; consistent with chronic thyroiditis, Graves disease
@ Thymus mild to moderate intensity; rebound hyperplasia + increased uptake for 3 months to 1 year
@ Digestive tract
Cause: metabolically active smooth muscle + mucosa, swallowed secretions, microbial uptake
› esophagus: more intense at GE junction
› stomach: SUV usually < 3.8, may be as high as 5.6
› small bowel: isolated foci with SUV < 4
› colon: right colon may have an SUV as high as 10 (lymphatic cells); moderate to intense uptake in rectum
◊ Enemas do not reduce uptake!
@ Liver hepatocytes have a higher concentration of phosphatase enzymes → resulting in dephosphorylation of FDG-6-phosphate + a faster FDG washout
◊ Delayed imaging for indeterminate liver lesion
@ Spleen diffuse uptake as physiologic reaction to extrasplenic infection, granulocyte colony-stimulating factor therapy, anemia (extramedullary hematopoiesis)
@ Skeletal muscle Major energy sources: fat and glucose (at rest 9÷1, at low exercise 6÷4, at high exercise 1÷9);
› Diabetics take medication, have morning meal within 4 hours prior to imaging
◊ No muscle effort for 24 hours before PET imaging
◊ No chewing gum / tobacco, reading, talking during uptake phase
Location: extraocular muscles; paravertebral muscles in neck + thorax (stress-induced, patient anxiety); intrinsic laryngeal muscles (speech); diaphragm (hyperventilation, forced respiration)
@ Myocardium free fatty acids are predominant metabolic substrate (50–70%); insulin → increases glucose transporters (GLUT-1 + GLUT-2) → glucose utilization increases after carbohydrate (glucose, lactate) intake
◊ Fasting (≥ 4 hours since last meal) switches to predominantly fatty acid metabolism:
› fall of plasma insulin levels → ⇑ in lipolysis in peripheral tissue + ⇑ fatty acid levels in plasma
› decrease of glucose transport into myocytes
@ Genitourinary tract pooling in upper pole calix, dilated redundant ureter, bladder diverticulum, endometrial uptake, testes (young patients)
◊ Catheterization of bladder to reduce activity + filling with 200 mL of saline just before pelvic imaging
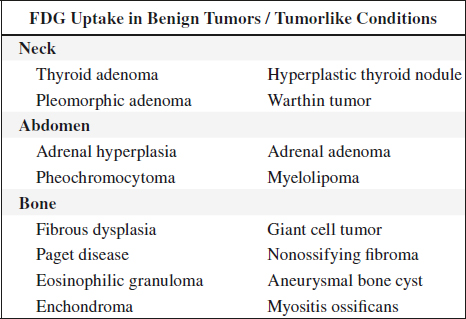
Sites of benign pathologic uptake:
@ Healing bone (for months)
@ Lymph nodes active granulomatous disease (TB, sarcoidosis), infection, recent instrumentation
@ Joints degenerative / inflammatory joint disease (often in sternoclavicular + acromioclavicular + shoulder joints), tendinopathy, enthesopathy, bursitis
@ Infection / inflammation leukocytic infiltration in abscess, pneumonia, sinusitis, granulomatous infection, talc pleurodesis, acute pancreatitis, healing by secondary intention, wound repair, resorption of necrotic debris, hematoma, fistula
Focal areas of abnormally increased FDG uptake are suspicious for malignant disease secondary to metabolic alterations that precede morphologic changes.
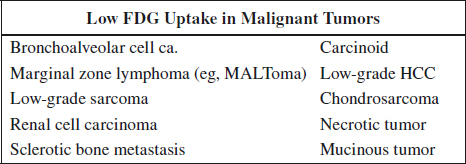
PET Imaging in Oncology
FDG = glucose analogue tracer 2-[18fluorine]-fluoro-2-deoxy-D-glucose
Pathophysiology:
serum glucose competes with FDG for entry into tumor cells → FDG becomes phosphorylated by hexokinase (malignant cells have increased hexokinase activity → high rate of glycolysis) → FDG-6-phosphate does NOT enter glycolysis pathway → 18FDG trapped intracellularly
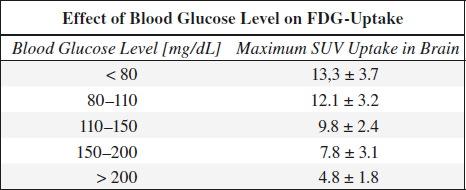
Preparation:
(1) fasting for 6 (–18) hours
(2) in diabetics blood glucose level < 200 mg/dL
Reason: FDG tumor uptake is diminished by a competitively elevated serum glucose level
FDG PET scanning should be delayed for 8–12 weeks after surgery / radiation therapy to reduce FDG-avid postsurgical changes / radiation effects that can interfere with scan interpretation!
Dose: 15 (range, 13.5–16.5) mCi
Physical half-life: 110 min
Imaging time: 45–60–70 min after administration (trade-off between decreasing background activity and declining counting statistics)
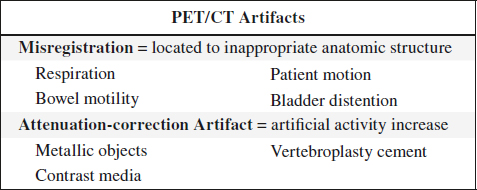
Distortion correction in whole-body imaging:
attenuation correction can be achieved with a transmission scan before / after emission image acquisition at each corresponding bed position
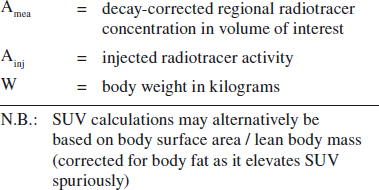
Standardized Uptake Value (SUV):
= target-to-background measure to allow comparison within and between different patients and diseases normalized to body mass
SUV = Amea [mCi/mL] / (Ainj [mCi] / W [kg])
Typical values:
soft tissue 0.8
blood pool (at 1 hour) 1.5–2.0
liver 2.5
renal cortex 3.5
malignant neoplasm 2–20
non-small cell lung cancer 8.2
breast cancer 3.2
PET – visual assessment: 98% sensitive, 69% specific
PET – SUV measurement: 92% sensitive, 90% specific
Response Evaluation in PET Imaging
(1) Reproduce the same time delay between injection and imaging as used at baseline imaging
(2) Consider partial volume effect in small residual tumor = risk of underestimation of SUV values
(3) Time delay after last chemotherapy use might influence response assessment
HYBRID PET/CT IMAGING
= combination of high-resolution PET scanner + CT scanner allows acquisition of 3-dimensional images
Indications:
1. Lung cancer
2. Breast cancer
3. Colon cancer recurrence
4. Head and neck cancer
5. Brain tumor
Lymphoma
= histologically heterogeneous group of cancers derived from cells of immune system
Prevalence: 5% of all cancers in USA
Prognosis: 6.0÷100,000 (= 20,150) deaths annually in 2013
√ enlargement of lymph nodes / secondary lymphoid tissues
√ may arise from almost any organ = extranodal lymphoma
Factors in FDG uptake:
› histologic features (Hodgkin disease versus NHL)
› grade (indolent versus aggressive NHL)
› viable tumor cell fraction
› tumor cell proliferation
› upregulation of glucose metabolism
› salvage pathways and tumor-specific pathways
› local perfusion → substrate delivery to the cancer cell
› presence of hypoxia
Extranodal Lymphoma
Prevalence: ⅓ of all lymphomas
Location: skin, stomach, small intestine (most common)
(a) primary extranodal lymphoma = early stage I (65%), stage II (74%) disease
(b) secondary extranodal lymphoma = sign of more advanced stage III or IV disease
Malignant Lymphoma / NHL
Malignancy grade:
√ uptake lower for indolent compared to aggressive lymphoma (SUV > 10 likely to have aggressive disease)
√ aggressive transformation (= change from low-grade to high-grade lymphoma) in 5–10%; requires repeat biopsy
Staging: PET/CT tends to upstage tumors
√ splenic > hepatic uptake indicates splenic involvement
√ heterogeneous scattered uptake in bone marrow involvement
Pitfalls:
(a) gastric + cerebral lymphoma difficult to detect ← physiologic accumulation
(b) increased uptake after treatment with granulocyte colony-stimulating factor (GCSF)
(c) uptake in brown fat of mediastinum
(d) uptake in Lnn with sarcoid involvement
(e) physiologic colonic uptake may be mistaken for lymphoma
(f) small-volume lesions may be undetectable
Response to Rx:
(1) Early response assessment after one cycle of chemotherapy has high prognostic value
(2) Residual abnormal FDG uptake after therapy suggests poor prognosis!
Hodgkin Lymphoma
97% of disease sites identified by FDG PET
◊ Lesion contiguity is CHARACTERISTIC!
IMMUNOSCINTIGRAPHY
= imaging with monoclonal antibodies ([= homogeneous antibody population directed against a single antigen [eg, cancer cell]) and labeled with a radiotracer
Hybridoma technique:
antibody-producing B lymphocytes are extracted from the spleen of mice that were immunized with a specific type of cancer cell; B lymphocytes are fused with immortal myeloma cells (= hybridoma)
Agents:
111Indium-satumomab pendetide = 111In-CYT-103 (OncoScint™ CR/OV) = murine monoclonal antibody product derived by site-specific radiolabeling of the antibody B27.3-GYK-DTPA conjugate with 111In
Use: detection + staging of colorectal + ovarian cancers
Dose: 1 mg of antibody radiolabeled with 5 mCi of 111In injected IV
Biodistribution: liver, spleen, bone marrow, salivary glands, male genitalia, blood pool, kidneys, bladder
Imaging: 2 sets of images 2–5 days post injection + 48 hours apart
LYMPHANGIOSCINTIGRAPHY
Lymphangioscintigraphy Technique
99mTc-albumin solution injected intradermally to raise a wheal in 1st interdigital web space of both feet / hands
Dose: 500 µCi (18.5 MBq); 92–98% of albumin are tightly bound to 99mTc
Volume: 0.05 mL; > 98% of albumin macromolecules (molecular weight of 60 kDa) enter lymphatic vessels
Imaging: at 1 min, 10–40 min and 3–5 hr with parallel-hole collimator passing over patient
Transport Index Score (TIS)
= semiquantitative measurement of objective + subjective criteria of peripheral lymphatic radiotracer transport
TIS = K + D + 0.04•T + N + V
K = transport kinetics = degree of transport delay
D = radionuclide distribution pattern = degree of dermal backflow
T = timing of radionuclide appearance in regional lymph nodes (in minutes normalized for 200 min as maximal delay)
N = demonstration + intensity of lymph nodes
V = demonstration + intensity of lymphatic collectors
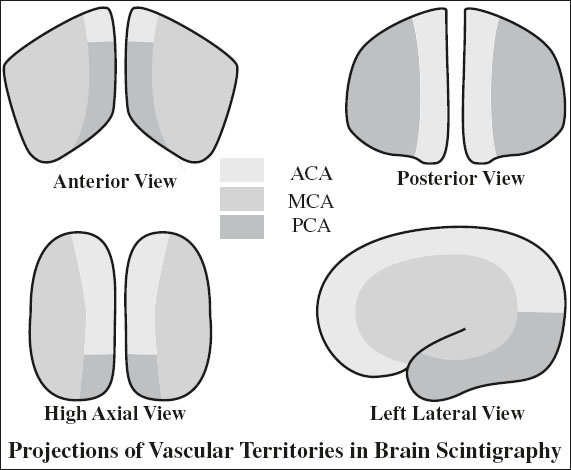
BRAIN SCINTIGRAPHY
Blood-Brain Barrier (BBB) Agents
= old-style agents require a disruption of blood-brain barrier to diffuse into brain
A. 99mTc-glucoheptonate
15–20 mCi bolus injection in < 2 mL saline; 30 flow images of 2-second duration; static image of 1 million counts after 4 hours; delayed image after 24 hours (higher target-to-background ratio than DTPA)
B. 99mTc DTPA
C. 201Thallium: best predictor for tumor burden
Brain Perfusion Agents
= lipophilic agents rapidly crossing blood-brain barrier with accumulation in brain
Applications: any disease in- / decreasing regional perfusion
1. Brain death (most common)
2. Refractory seizure disorder
3. Dementia
potentially: stroke, receptor imaging, activation studies, tumor recurrence
99mTc HMPAO
= hexamethylpropylene amine oxime = exametazime
Product: Ceretec®
Dose: 10–30 mCi
Imaging: as early as 15 min post injection
Pharmacokinetics: lipophilic radiopharmaceutical distributes across a functioning blood-brain barrier proportional to cerebral blood flow; no redistribution
Indication: acute cerebral infarct imaging before evidence of CT / MR pathology; positive findings within 1 hour of event
99mTc-ECD
= ethyl cysteinate dimer = bicisate
Product: NEUROLITE®
Dose: 10–30 mCi
Imaging: 30–60 min post injection
123I-Iofetamine
= N-isopropyl-p[123I]iodoamphetamine iodine = 123I-IMP
Product: Spectamine®
Pharmacokinetics:
initially distributes proportional to regional cerebral blood flow with increased flow to basal ganglia and cerebellum; homogeneous uptake in gray matter; ↓ activity in white matter; redistribution over time
√ activity in an area of initial deficit on reimaging (after 4 hours) implies improved prognosis
Increased Perfusion in Radionuclide Angiography
1. Primary / metastatic brain tumor
2. AVM, large aneurysm, tumor shunting
3. Luxury perfusion after infarction
4. Infection: eg, herpes simplex encephalitis
5. Extracranial lesions: bone metastasis, fibrous dysplasia, Paget disease, eosinophilic granuloma, fractures, burr holes, craniotomy defects
Decreased Perfusion in Radionuclide Angiography
1. Arterial stenosis
2. Alzheimer disease:
√ bilateral temporoparietal hypoperfusion
3. Most tumors
4. Hemorrhage
5. Subdural hematoma
Indications for Radionuclide Angiography of Brain
Seizures
Abnormal cerebral radionuclide angiography within 1 week of seizure activity even without underlying organic lesion
Etiology:
(1) 35% cerebral tumors: meningioma in 34%, metastases in 17%
(2) Cerebrovascular disease (more common in > 50 years of age)
(3) Trauma, inflammation, CNS effects of systemic disease
√ transient hyperperfusion of involved hemisphere
SEIZURE FOCUS IMAGING
for localizing intractable seizures
√ focal hypoperfusion during interictal injection of tracer (less sensitive)
√ focal hyperperfusion during ictal injection of tracer (better detection)
Brain Tumor
Etiology:
√ good correlation between hyperperfusion and enlarged supplying vessels:
(1) Meningioma (increased activity in 60–80%);
(2) Metastases (increased activity in 11–23%);
(3) Vascular metastases: thyroid, renal cell, melanoma, anaplastic tumors from lung / breast
Arterial Stenosis
◊ Radionuclide angiography of limited value!
√ asymmetric decreased perfusion in acute / chronic cerebrovascular disease:
(1) Complete occlusion / > 80% stenosis of ICA:
53–80% sensitivity
(2) 50–80% stenosis of ICA: 50% sensitivity
(3) < 50% stenosis of ICA: 10% sensitivity
Problematic lesions:
(1) Bilaterally similar degree of stenosis
(2) Occlusion of MCA + unilateral ACA
(3) Vertebrobasilar occlusive disease (20% sensitivity)
Stroke
√ “flip-flop” phenomenon (= ⇓ perfusion in arterial phase, equalization of activity in capillary phase, ⇑ activity in venous phase) ← late arrival of blood via collaterals and slow washout
PET IN BRAIN IMAGING
A. REGIONAL CEREBRAL BLOOD FLOW
(a) breathing of carbon monoxide (11C and 15O), which concentrates in RBCs
(b) 133Xe inhalation / injection into ICA / IV injection after dissolution in saline: volume distribution within cerebral water space; no correction for recirculation necessary because all Xe is exhaled during lung passage, but correction for scalp + calvarial activity is required
√ washout rate of gray matter÷white matter = 4–5÷1
B. GLUCOSE METABOLISM
for measurements of metabolic rate + mapping of functional activity
(a) 11C glucose: rapid uptake, metabolization, and excretion by brain
(b) 18F-fluorodeoxyglucose (FDG): diffuses across blood-brain barrier + competes with glucose for phosphorylation by hexokinase → traps FDG-6-phosphate within mitochondria; FDG-6-phosphate cannot enter most metabolic pathways (eg, glycolysis, storage as glycogen) and accumulates proportional to intracellular glycolytic activity; FDG-6-phosphate is dephosphorylated slowly by glucose-6-phosphatase and then escapes cell
Indications:
1. Focal epilepsy prior to seizure surgery
√ interictal ⇓ uptake of FDG of > 20% at seizure focus (70% sensitivity, 90% for temporal lobe hypometabolism)
√ hypermetabolism within 30 minutes of seizure
√ measurement of opiate receptor density with 11C-labeled carfentanil (= high-affinity opium agonist) uptake by µ receptors (found in thalamus, striatum, periaqueductal gray matter, amygdala), which mediate analgesia and respiratory depression
2. Alzheimer disease
Prevalence: 5.4 million persons in USA in 2016
• clinical diagnosis false positive in 35% ← challenging diagnosis in earlier milder forms of the disease
Histo: amyloid plaques + neurofibrillary angles (autopsy)
√ bilateral temporoparietal hypoperfusion + hypometabolism → decreased FDG uptake (92–100% sensitive)
√ sparing of sensory and motor cortex + basal ganglia + thalamus
√ atrophy of entire brain with predilection for hippocampus
DDx: frontal lobe dementia, primary progressive aphasia without dementia, normal-pressure hydrocephalus, multi-infarct dementia
3. Parkinson disease
= deficient presynaptic terminals with normal postsynaptic dopaminergic receptors
• clinical diagnosis in 50–70% accurate
DDx: drug-induced chorea, Huntington disease, tardive dyskinesia, progressive supranuclear palsy, Shy-Drager syndrome, striatonigral degeneration, alcohol-related cerebellar dysfunction, olivopontocerebellar atrophy
4. Huntington disease, senile chorea
√ hypometabolism of basal ganglia
5. Schizophrenia
√ abnormally reduced glucose activity in frontal lobes
√ dopamine receptors in caudate / putamen elevated to 3 x that of normal levels
6. Stroke, cerebral vasospasm
√ disassociated oxygen metabolism + brain blood flow
PET in Brain Tumor
Indications:
(1) Tumor grading + estimation of prognosis
◊ Apparently low-grade gliomas without contrast enhancement by CT/MR are malignant in 30%
(2) Localization of optimal biopsy site
◊ The most malignant area shows maximum of uptake
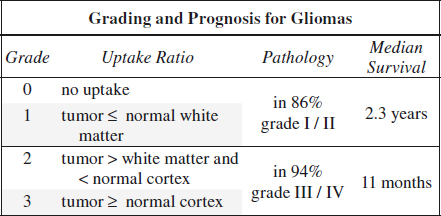
Unproven:
(3) Detection of recurrence versus radionecrosis
◊ Plagued by low specificity of 22% (cut-off greater than WM) and 56% (cut-off greater than cortex)
(4) Assessment of response to therapy
◊ SUV increases within weeks following radiation / chemotherapy ← ⇑ in metabolically active inflamma- tory elements + energy consumption for apoptosis
(5) Defining target volume for radiotherapy (?)
Assessment: 35–50 min post injection
› SUV
› tumor-to-white matter ratio (T/WM): 1.5
› tumor-to-cortex ratio (T/C): > 0.6
◊ Activity in tumor + reference area steadily increases with time after injection
RADIONUCLIDE CISTERNOGRAPHY
Indications:
1. Suspected normal pressure hydrocephalus
2. Occult CSF rhinorrhea / otorrhea
3. Suspected ventricular shunt malfunction
4 Porencephalic cyst, leptomeningeal cyst, posterior fossa cyst
Technique:
1. Measurement of spinal subarachnoid pressure
2. Sample of CSF for analysis
3. Subarachnoid injection of radiotracer
Normal study (completed within 48 hours):
symmetric activity sequentially from basal cisterns → up the sylvian fissures + anterior commissure → eventual ascent over cortices with parasagittal concentration
√ image lumbar region immediately after injection to ensure subarachnoid injection
√ activity in basal cistern by 2–4 hours
√ activity at vertex by 24–48 hours
√ no / minimal lateral ventricular activity (may be transient in older patients)
Agents:
1. 111 Indium-DTPA
Physical half-life: 2.8 days
Gamma photons: 173 keV (90%), 247 keV (94%) detected with dual pulse height analyzer
Dose: 250–500 µCi
Radiation dose: 9 rad/500 µCi for brain + spinal cord (in normal patients)
Imaging: at 10-minute intervals / 500,000 counts up to 4–6 hours; repeat scans at 24, 48, 72 hours
2. 99m Technetium-DTPA
Not entirely suitable for imaging up to 48–72 hours; DTPA tends to have faster flow rate than CSF; used for shunt evaluation + CSF leak study since leak increases CSF flow
Dose: 4–10 mCi
Radiation dose: 4 rad for brain + spinal cord
3. 131 Iodine-serum albumin (RISA)
prototype agent; beta emitter
Physical half-life: 8 days; high radiation dose of 7.1 rad/100 µCi; no longer used secondary to pyrogenic reactions
4. 169 Ytterbium-DTPA
Physical half-life: 32 days
Gamma decay: 63 keV; 177 keV (17%); 198 keV (25%); 308 keV; dual pulse height analyzer set for 177 + 198 keV
Dose: 500 µCi
Radiation dose: 9 rad/500 mCi for brain + spinal cord (in normal patients)
CSF Leak Study
Purpose: localization of origin of CSF leak in patient with CSF rhinorrhea / otorrhea
Causes of dural fistula:
(a) traumatic: in 30% of basilar skull fractures
(b) nontraumatic: brain, pituitary and skull tumors; skull infections; congenital defects
Location of dural fistula:
cribriform plate > ethmoid cells > frontal sinus
Method:
» Weigh cotton pledgets
» Pledgets placed by ENT surgeon in the anterior and posterior turbinates bilaterally
» Radiopharmaceutical injected intrathecally via lumbar puncture; immediate postinjection view of lumbar region to ensure intrathecal placement
◊ Contraindicated in active meningitis / elevated intracranial pressure!
» Pledgets removed and weighed 4–6 hours after lumbar injection
» Pledget activity counted + indexed to weight
» Results compared with 0.5-mL serum specimens drawn at the time of pledget removal
» Pledget to serum count ratio of > 1.5 = evidence of CSF leak
» With active leak patient should be placed in various positions with various maneuvers to accentuate leak
Disadvantage: low sensitivity + high FN in intermittent leak
THYROID SCINTIGRAPHY
Indications:
(1) Classification of hyperthyroidism
(2) Evaluation of solitary / dominant nodule
(3) Detection and staging of postoperative thyroid cancer
(4) Evaluation of upper mediastinal mass
(5) Evaluation of neonatal hypothyroidism
(6) Evaluation of developmental anomalies
A. SUPPRESSION SCAN
= to define autonomy of a nodule
√ suppression of a hot nodule following T3 / T4 administration is proof that autonomy does not exist
B. STIMULATION SCAN
= to demonstrate thyroid tissue suppression by hyperfunctioning nodule
√ administration of TSH documents functioning thyroid tissue (rarely done)
C. PERCHLORATE WASHOUT TEST
= to demonstrate organification defect
√ repeat measurement of radioiodine uptake following oral potassium perchlorate shows lower values if organification defect present
◊ Best interpreted by direct comparison with sonography!
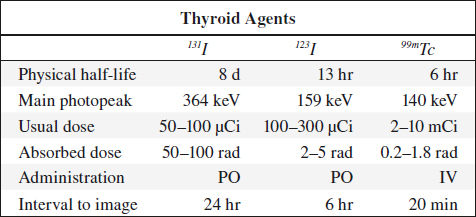
99mTc-Pertechnetate in Thyroid Imaging (99mTcO4–)
Physical half-life (for gamma emission): 6.03 hours
Biologic half-life: 1 day (94% decays to 99Tc in 24 hours)
Decay: by photon emission of 140 keV
Quality control:
(1) < 0.1% 99Mo (= 1 µCi/mCi), maximum of 99Mo at 5 µCi
(2) < 0.5 mg aluminum/10 mCi 99mTc
(3) < 0.01% radionuclide impurities
Administration: oral / IV
Dose: 3–5 mCi administered IV 20 min prior to imaging (100–300 mrad/mCi)
Pharmacokinetics:
Uptake by: thyroid, salivary glands, gastric mucosa, choroid plexus
Excretion: mostly in feces, some in urine
Uptake in thyroid: 0.5–3.7% at 20 minutes (time of maximum uptake); assessment of trapping function only; NO organification; may be almost completely discharged by perchlorate
Imaging:
(a) Collimator: usually with pinhole collimator for image magnification (5-mm hole)
(b) Distance: selected so that organ makes up ²/³ of field of view; significant distortion of organ periphery occurs if detector too close
(c) Counts: 200,000–300,000 counts are usually acquired within 5 min after a dose of 5–10 mCi of 99mTc-pertechnetate
(d) Image must include markers for scale + anatomic landmarks + palpatory findings
Advantages:
(2) Reduced radiation exposure
(3) Greater photon flux than iodine = detectability of small thyroid lesions (> 8 mm) is improved
(4) Excellent physical characteristics
Disadvantages:
(1) High neck background (target-to-background ratio less favorable than with iodine)
(2) Lesions with pertechnetate-iodine discordance
(= hot on 99mTc-pertechnetate + cold on radio-iodine) are very rare + due to 99mTc-avid cancer
(3) Poor for substernal evaluation
123Iodine
◊ Agent of choice for thyroid imaging!
Production: in accelerator; contamination with 124I dependent on source (122Te in ~ 5%, 123Xe in ~ 0.5%); contamination with 125I increases with time elapsed after production
Physical half-life: 13.3 hours
Decay: by electron capture with photon emission at 159 keV (83% abundance) + x-ray of 28 keV (87% abundance)
Dose: 200–400 µCi orally 24 hours prior to imaging (radiation dose of 7.5 mrad/µCi)
Uptake: iodine readily absorbed from GI tract (10–30% by 24 hours), distributed primarily in extracellular fluid spaces; trapped + organified by thyroid gland; trapped by stomach + salivary glands
Excretion: via kidneys in 35–75% during first 24 hours + GI tract
Advantages:
(1) Low-radiation exposure
(2) Excellent physical characteristics
(3) Uptake + scan with one agent (organified)
Disadvantages compared with 99mTc-pertechnetate:
(1) More expensive
(2) Less available with short shelf-life
(3) More time-consuming
(4) Radionuclide impurities
(5) Higher dose to thyroid (but less to whole body)
131Iodine
Indication: thyroid uptake study, thyroid imaging, treatment of hyperthyroidism, treatment of functioning thyroid cancer, imaging of functioning metastases
Production: by fission decay
Physical half-life: 8.05 days (allows storing for long periods)
Decay: principal gamma energy of 364 keV (82% abundance) + significant beta decay fraction of a mean energy of 192 keV (92% abundance)
Dose: 30–50 µCi (1.2 rad/µCi = 50 rad for thyroid)
Radiation dose: (90% from beta decay, 10% from gamma radiation) 0.6 mrad/mCi for whole body; 1.2 mrad/µCi for thyroid (critical organ)
Pharmacokinetics: identical to 123I
Related posts:
Stay updated, free articles. Join our Telegram channel

Full access? Get Clinical Tree


