Introduction
Positron emission tomography/magnetic resonance imaging (PET/MRI) is an innovative imaging technology that simultaneously acquires PET and MRI, allowing the integration of sensitive metabolic and functional information with precise structural and anatomical characterization of tissues ( ). PET/MRI has shown great potential in tumor diagnosis, treatment planning, and follow-up ( ). In addition to the qualitative image evaluation, PET/MRI may potentially provide several imaging biomarkers for tumor characterization extracted both from PET and MRI that are currently extensively used in cancer research ( ).
In the new era of precision medicine, radiomics is an emerging translational field of research aiming to extract a large amount of meaningful quantitative features followed by their interpretation through various analyses and integration into predictive models. The term “radiomics” derives from the combination of “Radio,” denoting the use of medical images such as computed tomography (CT), PET and MRI, and “Omics,” used for all the technologies that handle large amounts of quantitative data. The main goal of this discipline is to contribute understanding unexploited subvisual information of tissue pathophysiology, phenotype and microenvironment, thus representing a supportive tool for clinical decision-making, including diagnosis, treatment monitoring, and prediction of prognosis. Notably, this is accomplished in a repeatable, objective, low-risk, and noninvasive way. To achieve this goal, radiomics employs machine learning and deep learning algorithms to develop diagnostic, predictive and/or prognostic models thus assisting the progression toward “precision” or “personalized” medicine ( ).
At present, radiomics is a still very heterogeneous field of research. Radiomic features (RFs) consist of mathematically quantitative descriptors extracted from medical images; however, standardized guidelines for their definition, extraction, and interpretation are still missing. An attempt to standardize this discipline, so far, is provided by the Image Biomarker Standardization Initiative (IBSI), which works toward the generation of consensus-based recommendations for radiomic studies and seeks to provide standardized RFs nomenclature and definitions ( ). With respect to RFs, some describe the morphology of a given region of interest (ROI), or volume of interest (VOI) (morphological features), some others the distribution of values of individual voxels within the ROI/VOI (first-order statistics) or, conversely, the distribution between neighboring voxels of a given ROI/VOI (second-order statistics, also called textural features). Finally, RFs can also be extracted after the application of filters (e.g. wavelet, logarithm etc.) to the original images to highlight details that are initially not perceivable (higher-order statistics).
The key underlying radiomic hypothesis is that the constructed descriptive models based on imaging quantitative analysis are capable of providing additional data with respect to the information captured by the human eye alone, or by invasive techniques such as biopsies ( ). The purpose of the radiomic approach is therefore to use these previously unseen patterns to develop “radiomic signatures,” that is, the set of best ranking, most discriminative features capable of uniquely identifying factors, such as for example phenotypes. Thus, radiomics not only potentially provides limitless objective biomarkers without entailing any additional examination for patients, but also bears the possibility to provide objective judgment of medical images.
Although the pipeline of a radiomic analysis is not well established yet and great efforts are needed to standardize this discipline, two main approaches to perform radiomics can be identified: hand-crafted radiomics (HCR) and deep learning-based radiomics (DLR). Hand-crafted radiomics consists in the extraction of predefined features from a segmented ROI/VOI (that usually corresponds to the tumoral area), followed by the search and selection of the most informative ones to be used as input for predictive models ( ). The general workflow of a hand-crafted radiomic analysis consists of the following key steps:
- 1.
Generating an input for the model; meaning that images must be acquired, preprocessed (to reduce noise and artifacts), and segmented to determine the ROI (or VOI). Segmentation may be performed manually, semiautomatically, or automatically.
- 2.
Features extraction: apply processing algorithms to extract quantitative data from the ROI/VOI; generally, these features consist in descriptors of intensity distribution, spatial relationships between various intensity levels, texture heterogeneity patterns, shape descriptors, and relations toward the tumor environment.
- 3.
Features selection: extracted features undergo a selection or reduction process to discard redundant, noninformative parameters. This allows to reduce the computational effort and possibility of overfitting of the model.
- 4.
Statistical analysis/model building: the most informative and representative features are finally analyzed, alone or in combination with additional data, through different methodologies, generally consisting of statistical analyses and/or machine learning.
An alternative hand-crafted workflow consists, after steps 1 and 2, in the employment of deep learning models, such as artificial neural network, for the analysis of extracted RFs. Notably, this approach does not necessitate the feature selection step, and, even if requiring more expertise and computational power, may speed up the process. Apart from the analysis of RFs, deep learning algorithms can be exploited directly to extract from images the most relevant features based on the conditions of a predefined task (i.e. cancer type prediction, disease diagnosis, survival prediction, etc.). This procedure, known as deep learning-based radiomic, has recently emerged and, compared to the traditional approach, presents several benefits. First of all, image segmentation or a selection of predefined features is not needed anymore, as parameters are extracted in an entirely automatic way, without requiring any prior knowledge of the input data. Secondly, it is an end-to-end process, in which the performances of the trained networks can be easily and quickly improved as they are fed with more training samples ( ). However, large amounts of data are required for proper neural networks efficiency, and this may limit applicability in clinical settings, where the number of available datasets is generally small.
Deep learning networks for radiomics are generally based on convolutional neural networks (CNN) ( ). Compared to traditional neural networks, CNNs in each layer filter the input image using a kernel that is learned during training. In this way, each layer information is extracted by looking at the relation each pixel has with its closest neighbors. By concatenating multiple layers, information can be extracted from the whole image, combing both information contained in small details with those at larger spatial scales. A representation of the different radiomic workflows is shown in Fig. 15.1 .

When building either machine learning or deep learning models, several recommendations need to be considered to obtain reproducible and reliable results. Among these, the partitioning of available data into training, validation, and test sets is one of the most relevant. Precisely, the training set is used to learn an initial model, the validation set is employed to further tune the model’s parameters, and finally the test set is used to provide an unbiased evaluation of the model performance on data not used for training.
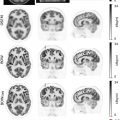
Considering that radiomics is rapidly emerging as a translational approach, and that the simultaneous acquisition of PET/MR scans offers better alignment (see Fig. 15.2 ) and direct correlation of images, PET/MR-based radiomics represents a promising methodology in the field of oncology. The easy coregistration of ROI/VOI between PET and MR imaging allows indeed to extract both functional and morphological data from the patient at the same time, facilitating the simultaneous analysis of heterogeneous and possibly synergic data in a single end-to-end approach.

In the present chapter, different clinical applications of radiomics based on PET, MRI, and PET/MR images will be presented, with a specific focus on the characterization of the following tumors: brain tumors, breast cancer (BC), pancreatic neuroendocrine tumors (NETs), and prostate cancer (PCa). Finally, some other applications of artificial intelligence (AI) applied to PET/MR images that can promisingly shortly enter into clinical practice will be explored.
PET/MRI radiomics in brain tumors
As brain has a complex structure, with several molecular receptors and targets, and neuro-oncologic tumors are one of the most frequent cancers in all ages, neuroimaging has rapidly embraced the emerging field of radiomics and most advanced image-based AI methods.
Brain cancer diagnosis is predominately based on neuroimaging findings ( ). At the same time, most of the local treatment options, such as radiotherapy and neurosurgery, strictly depends on accurate knowledge of tumor’s type, location and extent, which can only be obtained from medical imaging such as CT, MRI and PET ( ). For decades, thanks to its ability in providing excellent soft tissue contrast, conventional MRI, such as pre- and postcontrast T1-weighted, T2-weighted, and fluid attenuation inversion recovery (FLAIR), has been the standard modality for the diagnosis and localization of brain tumors ( ; ). However, it still presents limitations in terms of specificity, tumor extent definition and treatment response assessment, thus leaving important diagnostic challenges unsolved. In order to address and overcome some of these limitations, advanced MRI techniques have been introduced with insights such as perfusion, angiogenesis, cellularity, pH, or metabolite concentrations. Among these techniques, perfusion-weighted imaging (PWI), MR spectroscopy, diffusion-weighted imaging (DWI), MR chemical exchange saturation transfer, and susceptibility-weighted imaging (SWI) are largely used in clinic.
PET is another imaging technique frequently used in neuro-oncology, allowing to quantitatively and noninvasively visualize different biological processes, thus providing functional information on tumor characteristics. For brain tumors, the most widely available PET tracer for body imaging, 2-[18F]-fluoro-2-deoxy-D-glucose ( 18 F-FDG), presents limitations due to the high background glucose metabolism of normal gray matter structures. Differently, amino acid PET tracers such as [11C]-methyl-L-methionine ( 11 C-MET), O-(2-[18 F]fluoroethyl)-L-tyrosine ( 18 F-FET), and 3,4-dihydroxy-6-[18F]-fluoro-L-phenylalanine ( 18 F-FDOPA) are extensively used for various clinical indications, being characterized by high diagnostic specificity ( ). PET can be used in several clinical settings of brain tumor, such as the differentiation between neoplastic and nonneoplastic processes, the definition of treatment planning and monitoring, post-treatment evaluation ( ; ). Despite the high specificity, PET imaging is always integrated with a morphological imaging. Most of the PET systems are integrated with CT scanners, although the number of PET/MRI hybrid scanners is increasing, being particularly promising in this field.
Within such a variety of advanced imaging modalities, radiomics in neuro-oncologic patients is currently based mainly on the analysis of conventional MRI ( ; ). To this regard, several clinical questions of considerable importance have been addressed. Precisely, treatment strategies and decisions for brain tumor patients are predominantly based on both their classification and molecular markers characterization. Furthermore, patients’ management deeply depends on the differentiation of treatment-related changes from tumor and brain metastases progression, potential occurrence of local relapses or radiation-induced injury, and prediction of time interval to progression-free and overall survival. Methods including hand-crafted and deep learning-based radiomics have therefore been studied and exploited to support these major clinical questions and are summarized in the following paragraphs.
Definition of WHO grade in patients with newly diagnosed gliomas
In 2016, the World Health Organization (WHO) revised the classification of tumors of the central nervous system; a correct classification is crucial for a correct treatment approach and it is currently based on tissue samples obtained by tumor resection or stereotactic biopsy. Yet, about 15% of glioma are unresectable ( ), and stereotactic biopsy carries a considerable risk for morbidity, especially in elder populations ( ). Radiomics-based, noninvasive determination of WHO grade in patients with newly diagnosed gliomas has therefore gained great interest and, up to now, the imaging techniques mainly investigated include conventional and advanced MRI. With respect to conventional MRI, obtained areas under the receiver operating characteristic (ROC) curve (AUC) currently range between 0.90 and 0.94 ( ; ; ), considering both hand-crafted and deep learning-based radiomic methods. Slightly superior results have been gained from conventional and advanced MRI used together in a multiparametric approach based on a support vector machine model, reaching AUCs of 0.96–0.97 ( ; ). Considering PET imaging, one study demonstrated the feasibility of amino acid 18 F-FET PET radiomics for the differentiation between WHO grade III and IV gliomas, providing an AUC of 0.83 ( ). Finally, one recent study assessed the predictive potential of combined, multidimensional, and multiparametric 18 F-FET PET/MRI analysis with machine learning and radiomic algorithms to differentiate between WHO I-IV gliomas and between low-grade (LGG) and high-grade gliomas (HGG) ( ). As reported, the best prediction of WHO I-IV grading was yielded using a combination of features extracted from the contrast-enhanced T1 and 3D-FLAIR sequences and apparent diffusion coefficient (ADC) map, which provided an AUC of 0.82 (sensitivity 0.78; specificity 0.73). For the classification of HGG und LGG, the best results derived from features extracted from the contrast-enhanced T1, SWI sequences and 18 F-FET PET, yielding an AUC of 0.85 (sensitivity 0.83; specificity 0.80). These results were obtained through a stratified cross-validation procedure, accounting for both training and a testing set. This is an particularly relevant, being the majority of the studies only been tested on the training cohorts, lacking any kind of validation.
Determination of the IDH genotype and 1p/19q codeletion status in patients with newly diagnosed gliomas
As for the determination of the tumor’s grade, the identification of specific molecular markers, such as the presence of a mutation in the isocitrate dehydrogenase (IDH) gene and the loss of heterozygosity (LOH) of the 1p/19q chromosome, are important for the choice of the most appropriate treatment strategies in patients with newly diagnosed gliomas, allowing an integrated diagnosis according to the WHO classification 2016 ( ). IDH-mutant gliomas, including astrocytomas (without 1p/19q codeletion) or oligodendrogliomas (characterized by 1p/19q codeletion), generally have a longer progression-free and overall survival with respect to IDH-wildtype tumors, such as astrocytomas or glioblastomas, harboring better prognosis ( ). As for characterization of tumor grade, the determination of these molecular markers is obtained from tissue samples analysis. Several studies have therefore investigated the application of radiomics for the noninvasive prediction of the IDH genotype and the 1p/19q codeletion status in patients with gliomas.
For IDH mutation prediction using conventional MRI, hand-crafted radiomics provided in the validation cohorts AUCs up to 0.92 ( ), which slightly improved through the application of a deep learning-based approach (AUC = 0.96) ( ). The inclusion of advanced MRI sequences demonstrated, in the validation cohort, an accuracy of 90% using a hand-crafted radiomic model and contrast-enhanced T1, T2, and DWI sequences ( ), and an AUC of 0.95 using a deep learning model and Diffusion Tensor images only ( ). One study performed by Lohmann et al. evaluated PET imaging, investigating and comparing the role of 18 F-FET PET standard parameters and textural features. In the prediction of the IDH genotype, standard parameters provided accuracies within the range of 71–73%, while RFs reached the accuracy of 71%; the combination of the two sets showed an accuracy of 81% (80% after model validation). Authors repeated the comparison by selecting, among the initial cohort, only those patients examined on the hybrid PET/MR scanner, demonstrating this time accuracies up to 79% for both standard parameters and textural features separately, and up to 93% using their combination (86% after model validation) ( ). A study evaluated the performance of multiparametric 18 F-FET PET/MRI and MR fingerprinting ( ). The different potential of the distinct imaging techniques was tested, showing, among the results, an AUC of 0.84 for contrast-enhanced T1, 0.66 for ADC, 0.79 for FLAIR, 0.78 for proton density magnetic resonance fingerprinting (MRF) M0 map and 0.64 for PET. Eventually, the combination of all the investigated images provided an AUC of 0.79, while the combination of contrast-enhanced T1, FLAIR, and MRF M0 provided the highest AUC (0.88). Finally, Tatekawa et al. investigated the synergism between multiparametric MRI and 18 F-FDOPA PET, obtaining a classification performance to differentiate IDH status with AUC and accuracy of 0.81 and 0.76, respectively ( ).
Considering the 1p/19q codeletion status, hand-crafted radiomics using conventional MRI provided AUCs between 0.69 ( ) and 0.76 ( ), while the deep learning-based approach showed an AUC of 0.88 ( ).The addition of DWI to conventional sequences in a hand-crafted radiomics approach demonstrated instead a predictive accuracy of 80% ( ). With respect to PET imaging, one study conducted by Zaragori and colleagues investigated the role of 18 F-FDOPA, showing an AUC of 0.72 and identifying in a single texture feature up to 14.5% of importance for the prediction of the implemented hand-crafted radiomic model ( ). Finally, one PET/MRI analysis showed that proton density MRF M0 map alone, as well as in combination with the nonenhanced T1 dark fluid sequence, provided the best predictive value for the 1p19q deletion with an AUC of 0.98, followed by contrast-enhanced T1 (AUC = 0.86) and PET (AUC = 0.86) images ( ).
Determination of the MGMT promoter methylation status
The methylation status of the O 6 -methylguanine-DNA methyl-transferase (MGMT) promoter is a molecular marker involved in the DNA repair process. This marker has shown to favor pseudoprogression over tumor progression in high-grade glioma patients conventionally treated ( ). Different studies have investigated the application of radiomics for the noninvasive determination of the MGMT promoter methylation status ( ; ; ; ).
To date, the majority of the studies has been applied to conventional MRI, with AUCs up to 0.88 using hand-crafted radiomics ( ) and accuracies up to 95% using deep learning algorithms (ResNet) ( ). A study performed on 18 F-FDG PET scans using hand-crafted radiomics provided an AUC of 0.86 in the test dataset ( ). Finally, a study conducted a hand-crafted radiomic analysis on a PET/MRI scanner obtained AUCs of 0.72, 0.71, 0.58 and 0.64 using T1, contrast-enhanced T1, FLAIR and PET scans, respectively ( ). However, the best result (AUC = 0.75) was reached through the combination of T1, contrast-enhanced T1, and diffusion-weighted with b = 1000.
Prediction of progression-free survival (PFS) and overall survival (OS)
Optimal patients’ management and counseling is strictly dependent on the assessment of survival probabilities. Survival prediction in glioma patients is commonly investigated by using statistical approaches and clinical features such as age, morphology, grade, etc. With the rapid development of AI techniques, there has been a strong interest among researchers to apply these methods to survival prediction.
Again, to date, the most studied imaging technique is MRI. Conventional MRI studies have investigated RFs extracted from both preoperative scans of the primary tumor and postoperative scans of peritumoral regions, and generated predictions for PFS and OS outperformed those based on clinical features alone ( ; ). In a study, prediction errors decreased by 36% for PFS and 37% for OS when adding the radiomic signature, compared to a reduction of 29% and 27%, respectively, using molecular and clinical features alone ( ). Similar findings have been observed when using advanced MRI. RFs extracted from both fractional anisotropy (FA) calculated from DTI and normalized cerebral blood volume (CBV) coming from perfusion MRI, for instance, demonstrated better predictive value for local progression (AUC = 0.79) than single imaging parameters (FAmin AUC = 0.54; CBVmax AUC = 0.54) in a hand-crafted radiomic study ( ). Functional PET imaging has also been employed for this kind of analysis, both in the form of 18 F-FDG ( ) and 11 C-MET PET imaging. Particularly, in a 11 C-MET PET study performed by Papp et al., the combination of radiomic and clinical features provided an AUC of 0.90 for the prediction of survival in glioma patients ( ). Currently, no investigation has been specifically performed on PET/MR imaging.
Differentiation between tumor progression and pseudoprogression
Early differentiation of treatment-related changes such as pseudoprogression from tumor progression is fundamental in patients with malignant gliomas ( ; ). Pseudoprogression describes the manifestation of a progressive enhancing lesion on MRI typically within 12 weeks after radiotherapy, chemotherapy or radio-chemotherapy, not related to tumor growth and not confirmed as progressive disease on later imaging studies, with spontaneous improvement of MRI findings without any treatment change ( ; ; ). Although amino acid PET and advanced MRI have already demonstrated their value in the diagnosis of pseudoprogression ( ; , ; ), several studies have investigated whether radiomics might improve the discrimination between pseudoprogression and progression.
Some of these studies explored the combination of conventional and advanced MRI (DWI and PWI) in hand-crafted radiomic studies, providing AUCs in the range of 0.85–0.94 in the test dataset ( ; ). With respect to deep learning radiomics, a study conducted on conventional MRI (contrast-enhanced T1) reached an AUC of 0.83 incorporating both clinical and imaging features, which outperformed the model based on clinical features solely ( ). The combination of conventional and advanced MRI in deep learning approaches provided instead an accuracy of 82% using DWI and FLAIR sequences ( ) and 75% using multiparametric (mp-MRI) data (T1, contrast-enhanced T1, T2, FLAIR, DTI, and dice similarity score (DSC)) ( ). One group also evaluated a novel feature-learning method based on deep convolutional generative adversarial networks and a convolutional neural network to identify and extract from DTI images discriminative features, which eventually yielded a diagnostic AUC of 0.95 (accuracy: 92%) in the validation dataset ( ). Regarding PET imaging, amino acid PET in the form of 18 F-FET PET was investigated in few studies, providing an accuracy of 75% in a dataset of solely 14 patients (therefore requiring further validation) ( ), and 86% in the test dataset of a 35 patients cohort ( ). Furthermore, in the work conducted by Lohmann and colleagues ( ), the 18 F-FET PET radiomics model correctly diagnosed pseudoprogression in all test cohort patients (AUC of 0.74; sensitivity of 100%); from the obtained results, authors suggest that 18 F-FET PET radiomics helps diagnose patients with pseudoprogression with a high diagnostic performance.
Differentiation between treatment-related changes and local tumor recurrence in patients with brain metastases
Patients with brain metastases are usually treated with stereotactic radiosurgery (SRS), thus resulting radiation injuries such as radiation necrosis are often indistinguishable from tumor recurrence using conventional MRI alone. Different studies applied radiomics for the differentiation between these two phenomena ( ; ; ; ).
Up to now, radiomic exploitation of conventional MRI reached AUCs in the range of 0.73–0.81 in the validation set, not further validated on an external test set ( ; ). Interestingly, in the study performed by Peng and colleagues, a hand-crafted radiomic model provided a sensitivity of 87% and specificity of 65% in the distinction between treatment effect after SRS and true tumor progression ( ). Classification outcomes were compared to the ones based on imaging description and clinical interpretation performed by a board-certified neuroradiologist with 16 years of postfellowship experience, blinded to final histopathologic and clinical outcome, which eventually consisted in a sensitivity and specificity of 97% and 19%, respectively. Considering amino acid PET imaging, a study was performed on 18 F-FET PET scans of patients with suspicious MRI findings for tumor recurrence after radiosurgery ( ). Results demonstrated how RFs allowed to obtain a diagnosis of tumor recurrence with 85% accuracy, even though outcomes were not validated on a validation nor a test set. A similar investigation was conducted on 11 C-MET images, where the differentiation between recurrent brain tumor and radiation necrosis though a hand-crafted radiomic approach yielded the highest AUC (0.98), outperforming the conventional 11 C-MET PET parameter evaluation (AUC = 0.73) ( ). Finally, a study tested the potential of combining 18 F-FET PET and MRI radiomics ( ). Patients with newly or progressively contrast-enhancing lesions on MRI after radiotherapy were indeed additionally investigated using 18 F-FET PET. The combination of the PET/MRI features, as well as the performance of the features extracted separately from each modality, was tested through the generation of three different models. The highest diagnostic accuracy was obtained by the combined PET/MRI model (accuracy: 89%, sensitivity 85%, specificity 96%), followed by the 18 F-FET PET one (accuracy: 83%, sensitivity: 88%, specificity: 75%) and lastly the contrast-enhanced MRI one (accuracy: 81%, sensitivity: 67%, specificity: 90%).
In summary, radiomics is increasingly applied in the field of neuro-oncology and its potential value as an additional source of diagnostic information has been demonstrated, with possible impact on patients’ management and outcome. The application of radiomics to PET/MRI has been very limited so far, and results are yet to be established. Nevertheless, the clinical use of PET/MRI is significantly relevant in neuro-oncology and its use will expand during years to come. Consequently, the number of radiomic studies focused on PET/MRI will certainly increase. Despite being quite limited, the available results on the role of radiomics on PET/MRI in neuro-oncology are very promising, and they suggest the need of further investigations in this specific field of research. Importantly, multiple studies have shown an improved performance when combining features derived from PET imaging, further emphasizing the potential added value of hybrid tomographs for these indications.
PET/MRI radiomics in breast cancer
Breast cancer is the worldwide most diagnosed cancer in 2020, being the first cause of death in women cancer patients ( ). Breast MRI is an important modality in BC, providing morphological and anatomical information. This imaging modality is mainly used in the setting of BC staging, lesion detection and response assessment to Neoadjuvant Chemotherapy (NAC) ( ). T1-weighted Dynamic Contrast Enhanced (DCE) sequence is the typical imaging modality for breast MRI, which relies on gadolinium injection as contrast agent. From DCE-MRI, semiquantitative (e.g., washin or washout slope and Maximum Signal Difference (MSD)) and pharmacokinetic (e.g., volume transfer constant (Ktrans) and volume fraction of plasma (Vp)) parameters can be obtained as descriptors of contrast agent perfusion inside tissues. DCE-MRI in BC evaluation is characterized by high sensitivity; however, it has been demonstrated that breast MRI alone lacks specificity ( ). On the other hand, PET is an imaging technique that provides metabolic information. 18 F-FDG is the most commonly used radiotracer in PET oncologic imaging and in BC its uptake is usually related to the histological type of lesion (e.g., tubular carcinoma or invasive ductal carcinoma) ( ). However, tumor 18 F-FDG avidity and low spatial resolution due to partial volume effect resulted to be the main limitations in 18 F-FDG PET BC diagnosis ( ). The hybrid PET/MRI system integrates the MRI sensitivity with the metabolic characterization of PET, thus potentially improving the clinical management of BC ( ; ; ).
The application of radiomics in BC has been mainly focused on studies involving DCE-MRI ( ; ; ; ; ; ; ; ; ), integrating RFs with semiquantitative or pharmacokinetic parameters of DCE-MRI ( ; ) or ADC map parameters ( ), showing preliminary results in different fields of research. Some of those fields are: prediction of axillary lymph node (ALN) or sentinel lymph node (SLN) metastasis ( ; ; ), prediction of NAC response ( ; ; ; ; ; ; ), differentiation between benign and malignant tumor ( ; ), prediction of molecular subtype of BC ( ; ).
Several studies using a radiomic approach were also focused on breast PET imaging. The topic of major interest is the prediction response to NAC ( ; ), but also including reports aimed at finding correlation between RFs, integrated with other PET quantitative parameters, and immunohistochemical prognostic factors ( ; ) or subtype of BC ( ).
The number of studies involving RFs extraction from both PET and MRI in the same examination is recently growing. Six papers that present this modality will be reported ( ; ; ; ; ; ) three of them combining imaging parameters from hybrid 18 F-FDG PET/MRI ( ; ; ).
Prediction of axillary or sentinel lymph node metastasis
The prediction of axillary or sentinel lypmh node metastasis is the most investigated clinical need, especially in MRI studies. Liu et al. conducted a study on 164 BCE patients, who underwent DCE-MRI aiming to differentiate the SLN prediction capability of a machine learning model, changing the input parameters (RFs only, DCE-MRI pharmacokinetic parameters only and their combination) ( ). Shape, first-order and texture RFs were extracted in the strongest enhanced phase and seven features were selected, including first- and second-order entropy. As results, the obtained AUC values for the radiomic model, pharmacokinetic parameters model and combined model were 0.81, 0.77, and 0.80, respectively, for the training cohort and 0.74, 0.74, and 0.76, respectively, for the validation cohort. Han et al. obtained similar results for ALN metastasis prediction in another DCE-MRI study on 411 BCE patients ( ). Clinical features were included and wavelet features were added to RFs ones. Using only the 12 selected RFs, including second order entropy and sum entropy, the AUC values for the training and validation cohort were 0.76 and 0.78, respectively. Using information from both radiomic and clinical features, AUC values were 0.84 and 0.87 for the training and validation set, respectively. In another study, Liu et al. extracted RFs from DCE-MRI images of 163 BCE patients ( ). Shape features were extracted from the intratumoral ROI of the first postcontrast phase. The other RFs (first-order, texture, and Law’s features) where extracted both in the intratumoral and peritumoral ROIs of 3 maps obtained from DCE (washin map, washout map and Signal Enhancement Ratio (SER) map). The research was conducted predicting SLN metastasis only with the reduced RFs alone and together with clinicopathological parameters (age, tumor location, histological type and grade of invasive carcinoma, molecular subtype, lymph-vascular invasion (LVI) and multifocality). In the first modality, RFs were reduced to 4, including second order entropy feature, and results for training and test sets were AUC = 0.84 and 0.81, sensitivity = 0.76 and 0.67 and specificity = 0.82 and 0.78, respectively. In the second modality, input parameters were reduced to 6 (5 RFs, including second order entropy feature, and 1 clinicopathological parameter (LVI)) and results for training and test sets were AUC = 0.91 and 0.87, sensitivity = 0.90 and 0.78 and specificity = 0.83 and 0.86, respectively. Recently, a radiomics approach to breast PET imaging was found for the prediction of ALN metastasis. Song extracted RFs from PET images of 100 patients who underwent 18 F-FDG PET/CT ( ). The three most important RFs for predicting ALN metastasis were two wavelet second order features and sphericity shape feature. The radiomic model’s sensitivity, specificity, and accuracy values were 90.9%, 71.4%, and 80%, respectively. One of the aims investigated by Umutlu et al. was the prediction of lymphonodular and distant metastatic spread from 124 patients who underwent simultaneous hybrid 18 F-FDG PET/MRI ( ). RFs were extracted from both PET and MR (DCE, ADC maps and T2-weighted) images. The same machine learning model was developed, using input data from various combinations of images, reducing features to a maximum of 6 for each case. The best result for lymphonodular and distant metastatic spread was obtained using features from both PET and MR, with an AUC value of 0.81 and 0.99, respectively.
Prediction of neoadjuvant chemotherapy response
Several studies have investigated the role of radiomics applied to both PET and MRI to assess NAC response in BC patients ( ; ; ; ; ; ; ). Fusco et al. conducted a research on 45 breast DCE-MRI subjects ( ). Textural RFs and semiquantitative features were extracted and used for the prediction. The percentage change of median value of these features before and after the first cycle of treatment was calculated and significant percentage differences were found in entropy, long-run emphasis, and busyness among the textural features, MSD, washout slope, washin slope, and Standardized Index of Shape (SIS) among semiquantitative parameters of DCE-MRI. However, SIS showed the best result with a ROC-AUC of 0.93 in predicting pathological complete response. Similar results were found in Fan et al., in which 103 BCE patients underwent DCE-MRI ( ). The dataset was divided into a main cohort and a reproducibility cohort. Fifty-seven patients belonged to the first set and they were scanned with 1.5T MRI system. The remaining 46 patients, constituting the reproducibility set, were scanned with a 3T MRI system. RFs and dynamic parameters of DCE-MRI were extracted to predict NAC response. The result indicated AUC values of 0.91 and 0.87 for the main study cohort with 12 features and the reproducibility study cohort with 11 features, respectively. The aforementioned features belong to statistical, background parenchymal enhancement (BPE), morphologic, and dynamic feature groups (seven features were the same in the two cohorts). In Lemarignier et al., textural RFs and conventional PET parameters (such as SUV, metabolic tumor volume (MTV), total lesion glycolysis (TLG)) were evaluated to predict response to NAC in 171 patients ( ). Considered P -value less than 0.05 statistically significant, SUV max and TLG were selected as the best predictor for pathological response ( P = .0021 and P = .02, respectively). However, textural features did not show good results ( P : 0.27, 0.19, 0.94, 0.19 for entropy, homogeneity, contrast, and energy, respectively). Nevertheless, Cheng et al. found predictive textural features extracted from 18 F-FDG PET images of 61 patients with BC after two cycles of NAC ( ). Promising preliminary results were obtained in both HER2-negative and HER2-positive patients. The 3 features used were entropy, coarseness and skewness, with the addition of SUV max , MTV, and TLG. For each feature, the percentage change of the value in PET image acquired before the first NAC and the one after the completion of the second cycle of NAC was computed. For HER2-negative patients, SUV max , entropy and coarseness proved to be predictive (AUC = 0.93, 0.81 and 0.80, respectively) for the second cycle of NAC response. On the other hand, only the percentage difference of SUV max and skewness were predictive (AUC = 0.75 and 0.76, respectively) in HER2-positive patients. Yoon et al. showed that RFs from both PET (25 features of second-order, with P value between 0.005 and 0.047) and ADC (2 s-order, including entropy, and 1 first order feature, with P value between 0.024 and 0.033) were useful indices for NAC response prediction in Locally Advanced Breast Cancer (LABC) of 83 patients ( ).
Differentiation between benign and malignant lesion
Another topic mainly studied in breast MRI is the discrimination between benign and malignant lesions. Karahaliou et al. investigated the possibility that RFs could differentiate benign versus malignant lesions in 82 biopsy-proven breast lesions ( ). Fourteen texture features were extracted from DCE-MRI initial enhancement (IE), post-initial enhancement (PIE), and SER parametric maps. The corresponding AUC values for the 3 maps were 0.77, 0.91 and 0.92, respectively. The selected features were entropy for SER map, sum entropy and sum average for IE map and entropy and sum average for PIE map. In another study, Jiang et al. included ADC quantitative parameters to textural and morphological RFs of DCE-MRI, leading to an accuracy value of 0.90 ( ). In an interesting study of PET/MRI, Vogl et al. developed an automatic segmentation algorithm and compared it with manual segmentation of breast lesion ( ). First order, second order, and characteristic parameters were extracted from DCE-MRI, DWI and 18 F-FDG PET. For the classification task on 34 patients (12 benign and 22 malignant lesions), AUC, sensitivity and specificity values were 0.98, 0.95 and 0.94, respectively. Kinetic and spatiotemporal texture features had the highest contribution for lesion classification, while 18 F-FDG PET and morphologic features were less predictive. Only in the segmentation task, performance was improved with the combination of features coming from the three imaging modalities, reporting a detection rate of 83.3% and 100% in segmentation of benign and malignant lesions, respectively. In a recent study including 102 patients who underwent hybrid 18 F-FDG PET/MRI, Romeo et al. extracted quantitative data and RFs from DCE, ADC-map, T2-weighted and PET images of 120 breast lesions ( ). A machine learning classifier was trained using 8 combinations of input data, after being reduced to 3 or 5 features, depending on the model. The best performance was obtained using mean transit time (DCE quantitative parameter), ADC value of breast lesions and RFs extracted from PET image and ADC map, with an AUC value of 0.983.
Additional purposes
In addition to the previous reported aims, other clinical scenarios have been investigated regarding the use of radiomics in BC, including the correlation of PET RFs with immunohistochemical factors or subtypes and breast MRI radiomics for the prediction of survival and BC molecular subtype. Some representative studies were chosen to provide a general overview of these aims.
Moscoso et al. focused their study on 139 BCE lesions derived from a dedicated breast 18 F-FDG PET imaging ( ). PET features, such as SUV mean , SUV max , metabolically active tumor volume, and TLG were extracted and integrated with first and second-order RFs. As result, PET parameters extracted from dedicated breast PET images allowed a more precise heterogeneity characterization than those obtained by whole-body PET. When comparing luminal A and luminal B negative subtypes, textural features were able to discriminate immunochemistry subgroups. Another discovered result was the low correlation between texture features with SUV, as shown also by . However, textural features showed high correlation with MTV and significant association with the histological type (0.02 < P < 0.03) in ( ).
Ma et al. investigated whether RFs extracted from 377 DCE-MRI patients were associated with Ki-67 expression of BC ( ). Shape, first-order, and second-order RFs were extracted from the first postcontrast image and only the largest section of tumor was analyzed. Three RFs (contrast, entropy, and line likeness) were the most statistically significant and the best classification obtained provided AUC 0.77, accuracy 0.76, sensitivity 0.78, and specificity 0.77. Better results in other molecular subtypes are shown in Fan et al. ( ). An overall AUC of 0.87 was obtained. Morphology and texture, as well as dynamic features from tumor and BPE and 2 clinical information-based parameters (age and menopausal status) were extracted. The AUC values to predict luminal A, luminal B, HER2 and basal-like subtypes were 0.87, 0.79, 0.89, and 0.92, respectively. Other aims investigated by Umutlu et al. were BC subtype analysis, hormone receptor status, proliferation rate, and tumor grade (specifications of this research are in the “Prediction of axillary or sentinel lymph node metastasis” section) ( ). The best result for BC subtype analysis was obtained in the differentiation between luminal A and luminal B, using all MR sequences (AUC = 0.98). Best prediction results of hormone receptor status (estrogen receptor AUC 0.87 and progesterone receptor AUC = 0.88) and proliferation rate (Ki-67 AUC 0.997) were achieved by all MR sequences and PET data. Finally, PET information provided the best AUC value (0.71) for grade determination.
Two radiomic breast PET/MRI studies investigated the prediction of survival outcome ( ; ). Yoon et al. reported the prediction of survival in LABC ( ). It was found that only PET texture features could aid the prediction of disease recurrence. Only 2 PET features were significant and none of the ADC maps textural parameters showed important results in predicting free survival. Another PET/MRI investigation studied recurrence free survival (RFS) at 1, 2, 3, 4, 5 years ( ). AUC of the RFS at 1 year showed the best value (0.74) compared to 2, 3, 4, 5 years (between 0.47 and 0.68). Conversely to Yoon et al., the important features for RFS in 1 year are mainly MRI-derived texture features and only 1 PET-derived texture feature. Additional purposes that Huang et al. investigated were the association between unsupervised clusters of RFs and outcome data, the pairwise relationship between PET and MRI RFs and BC outcome, the prediction of tumor grade and, with Oncotype DX score, the pairwise relationship between tumor genomic data and radiomics on a small dataset (8 patients out of 113) ( ). In tumor grade prediction, the best AUC value achieved was 0.76 and the predictive RFs were mainly relatives to PET-derived texture features (except texture PET-derived entropy and SUV mean ). As results of the association between the derived subgroups of RFs and outcome data, 4 clinical variables were statistically significantly associated with them: tumor grade ( P = 2.0 × 10 −6 ), tumor overall stage ( P = 0.037), BC subtypes ( P = .0085), and disease recurrence status ( P = 0.0053). In tumor grade, the correlation between RFs was positive with first-order statistic of PET image entropy and PET-derived texture (dissimilarity, entropy, difference average, and difference entropy). Conversely, the first-order statistic of PET image uniformity and other PET-derived texture were negatively correlated with tumor grade. No correlation was found between the PET or MR RFs and T, N, or overall stage. For correlation with BC subtypes, some PET image texture features, including difference entropy, and PET SUV mean, and SUV max, are remarkable. Two MR-derived texture features and PET-derived texture cluster prominence were useful in correlation of RFS in 1 year, while first-order statistics of MR image mean and minimum and some MR-derived texture features for the 2,3,4,5 years. Finally, in the study conducted on the small dataset, first-order MR-derived uniformity ( ρ = 0.67) and tumor surface-to-volume ratio ( ρ = 0.71) was positively correlated with Oncotype DX score, while first-order MR-derived entropy ( ρ = −0.67) and texture autocorrelation ( ρ = −0.64) were negatively correlated.
Finally, Schiano et al. reported data of 52 subjects who underwent hybrid 18 F-FDG PET/MRI, dividing them into three groups: 11 BCE patients with one or multiple metastases at primary diagnosis (Synchronous Metastasis, SM) ( ); 26 BCE patients who developed metastases at follow up (Metachronous Metastasis, MM); 15 healthy subjects (HS). The purpose was to improve detection of metastatic disease, combining imaging parameters from hybrid 18 F-FDG PET/MRI and the expression level of the transcriptional factor Yin Yang 1 (YY1). PET, T2-weighted, DWI, DCE-MRI sequences and ADC map were analyzed. Features extracted were: tumor volume, SUV-related, some first-order features, and texture features. Significant positive correlation between texture and SUV max ( r = 0.8 and r = 0.8 respectively) was found in BC patients. YY1 level correlated significantly with SUV max ( r = 0.48) and it was overexpressed in ER+/PR+/HER2-subtype of BC patients with SM at primary diagnosis compared to MM and HS ( P < .001). Although no correlation between YY1 protein and 18 F-FDG PET/MRI parameters was found, this work showed that the combination between molecular determination of YY1 and 18 F-FDG PET/MRI parameters could provide differentiated information related to detection of metastasis for treatment decision.
As a general consideration, the number of PET/MR studies for the characterization of BC is increasing, but MR alone is still the most commonly used imaging technique in this setting. The most considered RF are entropy-based (first-order or second-order-derived features) while texture features demonstrate to have an important role in all the investigated settings. However, from the presented literature and available data, results could be improved combining RFs with conventional parameters of both PET and MRI.
PET/MRI radiomics in pancreatic neuroendocrine tumors
The incidence of NETs has steadily increased in the last few decades, with gastroenteropancreatic (GEP) NETs being the most frequent NETs and the second most common gastrointestinal cancers ( ). The pancreatic gland is the most common site of origin of GEP-NETs. Although an indolent behavior is peculiar of pancreatic NET (PanNETs) compared to pancreatic adenocarcinomas, these tumors might present a broad spectrum of aggressiveness, depending on several factors, including grade of malignancy, tumor burden, adjacent organs invasion and presence of regional or distant metastases ( ). Histopathological features of PanNET are therefore the most important determinants of tumor behavior, thus having impact on disease management including patients’ selection, decision of optimal treatment strategies and planning the most appropriate modalities and timing to be adopted for patients’ follow-up ( ).
Surgery is the first-line therapy for localized PanNETs and in advanced, but still resectable neoplasms. However, the optimal management of PanNETs patients is still a matter of debate as the optimal sequence of treatments or established criteria for selecting those patients who might benefit from targeted therapy are still lacking; moreover, effective biomarkers able to assess treatment efficacy have not been univocally defined ( ; ). Although in functioning PanNETs and large nonfunctioning PanNETs (>2 cm) surgery is the only recognized treatment capable of improving the oncologic outcome, with small NF-PanNETs (≤2 cm) it is not yet clearly defined in which cases surgery or surveillance should be performed, considering the risk of morbidity and mortality associated to surgical intervention resections, and the risk of developing metastatic disease during follow-up ( ; ).
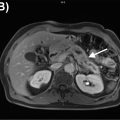
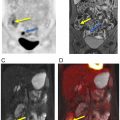
Currently, endoscopic ultrasound fine-needle aspiration is the best modality to determine several histopathological features of PanNET, even if this approach has intrinsic limitations, including the inability to give a whole-tumor heterogeneity assessment, as it provides samples only from a limited part of the tumor ( ). An accurate imaging approach is a crucial key point for PanNETs staging and in treatment response assessment, in order to plan the most appropriate patients’ management and follow-up. However, the mere qualitative/visual interpretation of both morphological and functional images has the limitation of not providing sufficient information regarding tumor behavior. The role of radiomics as a noninvasive tool able to implement the characterization of tumors heterogeneity has been reported, with only few data currently available regarding the clinical scenario of PanNET. Although the majority of data on radiomics in PanNETs is focused on CT images, it has to be noted that PET and MRI radiomic analysis held an invaluable potential in this setting as well, as demonstrated by the few studies using these two imaging modalities in the field of PanNETs.
Definition of PanNETs characteristics, tumor behavior, and aggressiveness
As mentioned above, treatment strategies of PanNETs depend on histological features of the tumor, including grade. Recently, Bevilacqua and colleagues investigated the ability of RFs extracted from 68 Ga-DOTANOC PET images in predicting tumor grade ( ). They demonstrated that two second- order statistics RFs (entropy and homogeneity) were the most effective in predicting grade 1 (G1) and 2 (G2), with models presenting AUCs in the range of 0.87–0.90. However, only 25/26 patients had histology as gold standard, and remaining data were retrieved from biopsy, which, due to the lower certainty degree, could mislead models training.
Other characteristics, beyond tumor grade, can be considered to investigate and define tumor aggressiveness. Mapelli et al. reported the role of specific texture features derived from 68 Ga-DOTATOC and 18 F-FDG PET in predicting PanNETs diameter, angioinvasion, and lymph nodal involvement, which are tumor characteristics influencing tumor behavior ( ). With respect to MRI radiomic studies, De Robertis and colleagues investigated MRI RFs and reported that whole-tumor RFs extracted from ADC maps may be helpful in predicting tumor grade (AUC = 0.75), vascular involvement (AUC =0.82), lymph nodal and liver metastases (AUCs = 0.71 and 0.82, respectively) in PanNETs, thus implementing the identification of those tumors presenting more aggressive behavior ( ). Bian et al. proposed a radiomics model including 14 texture features derived from noncontrast MR images able to provide a good preoperative discrimination between G1 versus G2-G3 PanNET both in the training cohort (AUC = 0.85) and the validation cohort (AUC = 0.74) ( ). The same group extracted RFs from the arterial and portal venous MR images of 157 patients treated with surgical resection for PanNET. They proposed a model including seven selected features significantly associated with grade as a valuable noninvasive alternative for differentiating PanNETs tumor grades (AUC = 0.77) ( ). Guo and colleagues investigated the performance of MRI and texture parameters in predicting histopathological grade in 77 patients with PanNETs. They showed that specific RFs extracted from T2-weighted and DWI MRI sequences were significantly different ( P < .001) in differentiating pNETs according to their grade, and generated several different models showing AUCs in the range of 0.70–0.98 ( ).
Prediction of treatment response
The potentiality of a radiomic approach in predicting peptide receptor radionuclide therapy (PRRT) response with PET and MR imaging has been also investigated. Önner et al. evaluated pretreatment 68 Ga-DOTATATE PET in 22 patients with GEP-NETs candidate to PRRT. They found that the values of specific RFs of the lesions not responding to PRRT were significantly higher than those with response to PRRT treatment ( P < .001). However, ROC curves showed moderate AUC values (0.619; 0.518) ( ). Werner et al. investigated the prognostic value of intratumoral textural features derived from 68 Ga-DOTA-TATE/TOC PET prior PRRT. They showed how imaging-based features were able to correctly assess intratumoral heterogeneity and, compared to conventional PET parameters (maximum and mean standardized uptake value (SUVmax/mean)), demonstrated superior prognostic performance in PanNETs patients undergoing PRRT. Specifically, increasing values of entropy could predict a longer survival (entropy > 6.7: OS = 2.5 years), whereas lower values portended inferior outcome (entropy < 6.7: OS = 1.9 years). Moreover, Kaplan–Meier analysis revealed a significant distinction between high- and low-risk groups using entropy ( n = 31, P < .05) ( ). Finally, a study performed by Weber et al. was conducted on PET/MRI data. They compared the differences between PRRT-responders and nonresponders by assessing the differences in PET and ADC maps parameters extracted from 68 Ga-DOTATOC-PET/MRI performed before and after treatment. They found that treatment responders showed a statistically significant decrease in lesion volume and a borderline significant decrease in entropy on ADC maps when compared to nonresponders ( P < .05). Moreover, patients treated with standalone somatostatin analogues showed a borderline significant decrease in mean and maximum ADC, compared to patients treated with PRRT. However, no parameters were able to predict treatment response to PRRT on pretherapeutic 68 Ga-DOTATOC-PET/MRI, probably because of the small sample size ( ).
There is little evidence regarding the use of radiomics analysis on PET and MR images in PanNET so far; however, the great potential of this imaging technique in this field is evident. In fact, the combination of morpho-functional imaging as simultaneously derived by PET/MRI scanners and the possibility to extract and analyze quantitative parameters by using a radiomic approach, my certainly support and ameliorate the investigations aimed at improving the definition of PanNETs behavior, thus improving patients’ management from first-line treatment to disease surveillance.
PET/MRI radiomics in prostate cancer
According to the WHO, there were 1.414.259 new cases of prostate cancer (PCa) in 2020, making PCa the second most commonly occurring cancer in men worldwide ( ). Early diagnosis and characterization are pivotal for an optimal long-term PCa management and bear remarkable consequences on its relatively low mortality rate. Albeit the diagnosis of PCa requires histopathological confirmation ( ), imaging is essential for PCa patients, as it distinguishes between local, regional or distal disease. Furthermore, mp-MRI was shown to be especially useful in clinical practice, limiting the number of unnecessary biopsies ( ; ). In 2019 the second version of the prostate imaging-reporting and data systems was upgraded (PI-RADS v2.1) to improve the standardization of the acquisition and interpretation of prostate mp-MRI. PI-RADS v2.1 consists of a one to five Likert scale that summarizes the likelihood to detect PCa. This score is calculated after considering T2-weighted sequences in at least two dimensions, ADC maps generated from DWI and DCE MRI. Since its introduction, PI-RADS v2, has reached widespread acceptance and it is now commonly applied in patient care ( ), where it has improved diagnostic accuracy of PCa up to 60%–90% ( ).
The role of PET in PCa evaluation is rapidly evolving. Choline PET was first introduced for the study PCa, especially in restaging, although its limit in detecting disease recurrence at low prostate-specific antigen (PSA) values is commonly recognized. The Food and Drug Administration has recently approved two more radiopharmaceutical binding to prostate-specific membrane antigen (PSMA): 68 Ga-PSMA 11 and 18 F-DCFPyL (PyL) for the clinical management of PCa. A recent meta-analysis reports that PSMA PET/CT sensitivity and specificity for nodal staging are 69% and 92%, respectively ( ), being complementary to mp-MRI that has a higher spatial resolution making it more suitable for the characterization of the primary tumor. Therefore, hybrid PET/MRI scanner that allows for the simultaneous acquisition of metabolic, structural, and functional imaging combines the strength of mp-MRI for local characterization of PCa, and that of PET for the detection of lymph nodes (LN) involvement and distant metastases. However, the qualitative evaluation of medical images by an expert is sometimes susceptible to inter- and intraobserver variability and it does not exploit all the information stored in medical images.
The implementation of radiomic analysis for the clinical management of PCa is growing quickly, exploiting subvisual information stored in medical images commonly acquired in clinical practice. Here it is reported an overview of all the applications of radiomics in PCa care, where it supports clinical decision making, such as the diagnosis of a disease, monitoring of treatment response or prediction of prognostic factors like biochemical recurrence (BCR) and the development of distant metastases.
Prostate cancer detection
Mp-MRI screening prior to biopsy reduced the number of unnecessary follow-up procedures in PCa patients by guiding a more precise sampling. However, while PI-RADS levels 4 and 5 are highly associated with clinically significant PCa, and PI-RADS 1 and 2 are usually indicators of the absence of PCa, PI-RADS 3 lesions are problematic. Of all PI-RADS 3 lesions biopsied, just 20% are estimated being clinically significant PCa and at present there is not an established approach to effectively selecting PI-RADS three patients for follow-up procedures. Radiomics based on mp-MRI could help clinicians in the detection of clinically significant PCa in PI-RADS three lesions, allowing adequate treatment planning. In a recent study, Hou and colleagues used T2-weighted, ADC, and DWI based RFs to train a classifier that outperformed two expert radiologists in the discrimination between clinically significant and nonsignificant PIRADS 3 lesions ( ). Similarly, Giambelluca et al. based their analysis on first- and second-order RFs, classifying histologically confirmed clinically significant PIRADS three lesions with an accuracy of 80%, potentially allowing to reduce the number of unnecessary biopsies, while lowering also the risk of undertreatment ( ).
Increasing evidence suggests that adding PSMA PET to mp-MRI improves the detection rate for PCa ( ). Zamboglou et al. demonstrated that radiomics bears the potential to also increase the sensitivity of PET imaging. In fact, in their study hand-crafted PET-based radiomics identified lesions missed by visual inspection of 68 Ga-PSMA PET with a sensitivity of 85% ( ).
Prostate cancer grading
Low grade PCa patients are likely to benefit from conservative approaches, like active surveillance, while patients with a more aggressive disease are usually referred to radical interventions such as radical prostatectomy (RP) and radiation therapy (RT). To date Gleason score (GS) based on biopsy is the gold standard to define PCa grade, although it is affected by sampling error. In fact, Bullock et al., in a recent meta-analysis reported that 36.3% of GS 5 to 6 are upgraded to higher values after surgery ( ). Since PCa grading plays such a central role in the clinical management of the disease, it is necessary to find new ways to accurately grade the pathology to guide treatment planning. Hand-crafted radiomics based on mp-MRI has been extensively investigated to predict GS. Distinguishing between GS ≥ 8 and GS ≤ 7 is particularly important, since in patients with GS ≥ 8 radical interventions are usually the treatment of choice, and classifiers based on mp-MR RFs do it with great precision (AUC range: 0.65–0.93) ( ; ; ). Other authors suggested to lower the threshold of clinical significance to GS ≥ 7, arguing that the disease might likely progress. Interestingly, results gathered with radiomics based classifiers distinguishing between GS ≤ 6 versus GS ≥ 7 are similar to the ones previously described (AUC range: 0.66–0.89) ( ; ; ; ; ). Only one study investigated the utility of PET based first- and second-order RFs, showing that a classifier using those features as input reached an AUC of 0.84 for the identification of GS ≥ 8 ( ). Papp et al., in 2021 were the first feeding features extracted from hybrid 68 Ga-PSMA PET/MRI to a classifier that discriminated between Gleason grade <4 versus Gleason grade ≥4 with an AUC = 0.86 ( ). Following these promising results, Solari et al. used RFs extracted from 68 Ga-PSMA PET and ADC maps of the whole prostate to discriminate International Society of Urological Pathology (ISUP) grade 1–3 PCa from grade 4 and 5. This combination of features outperformed both a clinical model and single imaging modality radiomic models, yielding in the end an accuracy = 82% in the validation set ( ).
Prediction of extraprostatic extension
Extraprostatic extension (EPE) after RP is associated with BCR and increased risk of death from PCa. At present, about 20%–30% of EPE cases are understaged in clinical settings. Accurately predicting the risk of EPE before surgery would affect treatment decision, potentially ameliorating the prognosis. Ma and colleagues were the first addressing this topic in 2019 ( ). They developed a radiomics signature based on T2-weighted MR images for the detection of EPE and compared it to the performance of three experienced radiologists. Using histopathological data collected after RP as ground truth, they reported that the AUC of the radiomics based classifier in predicting EPE (AUC = 0.88) was significantly better than the AUC of all experts (mean AUC = 0.66) ( P < .05). The same group, 1 year later, proved that radiomics-based classifiers could also detect side specific EPE with an AUC 0.82 in the test set ( ). Losnegard and colleagues not only compared the performance of a hand-crafted radiomics-based model to that of a routine radiological interpretation, but they also considered the Memorial Sloan Kattering Cancer Center nomogram in their investigation ( ). This clinical nomogram performed the worst predictions of EPE (AUC = 0.67), while the performance of the radiomics based classifier and that of the radiologist were similar (AUC = 0.75). Moreover, they also combined information from all the inspected models, creating a classifier that provided the highest AUC = 0.80 for the identification of EPE. The contribution of PET-based radiomics has not been investigated yet, perhaps due to the low spatial resolution characterizing this imaging modality.
Metastases detection and prediction
The presence of distant metastases and LN involvement are two of the most relevant prognostic factors in PCa. Automatic identification of PSMA avid regions, and their classification into physiological and malignant uptake would save physicians a tremendous amount of time, while also being more objective compared to the evaluating clinician. Moazemi and colleagues were the first authors investigating the ability of PET radiomics for the detection of metastatic lesions in PCa ( ). They fed 40 RFs (including all types of RFs) extracted from all 68 Ga-PSMA PET avid lesions to five different machine learning classifiers, obtaining in the end a model that identified malignant uptake, both in LNs and distant areas, with AUC = 0.90. An accurate assessment of LN status is crucial before treatment planning, and for this reason Peeken and colleagues extracted RFs from LNs imaged with 68 Ga-PSMA PET and used them to discriminate between healthy and infiltrated LNs ( ). Their model yielded an AUC = 0.95 for the recognition of histology confirmed malignant LNs.
The preoperative identification of patients presenting risk for LN involvement and bone metastasis is essential for treatment planning. Unfortunately, commonly used clinical nomograms are inadequate for this purpose. Building on the promising results of radiomic analysis for the staging and characterization of PCa, researchers began to investigate the utility of radiomics for the prediction of distant metastases development. Both PyL PET ( ) and mp-MRI ( ; ) RFs extracted from the primary tumor have been explored, either alone or together with clinical risk factors, creating accurate nomograms (AUC up to ∼0.90) for the prediction of the risk for distant metastases and LNs infiltration.
Treatment monitoring
Radiotherapy is a well-established treatment for PCa, but it is associated with radiation-induced toxicity. The identification of those patients that are likely to benefit from RT, without experiencing serious adverse effects, is of paramount importance and constitutes a necessary step toward precision medicine. Wu et al. have investigated the performance of biparametric-MRI (T2-weighted and ADC maps) based morphological, first- and second-order RFs for the prediction of RT efficacy in 2019 ( ). They developed a classifier predicting responders to RT, defined as PSA level ≤0.5 after treatment, with AUC = 0.88. Furthermore, changes in RFs extracted from adjacent organs, like bladder, rectum, and urethra, may indicate radiation induced toxicity. This was shown in a pilot study by Tsang and colleagues, who reported that 2 RFs extracted from the urethra, namely contrast and homogeneity, represented pretreatment biomarkers for the risk of developing urethral stricture ( ). Similarly, Abdollahi et al., in 2019 identified subjects at risk for urinary toxicity, defined as urinary toxicity grade ≥ 2, with AUC = 0.75 ( ). Finally, both Lee ( ) and Lorenz ( ) reported that several MRI based RFs were altered by RT, potentially representing quantitative, easy to interpret, biomarkers quickly obtainable in standard practice. However, only two exploratory studies were performed on this topic so far, and the clinical significance of RFs has not been cleared yet. Future studies should replicate these findings and investigate the possible contribute of PET based radiomics, identifying the subset of robust RFs that characterize RT effects, and, at the same time, unraveling their clinical meaning.
Prediction of biochemical recurrence
Approximately 30% of patients treated with RP and 30%–50% of patients treated with RT develop BCR of PCa after definitive therapy. BCR, that is associated with an increased risk of developing metastases and death from PCa, is generally addressed with early salvage RT. The prompt identification of subjects at high risk for BCR allows to stratify those patients that would benefit the most from adjuvant RT from those that could avoid unnecessary treatments. Unfortunately, clinical nomograms used to date are inadequate to predict the risk for BCR. On the other hand, machine learning classifiers fed with mp-MRI RFs identify patients at risk for relapse with AUC > 0.70 ( ). Bourbonne and colleagues built a model based on only one single textural RF that was predictive of BCR after RP obtained from ADC maps ( ). The average AUC of this model was 0.80 in the training set and remained stable in the validation cohort AUC = 0.76. They also combined the radiomic model with clinical factors, but surprisingly this model underperformed yielding an AUC = 0.52 in the test set. The same authors further validated this radiomic model, using their entire sample to train the classifier and an external cohort ( N = 88) to assess its validity ( ). The model yielded very similar results also in the separate cohort, with AUC, sensitivity and specificity respectively equal to 0.76, 0.59, and 0.93. Furthermore, their classifier stratified patients with a hazard ratio (HR) = 5.5, P < .0001, and would have avoided unnecessary interventions in 16.4% of patients. The combination of hybrid 68 Ga-PSMA PET/MRI RFs, PSA, and clinical stage was investigated by Papp et al., in 2020, resulting in a model capable of predicting BCR prior to surgery with AUC = 0.90 ( ). However, this model has never been validated in an external cohort and therefore results are to be interpreted with great caution. Future studies, with test cohorts, will confirm whether this excellent performance holds in a general population.
The interest around the possible applications of radiomics to improve PCa care rose exponentially in the past few years. At present, the vast majority of the studies investigating this topic are based on mp-MRI, while the contribution of PET and PET/MRI based radiomics is yet to be established with certainty. However, the more and more frequent application of PET/MRI in clinical settings will inevitably result in an increased number of studies assessing the added value of PET/MRI based radiomics to improve the clinical management of PCa. To date, it is still unclear which subset of RFs is more informative, but higher-order RFs are by far the least investigated ones in PCa.
Artificial intelligence for attenuation correction in PET/MR images
A technical challenge for PET/MR imaging is how to best achieve attenuation correction (AC) ( ; ). When a photon travels in tissue, it interacts with it and it has a nonnegligible probability of being absorbed before reaching PET detectors. In water-like matter, the mean-free-path for the 511 keV photons of PET is of about 11 cm, therefore this effect is very noticeable in PET images, especially in the largest body regions (e.g., abdomen, pelvis). The attenuation encountered by the photons depends on the type of material encountered (e.g., bone attenuates more than soft tissue, that attenuates much more than lungs). The attenuation has an almost linear relation with the electron density present in a point; therefore, to perform AC a map of electron density is needed. In PET/CT, the CT scan provides a reliable estimate of the electron density ( ). In PET/MR, instead information about the electron density is not present in the MR signal, therefore surrogates must be used. Common solutions involve recognizing the type of tissue present in each pixel in dedicated MR sequences, and assigning to each tissue its tabular attenuation coefficient ( ). The task was found to be especially suitable for CNNs.
In this section, we will review how CNNs have been used to improve AC in PET/MR systems, implemented in “image-to-image translation” architecture. Different structures have been compared to improve performances, together with different training mechanisms. The importance of the input data will also be highlighted, on top of the algorithm processing it. Indeed, when giving in input to a CNN an MR image that does not contain information about the presence of bones that instead are in the field of view, the task of a CNN becomes learning where in an “average human” bones are located. On the contrary, when using state-of-the-art MR sequences that also provide information about bone location, such as ZeroTE or Ultrashort TE, the task becomes the simpler and more robust one of translating information that are already present in a different form. Different inputs have been compared by various groups: diagnostic MR sequences, Water-Fat MR images, and ZeroTE/Ultrashort TE. Also, the networks have been used to predict both a virtual CT image, often referred to as “Pseudo CT,” or directly the photons attenuation map at 511 keV. Also, different kind of training strategies and network structures might be used, with the most common being discriminative networks (e.g., U-net) or generative ones (e.g., Generative Adversarial Networks (GAN)). It should be noted that such techniques are not necessarily recent. While the recent development has been extremely noticeable, the use of multi-layer perceptrons on small patches of pixels to correct for attenuation in transmission scans dates back to at least by 1996, as used in the work by Yu et al. ( ).
Types of convolutional neural networks
The task that a CNN have to perform to produce AC maps is defined as “image to image translation.” In each convolution layer, every output pixel is “informed” by an exponentially increasing number of pixels from the input image. This concept is referred to as “receptive field.” Together with downsampling, this allows inner layers of a CNN to have pixels that contain information interpreted with the context of the whole input image. Therefore, it is generally said that later/deeper layers have a more abstract representation ( ). As described in the introduction, a CNN starts from a very local representation and, by combining multiple layers, they achieve a more abstract representation. When performing image to image translation CNNs, both very abstract features (e.g., whether the input image is of a thorax or of a pelvis) and very fine local detail (e.g., pixel-level contour of the bones) should be combined together.
The most common way to achieve this is by using of a “U-Net” (see Fig. 15.3 ), which takes its name from its U-shaped architecture ( ). Its first part, called “Encoder,” is similar to the bottleneck of a standard classifier: subsequent convolution and downsampling layers achieve higher levels of abstraction. To reconstruct the desired image a mirrored structure is introduced: the “decoder,” where downsampling is replaced by upsampling. Also, to preserve features with high levels of spatial detail, concatenations between encoder and decoder layers at the same “resolution” are introduced, generally called “skip connections”