Radiosensitivity and Cell Age in the Mitotic Cycle
▪ THE CELL CYCLE
Mammalian cells propagate and proliferate by mitosis. When a cell divides, two progeny cells are produced, each of which carries a chromosome complement identical to that of the parent cell. After an interval of time has elapsed, each of the progeny may undergo a further division. The time between successive divisions is known as the mitotic cycle time or, as it is commonly called, the cell cycle time (TC).
If a population of dividing cells is observed with a conventional light microscope, the only event in the entire cell cycle that can be identified and distinguished is mitosis, or division itself. Just before the cell divides to form two progeny cells, the chromosomes (which are diffuse and scattered in the nucleus in the period between mitoses) condense into clearly distinguishable forms. In addition, in monolayer cultures of cells just before mitosis, the cells round up and become loosely attached to the surface of the culture vessel. This whole process of mitosis—in preparation for which the cell rounds up, the chromosome material condenses and the cell divides into two and then stretches out again and attaches to the surface of the culture vessel—lasts only about 1 hour. The remainder of the cell cycle, the interphase, occupies all of the intermitotic period. No events of interest can be identified with a conventional microscope during this time.
Because cell division is a cyclic phenomenon repeated in each generation of the cells, it is usual to represent it as a circle, as shown in Figure 4.1. The circumference of the circle represents the full mitotic cycle time for the cells (TC); the period of mitosis is represented by M. The remainder of the cell cycle can be further subdivided by using some marker of DNA synthesis. The original technique was autoradiography, introduced by Howard and Pelc in 1953.
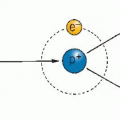
The basis of the technique, illustrated in Figure 4.2, is to feed the cells thymidine, a basic building block used for making DNA, which has been labeled with radioactive tritium (3H-TdR). Cells that are actively synthesizing new DNA as part of the process of replicating their chromosome complements incorporate the radioactive thymidine. Then the surplus radioactive thymidine is flushed from the system, the cells are fixed and stained so that they may be viewed easily, and the preparation of cells is coated with a very thin layer of nuclear (photographic) emulsion.
β-particles from cells that have incorporated radioactive thymidine pass through the nuclear emulsion and produce a latent image. When the emulsion is subsequently developed and fixed, the area through which a β-particle has passed appears as a black spot. It is then a comparatively simple matter to view the preparation of cells and to observe that some of the cells have black spots or “grains” over them, which indicates that they were actively synthesizing DNA at the time radioactive thymidine was made available. Other cells do not have any grains over their nuclei; this is interpreted to mean that the cells were not actively making DNA when the radioactive label was made available to them. Examples of labeled cells are shown in Figure 4.3. If the cells
are allowed to grow for some time after labeling with tritiated thymidine so that they move into mitosis before being fixed, stained, and autoradiographed, then a labeled mitotic cell may be observed (Fig. 4.3A).
are allowed to grow for some time after labeling with tritiated thymidine so that they move into mitosis before being fixed, stained, and autoradiographed, then a labeled mitotic cell may be observed (Fig. 4.3A).
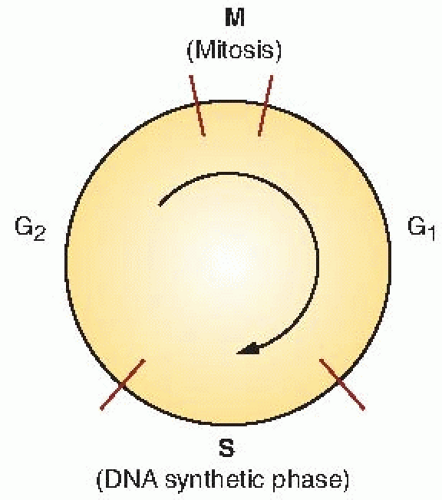 FIGURE 4.1 The stages of the mitotic cycle for actively growing mammalian cells. M, mitosis; S, DNA synthetic phase; G1 and G2, “gaps,” or periods of apparent inactivity between the major discernible events in the cycle. |
 FIGURE 4.2 Cell-labeling techniques. Top panels: The principle of autoradiography, which may be applied to cells in culture growing as a monolayer on a glass microscope slide or to thin sections cut from a tumor or normal tissue. Cells in the DNA synthetic phase (S) take up tritiated thymidine. After the cells are fixed and stained so that they are visible by light microscopy, they are covered with a layer of nuclear (photographic) emulsion and left for several weeks in a cool refrigerator. As β-particles from the tritiated thymidine pass through the emulsion, they form latent images that appear as black grains when the emulsion is subsequently developed and fixed. If cells are stained and autoradiographed immediately after incorporation of the tritiated thymidine, cells that are labeled are in S phase (top middle panel). If staining and autoradiography are delayed for 6 to 8 hours after the pulse label, some cells may move from S to M, and labeled mitotic cells are observed (top right panel). The lengths of the various phases of the cycle can be determined in this way. Bottom panels: The principle of cell cycle analysis using 5-bromodeoxyuridine as the DNA precursor instead of radioactively labeled thymidine. The bromodeoxyuridine is incorporated into cells in S. It can be recognized by the use of a Giemsa stain (which is purple) or a monoclonal antibody to bromodeoxyuridine-substituted DNA. The antibody is tagged with a fluorescing dye (e.g., fluorescein), which shows up bright green under a fluorescence microscope. If cells are stained immediately after labeling with bromodeoxyuridine, those staining darkly are in S phase (bottom middle panel). If staining is delayed for 6 to 8 hours, cells incorporating bromodeoxyuridine may move from S to M, and a darkly staining mitotic cell is seen (bottom right panel). (Courtesy of Dr. Charles Geard.) |
The use of tritiated thymidine to identify cells in the DNA synthetic phase (S) has been replaced largely by the use of 5-bromodeoxyuridine, which differs from thymidine only by the substitution of a bromine atom for a methyl group. If this halogenated pyrimidine is fed to the cells, it is incorporated into DNA in place of thymidine, and its presence can be detected by using an appropriate stain (see Fig. 4.3B). Cells that have incorporated bromodeoxyuridine appear darkly stained a bright purple color. To identify cells that are in S phase and have incorporated bromodeoxyuridine even more readily, one can use a fluorochrome-tagged
antibody against bromodeoxyuridine-substituted DNA, which fluoresces brightly under a fluorescence microscope. Examples of stained and unstained cells are shown in Figure 4.3B. If time is allowed between labeling with bromodeoxyuridine and staining, then a cell may move from S to M phase and a stained mitotic cell is observed (Fig. 4.3B). If the cell is in the first mitosis after bromodeoxyuridine incorporation, both chromatids of each chromosome are equally stained, as shown in the Figure 4.3B (upper left), but by the second mitosis, one chromatid is stained darker than the other (lower right in Fig 4.3B)
antibody against bromodeoxyuridine-substituted DNA, which fluoresces brightly under a fluorescence microscope. Examples of stained and unstained cells are shown in Figure 4.3B. If time is allowed between labeling with bromodeoxyuridine and staining, then a cell may move from S to M phase and a stained mitotic cell is observed (Fig. 4.3B). If the cell is in the first mitosis after bromodeoxyuridine incorporation, both chromatids of each chromosome are equally stained, as shown in the Figure 4.3B (upper left), but by the second mitosis, one chromatid is stained darker than the other (lower right in Fig 4.3B)
 FIGURE 4.3 A: Autoradiograph of Chinese hamster cells in culture flash-labeled with tritiated thymidine. The black grains over some cells indicate that they were synthesizing DNA when they were labeled. Also shown is a labeled mitotic cell. This cell was in S phase when the culture was flash-labeled but moved to M phase before it was stained and autoradiographed. B: Color photomicrograph showing cells labeled and unlabeled with bromodeoxyuridine. Cells were grown in the presence of bromodeoxyuridine and then fixed and stained 20 hours later. Incorporated bromodeoxyuridine stains purple. The purple-stained interphase cell (upper right) was in S phase during the time the bromodeoxyuridine was available. Also shown is a first-generation mitotic cell (upper left), which had been in S phase at the time the bromodeoxyuridine was available and had moved to M phase by the time it was fixed and stained. It can be identified as first generation because both chromatids of each chromosome are stained uniformly. A second-generation mitotic cell (lower right) passed through two S phases during bromodeoxyuridine availability. One chromatid of each chromosome is darker because both strands of the DNA double helix have incorporated bromodeoxyuridine. One chromatid is lighter because only one strand of the DNA has incorporated bromodeoxyuridine. (Courtesy of Dr. Charles Geard.) |
The use of bromodeoxyuridine has two advantages over conventional autoradiography using tritiated thymidine. First, it does not involve radioactive material. Second, it greatly shortens the time to produce a result because if cells are coated with emulsion to produce an autoradiograph, they must be stored in a refrigerator for about a month to allow β-particles from the incorporated tritium to produce a latent image in the emulsion.
By using either of these techniques, it can be shown that cells synthesize DNA only during a discrete well-defined fraction of the cycle, the S phase. There is an interval between mitosis and DNA synthesis in which no label is incorporated. This first “gap” in activity was named G1 by Howard and Pelc, and the nomenclature is used today. After DNA synthesis has been completed, there is a second gap before mitosis, G2.
All proliferating mammalian cells, whether in culture or growing normally in a tissue, have a cycle of mitosis (M), followed by G1, S, and G2, after which mitosis occurs again. The relative lengths of these various constituent parts of the cell cycle vary according to the particular cells studied. If cells stop progressing through the cycle (i.e., are arrested), they are said to be in G0 (see Fig. 4.4).
The characteristics of two cell lines commonly used for in vitro culture are summarized in Table 4.1. HeLa cells have a total cell cycle time of about 24 hours, which is more than double that of the Chinese hamster cell, which has a cell cycle time of about 11 hours. Mitosis lasts only a relatively short time, about 1 hour, and is not very different for those two cell lines or for most others. The S phase is 8 hours for HeLa cells and 6 hours for hamster cells; in all cell lines studied
in culture or growing in vivo, the S phase never exceeds about 15 hours. The G2 period is very similar in HeLa and hamster cells; in fact, the difference in the total cell cycle time between these two cell lines is accounted for almost entirely by the difference in the length of the G1 period.
in culture or growing in vivo, the S phase never exceeds about 15 hours. The G2 period is very similar in HeLa and hamster cells; in fact, the difference in the total cell cycle time between these two cell lines is accounted for almost entirely by the difference in the length of the G1 period.
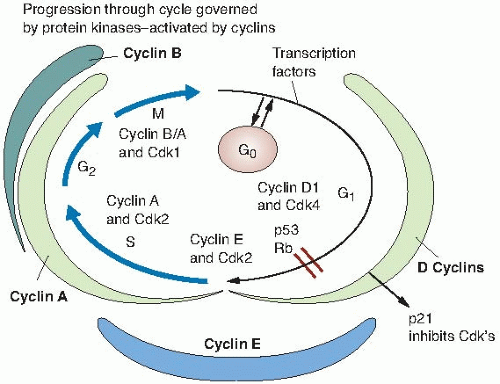 FIGURE 4.4 Update of the phases of the cell cycle, showing how they are regulated by the periodic activation of different members of the cyclin-dependent kinase family. Various cyclin-dependent kinase-cyclin complexes are required to phosphorylate several protein substrates, which drive key events, including the initiation of DNA replication and the onset of mitosis. |
This is an important point: The difference among mammalian cell cycle times in different circumstances, varying from about 10 hours for a hamster cell grown in culture to hundreds of hours for stem cells in some self-renewal tissues, is the result of a dramatic variation in the length of the G1 period. The remaining components of the cell cycle (M, S, and G2) vary comparatively little among different cells in different circumstances.
The description of the principal phases of the cell cycle (M, G1, S, and G2) dates from Howard and Pelc in 1953, as previously discussed. During a complete cell cycle, the cell must accurately replicate the DNA once during S phase and distribute an identical set of chromosomes equally to two progeny cells during M phase. In recent years, we have learned much more about the mechanisms by which the cycle is regulated in eukaryotic cells. Regulation occurs by the periodic activation of different members of the cyclin-dependent kinase (Cdk) family. In its active form, each Cdk is complexed with a particular cyclin. Different Cdk-cyclin complexes are required to phosphorylate several protein substrates that drive such cell cycle events as the initiation of DNA replication or the onset of mitosis. Cdk-cyclin complexes are also vital in preventing the initiation of a cell cycle event at the wrong time.
TABLE 4.1 Phases of the Cell Cycle for Two Commonly Used Cell Lines Cultured In Vitro | ||||||||||||||||||
|---|---|---|---|---|---|---|---|---|---|---|---|---|---|---|---|---|---|---|
|
Extensive regulation of Cdk-cyclin activity by several transcriptional and posttranscriptional mechanisms ensures perfect timing and coordination of cell cycle events. The Cdk catalytic subunit by itself is inactive, requiring association with a cyclin subunit and phosphorylation of a key threonine residue to become fully active. The Cdk-cyclin complex is reversibly inactivated either by phosphorylation on a tyrosine residue located in the adenosine triphosphate-binding domain, or by association with Cdk inhibitory proteins. After the completion of the cell cycle transition, the complex is inactivated irreversibly by ubiquitinmediated degradation of the cyclin subunit.
Entry into S phase is controlled by Cdks that are sequentially regulated by cyclins D, E, and A.
D-type cyclins act as growth factor sensors, with their expression depending more on the extracellular cues than on the cell’s position in the cycle. Mitogenic stimulation governs both their synthesis and complex formation with Cdk4 and Cdk6, and catalytic activity of the assembled complexes persists through the cycle as long as mitogenic stimulation continues. Cyclin E expression in proliferating cells is normally periodic and maximal at the G1/S transition, and throughout this interval, it enters into active complexes with its catalytic partner, Cdk2. Figure 4.4 illustrates this view of the cell cycle and its regulation. This is, in essence, an update of Figure 4.1


D-type cyclins act as growth factor sensors, with their expression depending more on the extracellular cues than on the cell’s position in the cycle. Mitogenic stimulation governs both their synthesis and complex formation with Cdk4 and Cdk6, and catalytic activity of the assembled complexes persists through the cycle as long as mitogenic stimulation continues. Cyclin E expression in proliferating cells is normally periodic and maximal at the G1/S transition, and throughout this interval, it enters into active complexes with its catalytic partner, Cdk2. Figure 4.4 illustrates this view of the cell cycle and its regulation. This is, in essence, an update of Figure 4.1
Related posts:

Stay updated, free articles. Join our Telegram channel
Full access? Get Clinical Tree
