Fig. 18.1
2D AOD Scanning Microscope. (a) Angular deflection (Ө) of a collimated laser beam by a single AOD with a fixed frequency (f) acoustic wave. (b) Fast scanning microscope employing two orthogonal AODs for two-dimensional random-access scanning

(18.1)
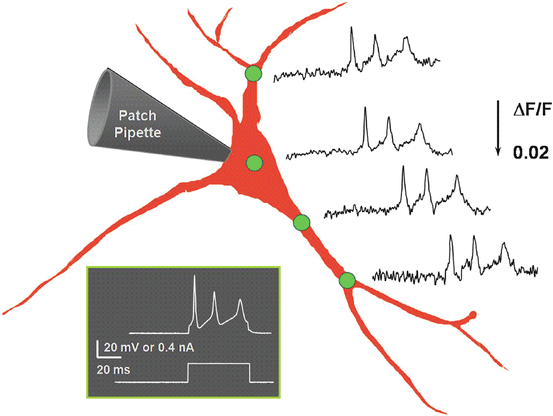
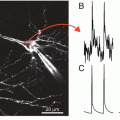
Fig. 18.2
Fast voltage imaging with AOD scanning microscope. Concurrent multi-site recording of action potentials, induced by current injection into soma, propagating into dendrites. Hippocampal neuron in dissociated low-density culture, stained with 100 μM VSD di-8-ANEPPS. Single-photon excitation at 514 nm, no averaging applied. Modified from Saggau et al. (1998)
In addition to lateral scanning, it is also possible to utilize AODs to create either an axial or even a 3D random-access scan (Reddy and Saggau 2005). In this scheme (see Fig. 18.3a, b) two AODs are used per dimension, with their sound waves propagating in opposite directions. The frequencies of these sound waves are equally chirped, i.e. changed over time, resulting in a linearly modulated diffraction grating. When this is done, the angle of deflection θ(x) is dependent upon position (x) within the crystal and can be described by Eq. (18.2) for a purely axial random-access scan and Eq. (18.3) for a complete 3D random-access scan.
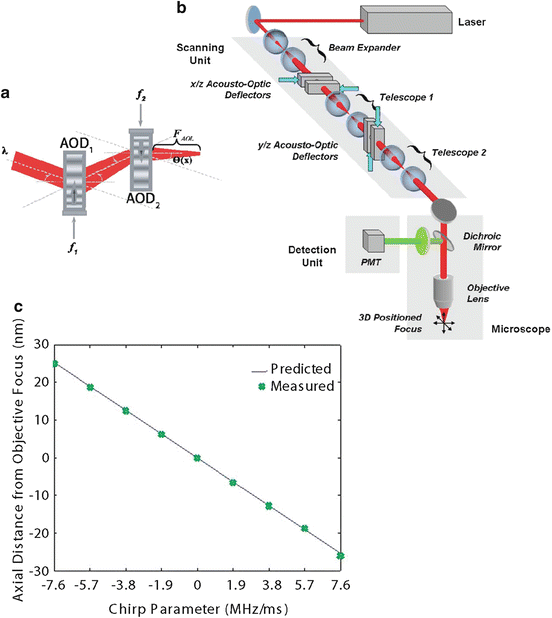


The new variable α in these equations is the chirp parameter and defines the rate of change in frequency. It can be seen that both the right hand side of Eq. (18.2) and the first part of the right hand side of Eq. (18.3), are position (x) dependent. In fact, the specific relationship between the angle of deflection and position is identical to that of a cylindrical lens, with a focal length of  . As shown in Fig. 18.3c, which compares the measured axial focal distances of an AOD-based microscope with those predicted by modeling the AOD scanner as a lens, this value for the focal length of the AOD system, f AOL , strongly agrees with experiment. The second part of the right hand side of Eq. (18.3) is similar to Eq. (18.1) and defines a position independent lateral deflection angle that is proportional to the difference in acoustic frequencies between the deflectors. Note that by eliminating the difference between the frequencies in the deflectors (i.e, making Δf = 0), we can reduce Eq. (18.3) to Eq. (18.2), completely eliminating the lateral scan. Thus the lateral scan is dependent upon the absolute difference in acoustic frequencies between the two deflectors, and the axial scan is dependent upon the rate of change in acoustic frequency. Both parameters are independent and user-definable through the control over the acoustic waves.

Fig. 18.3
3D AOD Scanning Microscope. (a) Change in collimation (focal length FAOL) and angular deflection (Ө(x)) by counter-propagating chirped acoustic waves (f1, f2) in a pair of AODs. (b) Two orthogonal pairs of AODs support random-access scanning within a volume. (c) Predicted (solid line) and measured (crosses) axial distance of the focal position from the inherent focal plane of the objective lens

(18.2)

(18.3)
 . As shown in Fig. 18.3c, which compares the measured axial focal distances of an AOD-based microscope with those predicted by modeling the AOD scanner as a lens, this value for the focal length of the AOD system, f AOL , strongly agrees with experiment. The second part of the right hand side of Eq. (18.3) is similar to Eq. (18.1) and defines a position independent lateral deflection angle that is proportional to the difference in acoustic frequencies between the deflectors. Note that by eliminating the difference between the frequencies in the deflectors (i.e, making Δf = 0), we can reduce Eq. (18.3) to Eq. (18.2), completely eliminating the lateral scan. Thus the lateral scan is dependent upon the absolute difference in acoustic frequencies between the two deflectors, and the axial scan is dependent upon the rate of change in acoustic frequency. Both parameters are independent and user-definable through the control over the acoustic waves.
It is important to note that all of the above equations are time-independent. This is a necessary condition for the random-access capabilities, since a time-dependent term would enforce a fixed pattern to the scan. However, if the random-access scan requirements and the S/N-improving advantage of increased dwell time are dropped, then time independence is not a requirement for 3D scanning. Indeed, a chirped acoustic wave in a single deflector can be used to create a cylindrical lens effect as well as a continuously changing deflection angle (Vucinic and Sejnowski 2007).
3 Multiphoton Random-Access Microscopy
As mentioned above, an AOD-based beam scanner has previously been combined with a custom light microscope and fluorescent optical indicators to study both voltage and calcium transients in neuronal cultures (Bullen et al. 1997; Bullen and Saggau 1998). However, although optically ideal, such preparations do not represent in vivo environments since they do not contain the 3D architecture of the neural tissue. Therefore, when studying realistic preparations, such as a brain slice or even intact cortex, optical sectioning techniques such as confocal laser scanning microscopy (CLSM) or multiphoton microscopy are essential.
However, the application of random-access beam scanning using AODs in either CLSM or multiphoton microscopy requires additional challenges to be addressed. In CLSM for example, a separate random-access method must be used for spatial filtering of the collected fluorescence, since attempting to de-scan the collected fluorescence via the AODs would result in significant signal loss secondary to the limited diffraction efficiency of the deflectors (Bansal et al. 2006). AOD-based multiphoton microscopy does not share this limitation, since no de-scanning of the fluorescent signal is necessary; however, it creates three distinct technical challenges: spatial dispersion, temporal dispersion, and power loss.
3.1 Spatial Dispersion
This type of dispersion is a result of the fact that ultrafast laser pulses are utilized in multiphoton microscopes to achieve the high photon flux required for useful multiphoton excitation. These laser pulses have durations of hundreds of femtoseconds and consequently significantly larger frequency (and thus wavelength) bandwidths compared to standard continuous wave (CW) emission. As a result, the standard equation for angle of deflection in an AOD is changed from a single angle θ in Eq. (18.1) to a range of angles Δθ in Eq. (18.4) below

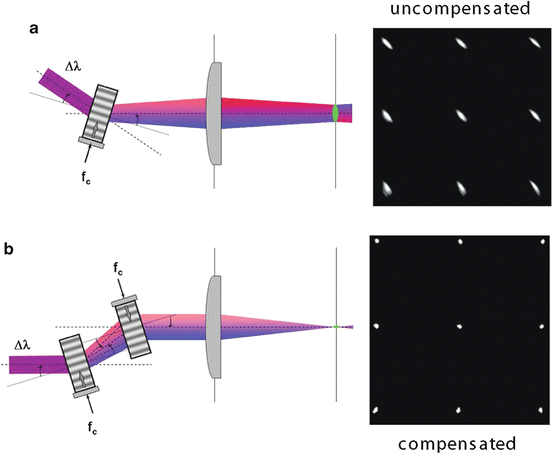
As can be seen in Fig. 18.4a, this results in a diverging beam at the output of the AOD. If left uncorrected, this would drastically reduce the spatial resolution, since the spot size at the object plane would be much larger than the diffraction limit.

(18.4)

Fig. 18.4
Spatial dispersion and compensation. (a) Frequency components (bandwidth Δλ) of ultrafast pulses are spectrally separated by an AOD. Uncompensated spatial dispersion in a 2D imaging system results in focal spots elongated along the 45° axis (3 × 3scan pattern). (b) Compensation of spatial dispersion by second parallel AOD operated with counter-propagating sound wave. Compensated scan pattern showing resulting spot sizes
To deal with this issue, several methods have been developed to minimize the amount of spatial dispersion. The simplest method has been to use longer temporal pulsewidths (Iyer et al. 2006), which reduces the Δλ term in Eq. (18.4). Other methods minimize the total amount of spatial dispersion by introducing a degree of spatial dispersion in the opposite direction using a dispersive element such as a diffraction grating (Iyer et al. 2003; Salome et al. 2006), a prism (Bi et al. 2006; Lechleiter et al. 2002; Zeng et al. 2006), or an additional AOD (Fig. 18.4b) (Iyer et al. 2003; Salome et al. 2006). Effectively, these methods mimic reducing the absolute value of the frequency term (f) in Eq. (18.4), while maintaining similar values for the range of frequencies (thereby keeping the same scan range). The 3D AOD-based-scanning method inherently compensates for spatial resolution by a similar method. Indeed as can be seen by comparing Eq. (18.3) with Eq. (18.2), the lateral deflection angle (and hence the amount of spatial dispersion) in this method is determined by the difference in acoustic frequencies between the two deflectors, which is optimally zero at the center. However, even at the largest scan angles, the maximum amount of spatial dispersion in the 3D method is proportional to the acoustic frequency bandwidth of the deflector, which for practical reasons is significantly smaller than the absolute value of the acoustic frequencies used in each deflector. Indeed, it has been shown that the reduction in spatial dispersion in 3D AOD scanning (Reddy and Saggau 2005) is at least a factor of 3 over the best uncompensated single AOD situation.
3.2 Temporal Dispersion
This dispersion, which is another major challenge of combining AOD-based scanning with multiphoton microscopy, is a consequence of the dependence of the refractive index of the material in each deflector on the frequency of light. Most material exhibit what is known as normal dispersion in the visible and near infrared frequency ranges, wherein the refractive index increases with increasing optical frequency. As a consequence, at higher optical frequencies, light has a higher refractive index. Thus, when an ultrafast optical pulse travels through a normal dispersive material, the red portion of the pulse spectrum will travel faster than the blue portion, which in turn will lead to increased pulse duration. Since the optical pulse now has a linearly changing optical frequency relationship in time, it is referred to as optically “chirped” (not to be confused with the acoustic “chirp” needed for 3D scanning).
A method of characterizing the degree to which a pulse will be broadened by a given material is through the amount of accumulated second-order phase, which is commonly known as the group delay dispersion (GDD) of the material. This value can be normalized for the length of the material, in which case, it is called the group velocity dispersion (GVD). Mathematically, this value can be expressed as Eq. (18.5)

where φ (ω), the phase of the light wave with respect to the angular frequency (ω), is equivalent to  , λ is the wavelength, L is the total distance traveled through the material, n is the refractive index of the material, and c is the speed of light in a vacuum. Note that since the wave vector k is just the accumulated phase per unit length (i.e.,
  ), the GVD can also be expressed as the second derivative of the wavevector with respect to the angular frequency or
  , or, since the first derivative of the wavevector with respect to the angular frequency is the inverse of the group velocity (i.e.,
  ), as
), as  .
.

(18.5)
 , λ is the wavelength, L is the total distance traveled through the material, n is the refractive index of the material, and c is the speed of light in a vacuum. Note that since the wave vector k is just the accumulated phase per unit length (i.e.,
  ), the GVD can also be expressed as the second derivative of the wavevector with respect to the angular frequency or
  , or, since the first derivative of the wavevector with respect to the angular frequency is the inverse of the group velocity (i.e.,
  ), as
), as  .
.The wavelength dependent value of the refractive index can be determined from the empirically derived Sellmeier equations (Weber 1986) for the transparent materials often used for AOD fabrication. These in turn can be used to calculate the amount of GVD introduced by the acousto-optic medium. Assuming a Gaussian pulse envelope, the output pulsewidth (τout) after the dispersion by the AODs can be calculated using Eq. (18.6)


