Fig. 4.1
Schematics of rapid kV switching dual-energy CT (DECT) imaging (a) and single-energy CT (SECT) imaging (b) on a GE CT750 HD scanner. In a DECT scan, projections are acquired at 140 kV (orange solid line) and 80 kV (green dashed like) alternatively at every 0.2 milliseconds. By contrast, projections are acquired at 140 kV (or lower kV) only throughout the entire SECT scan (Reprinted with permission from JACC Cardiovascular Imaging)
Fig. 4.2
X-ray tube voltage waveform for the rapid kV switching DECT acquisition protocol (blue solid line) in comparison with that for the SECT acquisition protocol (red dotted line). The number of view in a DECT scan (~2,000) doubles that of a SECT scan (~1,000) albeit a comparable radiation exposure time. This is achieved by employing a shorter view time in the DECT protocol with a slightly longer time allocated to each 80 kV view (c, ~60 % of a SECT view in a) to compensate for the higher noise than in each 140 kV view (b ~40 % of a SECT view)
X-ray Solid-State Scintillating Detector
To combat the spectral contamination issue associated with fast kV switching acquisition, the GE Healthcare CT750 HD scanner and the newer Revolution scanner employ a new gemstone material for x-ray detectors which is the first of its kind in the past two decades. The new solid-state detector is made of garnet crystalline and rare earth phosphor compositions which have superior optical properties (faster primary speed and shorter afterglow) compared to the commonly used solid-state detectors (e.g. cadmium tungstate and gadolinium oxysulfide) [26, 27] to minimize crosstalk between successive spectral measurements. Incident x-ray photons undergo photoelectric absorption upon striking a solid-state scintillating detector and the emitted photoelectrons travel a short distance in the scintillator before exciting the electrons in nearby atoms to emit characteristic radiations. Primary speed is to the time required for the exciting electrons to return the ground state, which is related to the atom’s electronic configuration [28]. A small amount of excited electrons remains at higher energy states for a longer period of time before returning to the ground states due to the impurities in the scintillating crystal. Afterglow (persistence) is the measure of this prolonged decay time [29]. As such, primary speed and afterglow determine the detector’s ability to differentiate successive signals from rapid acquisitions, and the fact that the new gemstone scintillator has a ultrafast primary speed (0.03 μs which is 100 times faster than the commonly used gadolinium oxysulfide Gd2O2S) and low degree of afterglow (25 % lower than Gd2O2S) [30] are crucial for minimizing the contamination between the high and low kV scan data acquired in successive views that are less than 0.5 ms apart.
Data Acquisition System (DAS)
The data acquisition system (DAS) in a CT scanner converts analog detector signals into digital ones. Therefore, the quality of signal output is also dependent on the performance of DAS in addition to that of the detector. The DAS must be reset after each sampling period to minimize the signal crosstalk between successive samplings [31]. A high-speed DAS system is incorporated in the GE’s CT750 HD and Revolution systems to handle the extremely fast dual-energy acquisitions (<0.5 ms per view). The measured projection in each view represents the summed photon flux over the sampling period, and by changing the integration time in the DAS system dynamically on a view-to-view basis, additional time can be allocated to the 80 kV acquisition to achieve a better flux balance (coupled with extending the low kV exposure time during acquisition as discussed above) and reduce errors in projection-based material decomposition. Furthermore, the DAS signal output contains both x-ray quantum noise and electronic noise arising from dark current in the photodiodes and other electronic components in the system which can result in severe image artifacts. The new Revolution CT system incorporates a novel DAS technology (Volara, GE Healthcare) to reduce the effect of electronic noise in the measured projections. The correction of quantum noise in the measured projections can be achieved with statistical iterative reconstruction (ASIR, GE Healthcare) [32] and will be discussed in the later part of the chapter.
Image Reconstruction
Material Density Images
The x-ray attenuation property of a material within the diagnostic x-ray energy range is determined by a linear combination of photoelectric effect and incoherent Compton scattering, both of which are dependent on the incident x-ray photon energies [33]. Mathematically, we can express the attenuation coefficient of a unit mass of material in terms of these x-ray interactions:
where μ is the linear attenuation coefficient of the material at energy E and ρ is the material’s density which is energy independent; fp and fc are the functions describing the photoelectric effect and Compton scattering with αp and αc the coefficients representing their contributions. Alternatively, the physical interactions in Eq. 4.1 can be represented by two basis materials that are sufficiently different in their atomic numbers so as their x-ray interaction properties:
where σA and σB are coefficients describing the contributions of material A and B respectively. A common choice for the basis material pair is water and iodine. It can be shown that [34]:
 and
and
where αA,p and αA,c are the contributions of photoelectric and Compton effects for material A respectively. Similarly, αB,p and αB,c and the contributions of the same physical phenomena for material B respectively. Equation 4.2 can be rewritten as follow:
Here, σAρ and σBρ are the equivalent densities (in gram per cm3) of the basis materials A and B respectively. The line integral over the linear attenuation coefficient in ray path  can be expressed as:
DA and DB are the line integrals of the equivalent densities (also called the area densities) of materials A and B respectively in gram per cm2. In dual-energy acquisition, projection at each view is measured at two different energy spectra yielding two non-linear equations per ray path:
![$$ {P}_L=- \ln {\left(\frac{I}{I_o}\right)}_L=- \ln \left\{{\displaystyle \int }{\varOmega}_L(E){e}^{-\left[{D}_A\cdot {\left(\frac{\mu }{\rho}\right)}_A(E)+{D}_B\cdot {\left(\frac{\mu }{\rho}\right)}_B(E)\right]}dE/{\displaystyle \int }{\varOmega}_L(E)dE\right\} $$](/wp-content/uploads/2016/09/A320855_1_En_4_Chapter_Equb.gif) and
and
![$$ {P}_H=- \ln {\left(\frac{I}{I_o}\right)}_H=- \ln \left\{{\displaystyle \int }{\varOmega}_H(E){e}^{-\left[{D}_A\cdot {\left(\frac{\mu }{\rho}\right)}_A(E)+{D}_B\cdot {\left(\frac{\mu }{\rho}\right)}_B(E)\right]}dE/{\displaystyle \int }{\varOmega}_H(E)dE\right\} $$](/wp-content/uploads/2016/09/A320855_1_En_4_Chapter_Equ6.gif)
the subscripts L and H represent the low and high energy spectra, P is the measured projection, I and Io are the transmitted and incident x-ray intensities, and Ω (E) is the incident x-ray energy spectrum, respectively. The area under Ω(E) equals unity and hence the denominators on the right-hand side of the above equations equals one. While the mass attenuation coefficients of the basis materials A (water) and B (iodine) at energy E are readily available in standard NIST (National Institute of Standards and Technology) table [35], the unknown quantities in Eq. 4.6 are the two equivalent densities of the basis materials which can be approximately estimated using polynomial expansions:
 and
and
where β, γ, δ, ε, ψ are the polynomial coefficients. The non-linear terms in Eq. 4.7 are essential to account for the beam hardening effects. Equation 4.6 essentially transforms a pair of attenuation measurements into two pairs of density projections with correction of beam hardening [23] (Fig. 4.3). The reconstructed images represent the equivalent densities of the basis materials in g/cm3 instead of the conventional linear attenuation coefficients in cm−1. It should be emphasized that material decomposition does not identify the actual compositions in an image voxel but merely estimates the amount of each selected basis material required to produce the measured low and high kV attenuations in that voxel. If we select water and iodine as the material bases, any material other than water and iodine will be represented in both the ‘water-equivalent’ and ‘iodine-equivalent’ images (Fig. 4.4).
(4.1)
(4.2)
(4.3)
(4.4)
can be expressed as:(4.5)
(4.6)
(4.7)
Fig. 4.3
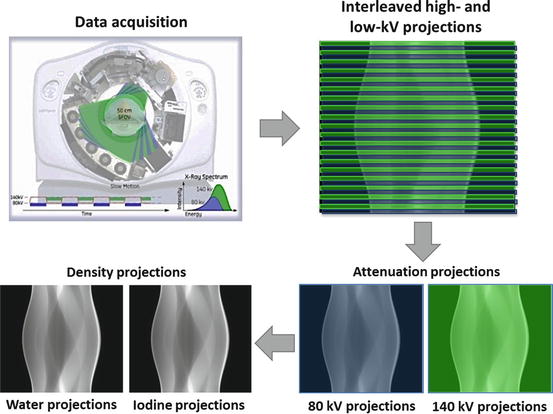
Rapid kV switching DECT acquisition results in interleaved low- and high-kV views in the sinogram. These views are sorted into a low- and a high- kV sinogram before undergoing a non-linear transformation to a pair of material (water and iodine) density sinograms
Fig. 4.4
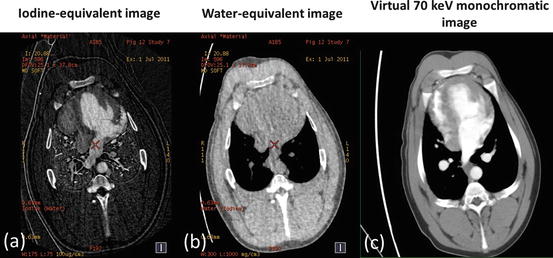
Iodine- (a) and water- (b) equivalent density images (in units of mg/ml) of a porcine chest at peak contrast enhancement in the left ventricle acquired with the rapid kV switching DECT protocol. The corresponding virtual 70 keV monochromatic image (c) was generated from a linear combination of the water and iodine images
Virtual Monochromatic Images
In addition to material density images, virtual monochromatic images can also be generated from the same set of dual-energy scan data. Virtual monochromatic images depicts how the scanned object will appear if a monochromatic x-ray beam (in kiloelectron volt, keV) is used for scanning. In monochromatic imaging at a specific x-ray energy Eo, integration over the entire energy spectrum in Eq. 4.6 is not required and the equation can be simplified as:
The above equation indicates that we can derive a set of monochromatic projections from the equivalent density projections and mass attenuation coefficients of the basis materials, from which virtual monochromatic images can be reconstructed with a standard tomographic reconstruction algorithm. Alternatively, virtual monochromatic images can be generated from a simple linear operation of the material density images that are generated from the material decomposition process discussed above. In this process, the attenuation value of any material is normalized to that of water as in standard CT images:
If water and iodine are selected as the material bases, then μA(E) = μW(E) and the above equation is simplified to:
where σWρ and σIρ are the ‘water-equivalent’ and ‘iodine-equivalent’ images [36]. Given the known linear attenuation coefficient values of water and iodine over the diagnostic energy range (~40 to 140 keV), virtual monochromatic images (displayed in Hounsfield Unit) can be readily generated with proprietary software (e.g. GE Healthcare’s GSI viewer) (Figs. 4.4 and 4.5). Virtual monochromatic imaging has several useful clinical applications, especially for beam hardening correction in CT myocardial perfusion imaging. When polychromatic x-rays transverse through the scanned object, the x-ray photons with lower energies are preferentially removed first due to photoelectric absorption and the effective energy of the x-ray beam increases (the beam is ‘hardened’) [37]. In myocardial perfusion imaging, the presence of iodinated contrast agent in the heart chambers leads to inconsistent x-ray attenuation (hence x-ray effective energies) among different ray paths which results in errors in image reconstruction. Virtual monochromatic images of the heart with minimal beam hardening can therefore facilitate a more accurate qualitative and quantitative assessment of regional myocardial perfusion with CT [20, 38–40] (Fig. 4.6).
(4.8)
(4.9)
(4.10)
Fig. 4.5


Virtual monochromatic cardiac images at various keV levels (a–e) generated from the GSI Viewer (GE Healthcare) in comparison with the conventional 140 kV image (f) generated from the CT750 HD scanner console with the high-kV sinogram illustrated in Fig. 4.3
Related posts:

Stay updated, free articles. Join our Telegram channel
Full access? Get Clinical Tree
