Thoracic applications of dual-energy CT
Pulmonary perfusion imaging
Pulmonary ventilation imaging
Oncologic chest imaging
Lung nodule characterization
Lung cancer staging
Assessment of therapy response
Optimization of image contrast
Monoenergetic extrapolation
Non-linear blending techniques
Lung Perfusion Imaging
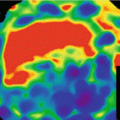
Dual-energy CT pulmonary angiography (DE-CTPA) can be used to generate iodine distribution maps of pulmonary parenchyma (Fig. 7.1) [1–6] which correspond well with pulmonary perfusion on scintigraphy [7] and SPECT [8] images. The technique has recently been validated against true dynamic CT measurements of pulmonary perfusion in a large animal model [9]. The main application of dual-energy lung perfusion imaging has been the diagnosis and assessment of pulmonary embolism, but it has also been applied to chronic-thromboembolic pulmonary hypertension [10, 11], pulmonary emphysema [3], pulmonary artery agenesis [12] and Takayasu’s arteritis involving the pulmonary arteries [13].
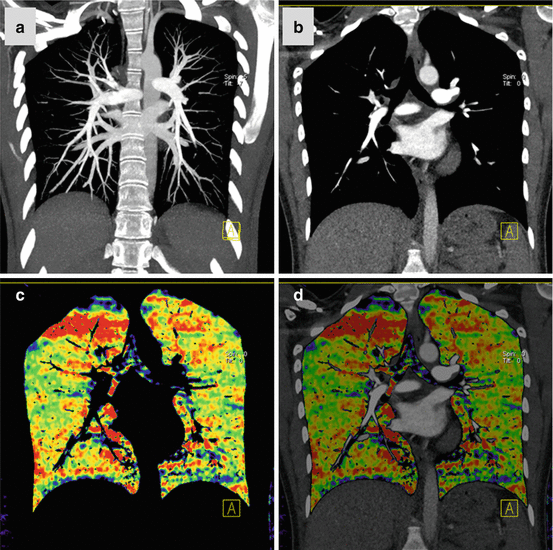
Fig. 7.1
Dual-energy CTPA in a 22 year old female patient with suspected PE. CTPA shown as coronal maximum intensity projection (a) and coronal reformat (b) demonstrates no evidence of pulmonary embolism. Homogeneous pulmonary perfusion is demonstrated by the iodine distribution map (c, d). Streak artifacts are present in the right upper lung zone of the iodine distribution maps due to concentrated contrast material in the superior vena cava
Acquisition Technique
Various acquisition parameters for DE-CTPA have been proposed in the literature. Dual-energy CTPA can be performed using both dual-source CT systems and rapid kilovoltage switching [14]. However, the vast majority of published studies on dual-energy CT lung perfusion imaging have been performed with dual-source CT systems. The optimal combination of spectra depends on the generation of CT system used. In first-generation dual-source CT and for systems with rapid kilovoltage switching, spectra of 80 and 140 kVp are used. With second-generation dual-source CT, a tin-filtered 140 kVp spectrum (Sn140 kVp) became available. The tin filter hardens the X-ray beam through absorption of low energy photons which decreases the spectral overlap between the two spectra. Consequently, the combination of 100 and Sn140 kVp is recommended for dual-energy chest CT with these systems. The third-generation dual-source CT system is expected to become commercially available in late 2014. This system will offer a Sn150 kVp high energy spectrum, which may further improve spectral differentiation. Recommendations for the specific acquisition parameters for each CT system have been published in the literature [14].
In regard to contrast injection protocols, either a test bolus or a bolus tracking technique can be used. A relatively long delay (5–7 s) is typically chosen to allow for the contrast material to travel from the central pulmonary arteries to the pulmonary capillary system. Depending on the concentration of contrast material used, the flow rate should be adjusted to target an iodine delivery rate of approximately 1.6 g I/s, which has been reported to result in optimal image quality for both conventional CTPA reconstructions and perfusion maps [4]. Streak artifacts from dense contrast material in the superior vena cava (Fig. 7.1) can compromise the quality and diagnostic accuracy of DECT perfusion maps. These artifacts can be minimized using a triphasic injection protocol in which the undiluted contrast is followed by 30 mL of a saline/contrast mixture followed by a 50 mL chaser of pure saline [15]. In addition, DE-CTPA should be acquired in the caudocranial direction to minimize residual dense contrast material in the superior vena cava. As with conventional CTPA, the interruption of the contrast bolus due to the inflow of unopacified blood from the inferior vena cava can render the examination non-diagnostic. However, this can be avoided by instructing the patient to avoid deep inspiration prior to the breath-hold [16].
Image Interpretation: Caveats and Pitfalls
When interpreting DECT iodine distribution (“perfusion”) maps, it is important to bear in mind that these are generated based on a single acquisition and thus represent the iodine distribution in the pulmonary capillary circulation at a single time point, which is used as a surrogate for pulmonary perfusion. Various technical and physiological parameters influence the iodine content within the pulmonary microcirculation visualized by DECT “perfusion” maps. Among technical parameters, the timing of the scan relative to the contrast bolus plays an important role [17]. In this context, one should also keep in mind that the acquisition is timed for optimal contrast enhancement of the pulmonary vasculature. DECT, therefore, primarily visualizes lung perfusion from the pulmonary circulation and neglects contributions from the systemic circulation, which can be substantial in the setting of specific pathologies. Pulmonary iodine content will further depend on the volume, delivery rate, and concentration of the contrast agent and inter-individual physiologic differences in circulatory physiology. It is also known that lung density physiologically decreases with age as a result of airspace dilatation and vessel rarefication [18]. Accordingly, iodine uptake of the pulmonary parenchyma on DECT perfusion maps has been shown to decrease substantially over the life span even in the absence of pathology [17].
In addition to considering these technical and physiological influences, the visual analysis of iodine distribution maps can occasionally be challenging and some experience is required to distinguish true perfusion defects from artifacts [19] and perfusion defects related to pulmonary embolism from defects caused by other vascular and non-vascular causes [20]. The visual analysis of DECT lung perfusion maps should always be performed in side-by-side correlation with an anatomical reconstruction series to closely match anatomical changes of the pulmonary parenchyma with alterations in the perfusion maps.
Clinical Applications for DECT Lung Perfusion Imaging
Acute Pulmonary Embolism
In pulmonary embolism, DECT iodine distribution maps typically demonstrate peripherally located, wedge-shaped perfusion defects with segmental or lobar distribution (Fig. 7.2) [14]. Data from animal models [21] suggest that DECT iodine distribution maps may improve the sensitivity of CT pulmonary angiography, in particular for peripheral subsegmental emboli, but this has not been conclusively demonstrated in clinical studies. It is not uncommon to encounter patients in whom one or more small peripheral perfusion defects with a pattern suggestive of embolic disease are present but no emboli are visualized on the corresponding anatomical CTPA reconstructions [22]. This scenario represents a clinical dilemma and there is currently no consensus on how to manage such cases [14]. However, it is generally felt that such perfusion defects – if an expert reader cannot explain them by artifacts or other pathology – represent true findings likely due to subsegmental emboli which are too small to be visualized anatomically. These examinations are typically reported to clinicians as suspicious for small, subsegmental emboli. In this context, it is debatable whether emboli that are too small to be anatomically detectable carry any significance for the patient. This broaches the intense, ongoing debate on overdiagnosis and overtreatment of pulmonary embolism [23]. Although a detailed account of this debate is beyond the scope of this book chapter, there are good reasons to question whether a further increase in sensitivity of CT for small subsegmental pulmonary emboli will translate into a true benefit rather than harm for the patient. Therefore, further clinical evaluation of DECT for suspected PE will likely focus not on increasing the detection rate but rather assessing the hemodynamic relevance of emboli. Such research may establish a role of DECT for the risk stratification of patients and the selection of the most appropriate management strategy.
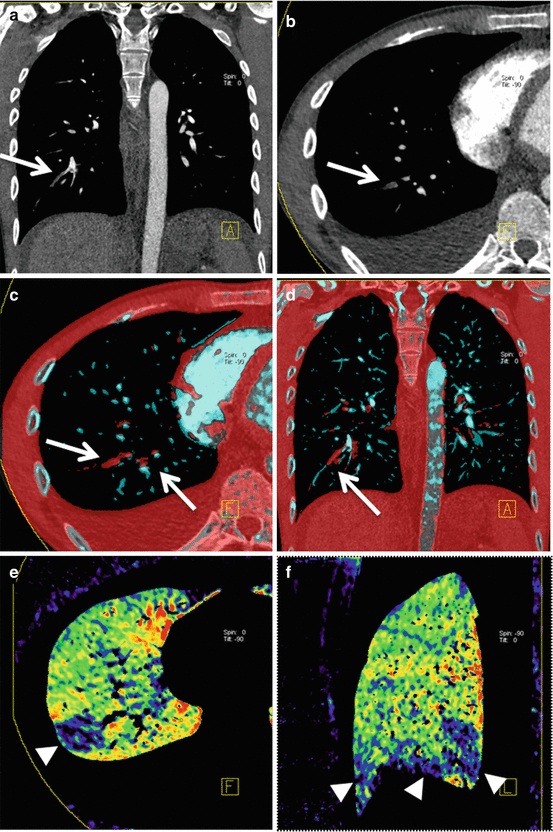
Fig. 7.2
Dual-energy CTPA in a 22 year old male patient with nephrotic syndrome and suspected PE. CTPA in coronal (a) and transverse (b) orientation demonstrates filling defects in segmental arteries of the right lower lobe (arrows). These emboli are readily visualized using dual-energy vascular analysis (arrows in c, d). The dual-energy iodine distribution maps (e, f) demonstrate corresponding perfusion defects in the right lower lobe (arrowheads)
In addition to visualizing the iodine content of the pulmonary parenchyma as a surrogate for pulmonary perfusion, DE-CTPA can also be used to visualize iodine content within the pulmonary vasculature thus increasing the conspicuity of emboli (Fig. 7.2). This approach has been demonstrated to improve the detection of peripheral pulmonary emboli [24].
Chronic Pulmonary Embolism/Chronic-Thromboembolic Pulmonary Hypertension
In chronic-thromboembolic pulmonary hypertension, the inhomogeneous distribution of pulmonary blood flow can frequently be detected as a mosaic attenuation pattern on standard single-energy CT images. However, the perfusion abnormalities are often more clear on DECT perfusion maps, which typically demonstrate peripheral, wedge-shaped perfusion defects (Fig. 7.3) [25, 26]. In this context it has been suggested that DECT may be of value for differentiating ground glass opacities of vascular cause from ground glass opacities caused by air space filling in infiltrative lung diseases [27]. Renard and colleagues further described an association between the severity of pulmonary arterial obstruction, the development of systemic collateral supply, and the perfusion impairment seen on DECT in chronic pulmonary embolism [28].
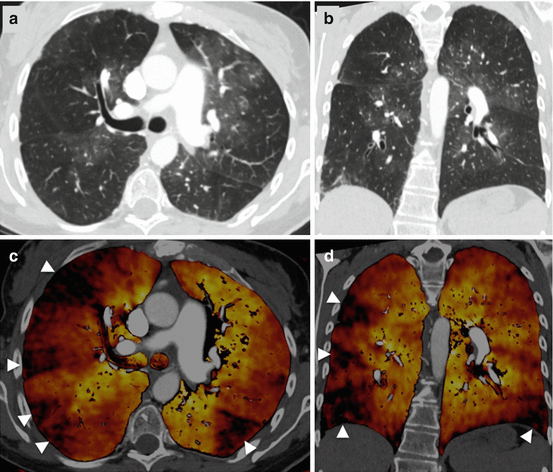
Fig. 7.3
Dual-energy CTPA in a patient with chronic-thromboembolic pulmonary hypertension. CTPA images in transverse (a) and coronal (b) orientation demonstrate a mosaic attenuation pattern. Dual-energy iodine distribution maps (c, d) demonstrate multiple peripheral wedge-shaped perfusion defects (arrowheads)
Pulmonary Emphysema
It has been demonstrated that DECT pulmonary perfusion maps in pulmonary emphysema moderately correlate with the severity and distribution of the anatomical destruction of lung parenchyma along with air trapping and reduced diffusion capacity as demonstrated by pulmonary function tests [3, 29]. These results suggest DECT pulmonary perfusion maps may aid severity assessment and phenotypical characterization of pulmonary emphysema (Fig. 7.4).
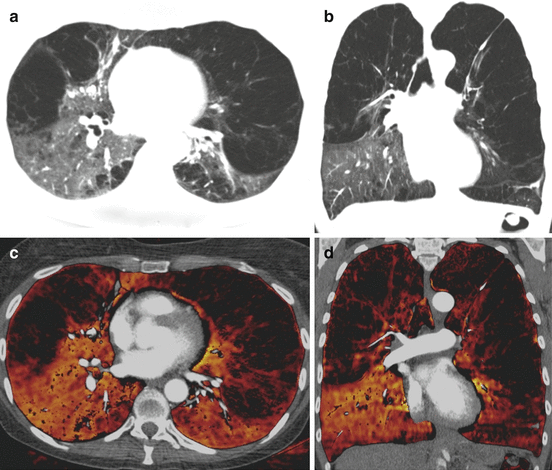
Fig. 7.4
Dual-energy CTPA in a patient with severe pulmonary emphysema with relative sparing of the right lower lobe. Anatomical images in transverse (a) and coronal (b) orientation demonstrate severe emphysematous destruction of the pulmonary parenchyma with relative sparing of the right lower lobe. Dual-energy iodine distribution maps (c, d) demonstrate the relative distribution of pulmonary perfusion in this patient
Lung Perfusion Quantification
Attempts have been made to use automated quantification of pulmonary perfused blood volume in DECT to assess the severity of pulmonary pathologies, acute pulmonary embolism [30–32], pulmonary emphysema [29], and chronic-thromboembolic pulmonary hypertension [33]. Initial studies have suggested the quantification of perfused blood volume or defect volume in DECT carries prognostic significance in patients with pulmonary embolism [31, 34, 35]. For pulmonary emphysema, it is known that lung volume reduction surgery in patients with upper lobe predominant emphysema improves outcome only if their perfusion to the upper lung is decreased on scintigraphy [36]. In this setting, DECT with automated quantification of pulmonary perfused blood volume could potentially obviate the need for an additional scintigraphy or SPECT in the preoperative assessment of surgical candidates [29].
Ventilation Imaging
Acquisition Technique
Xenon-enhanced ventilation CT is still an experimental technique and various acquisition protocols have been proposed in the literature [37]. The procedure requires careful patient preparation. Patients’ respiratory rate, oxygen saturation and blood pressure are monitored before, during and after the CT examination. In addition, the inspirational and expirational concentrations of Xenon are continuously monitored. Unless mechanically ventilated intensive care patients are imaged, patients need to be fitted with ventilation masks. In order to minimize the risk of respiratory difficulties, the patient initially inhales a high concentration of oxygen (>60 %) for approximately 2–3 min. Subsequently, a mixture of 30 % Xenon and 70 % oxygen is administered until the exhaled Xenon concentration reaches approximately 30 %, indicating Xenon saturation of normal lung areas. This wash-in phase typically lasts around 1–1.5 min. At this point, the patient returns to inhaling highly concentrated oxygen for a washout phase of approximately 2 min until the expiratory Xenon concentration approaches zero. The CT acquisition can be performed using dynamic or static protocols [37]. Dynamic acquisition protocols acquire images every 20–30 s during both the wash-in and the wash-out phase, thus, capturing true dynamic data on Xenon distribution. Due to the high radiation exposure, this approach should only be performed with limited anatomic coverage of a particular region of interest. Static acquisition protocols image the entire lung with only one acquisition (typically at the end of the wash-in phase) and thus capture the Xenon distribution at a single time point as a surrogate for pulmonary ventilation. Occasionally an additional non-enhanced acquisition is added.
Applications
Dual-energy ventilation CT can be performed using noble gases such as Xenon or Krypton as inhaled contrast agents. Xenon-enhanced DECT has been used to visualize pathologic ventilation patterns in various pulmonary diseases such as chronic obstructive pulmonary disease (COPD) [38], asthma [39–42], bronchiolitis obliterans [43], bronchial atresia [44, 45], and pulmonary embolism [46, 47], and in mechanically ventilated ICU patients [48, 49]. Combined ventilation/perfusion CT using intravenous iodine and inhaled Xenon as contrast agents is feasible and can demonstrate ventilation/perfusion mismatch in pulmonary embolism (Fig. 7.5) [46, 47].
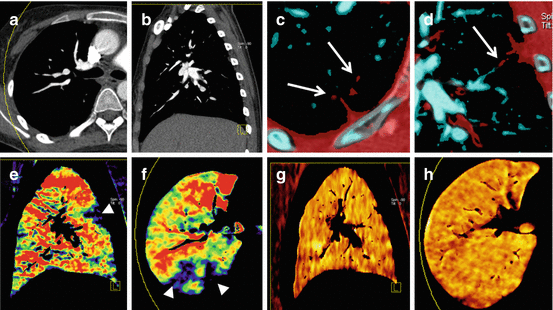
Fig. 7.5
Dual-energy CTPA in a 19-year old female patient with nephrotic syndrome and pulmonary embolism. Anatomical CTPA images in transverse (a) and sagittal (b) orientation fail to conclusively demonstrate pulmonary emboli. However, subsgemetal emboli are visualized using dual-energy vascular analysis (arrows in c, d). Dual-energy iodine distribution maps (e, f) demonstrate multiple peripheral perfusion defects (arrowheads). Xenon distribution maps (g, h) demonstrate homogeneous ventilation and thus mismatch of ventilation and perfusion findings
These studies have generally shown that pathological patterns observed on Xenon maps correlated well with findings on morphological CT images and pulmonary function tests. Data on the incremental value of Xenon-enhanced DECT over these modalities are scarce. The unique potential of ventilation CT is its ability to demonstrate the spatial distribution of pathologic ventilation patterns, which can easily be assessed by conventional CT or pulmonary function tests. In one study of intensive care patients with worsening respiratory function, Xenon distribution maps helped to detect an airway-to-pneumothorax fistula and, in a different patient, exclude a suspected airway-to-mediastinum fistula [49]. Xenon-enhanced DECT can further be used to assess the degree of collateral ventilation in patients with bronchial atresia or obstruction [37].
Despite promising research, Xenon-enhanced DECT has not been widely accepted in clinical routine, mostly because the procedure is technically challenging [50], and Xenon is expensive and not routinely available. In addition, Xenon can have side effects including respiratory depression in a small but significant proportion of subjects [5, 38, 43]. Therefore, some researchers have suggested using stable Krypton or a mixture of Xenon and Krypton as a potentially safer alternative for DECT lung ventilation imaging but experience with these agents is very limited [51, 52].
Lung Nodules and Thoracic Malignancies
Acquisition Technique
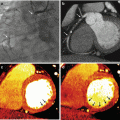
When applied to oncologic imaging, DECT of the thorax is typically performed similar to a conventional contrast-enhanced chest CT except the radiation dose is distributed over both tubes, operated at different photon energies. The examination is acquired in a delayed phase to ensure adequate contrast enhancement of lung nodules, masses or lymph nodes (Fig. 7.6). Of note, the enhancement of the pulmonary parenchyma is minimal in this phase and does not allow for an assessment of pulmonary perfusion. If an assessment of pulmonary perfusion is desired in patients with lung cancer, an additional DE-CTPA should be acquired as described above.
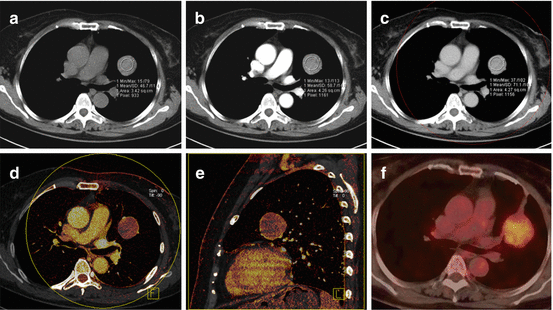
Fig. 7.6
Dual-energy CTPA in a 61-year old female patient with a sclerosing hemangioma in the left lung. The mass is shown on anatomical CTPA images in non-contrast (a), arterial (b) and venous phase (c). The perfusion of the mass is assessed using dual-energy iodine distribution analysis in the venous phase acquisition (d, e). The corresponding 18F-FDG-PET/CT image is shown in (f)
Applications
Characterization of Pulmonary Nodules
The assessment of pulmonary nodules represents a frequent challenge in clinical routine. The ability of DECT to visualize and quantify the iodine uptake of nodules may help to differentiate benign from malignant pulmonary nodules [53]. This has been assessed in initial studies with mixed results [53–55]. Virtual non-contrast reconstructions may be useful in differentiating iodine enhancement from calcifications in lung nodules without the need for an additional non-enhanced image acquisition (Fig. 7.7) [55].
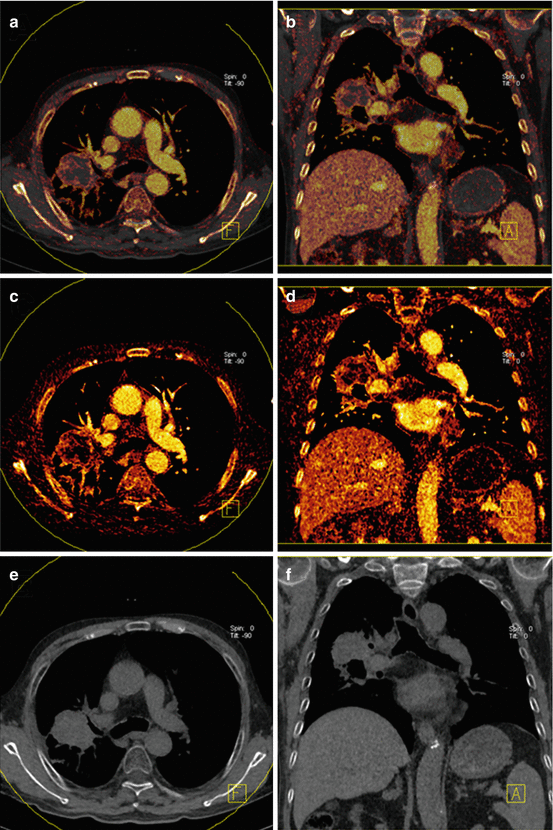
Fig. 7.7


Dual-energy CTPA in an 83 year old male patient with histologically proven lung cancer. Virtual non-contrast images with iodine overlay are shown in panels (a, b). The iodine images (c, d) demonstrate high peripheral perfusion of the tumor. Virtual non-contrast images (e, f) demonstrate absence of calcification in the mass
Related posts:

Stay updated, free articles. Join our Telegram channel
Full access? Get Clinical Tree
