Parameter
ssDECT
dsDECT
Single-energy CT
Tube voltage (kVp)
140/80
140/80 (<90 kg); 140/100 (>90 kg)
120 (default); 100 (arterial phase)
Tube current (mA)
600 mA (fixed)
Automated current modulation (CARE dose 4D)
Automated current modulation; 150–650 mA; reference max, 180–250 mA
Tube rotation (sec)
0.5; 0.6–0.8
0.5
0.5 (<90 kg); 0.6–0.8 (>90 kg)
Scanning mode
GSI (gemstone imaging)
Dual-energy
Helical
Detector collimation (mm)
0.625
0.6
0.6–1.25
FOV (CM)
50
26–33
50
Section thickness (mm)
5
5
5
Pitch
1.375
0.6
1.375
Iterative reconstruction
Yes
IRIS/SAFIRE
ASIR
Oncologic Applications of DECT
Lesion Detection
SE acquisition using low tube voltage (80–100 kVp) has been used to improve conspicuity of hyper vascular lesions, increasing their detection rate [1–4]. The use of lower kVp results in higher x-ray absorption of iodine from energies closer to the k-edge of iodine (33.2 keV). As a result, hypervascular lesions are more conspicuous and are more easily detected. One of the main concerns of a low-energy (80–100 kVp) acquisition in SECT, in spite of the better contrast resolution, is the increase in noise compared with a higher-energy (120 kVp) SECT acquisition [3, 4].
The lower energy (80 or 100 kVp) images from DECT acquisition can be used to improve contrast to noise ratio. Low energy VMC images (around 60–77 keV) have similar application to the low kVp (80–100 kVp) images, and because VMC images have reduced beam-hardening artifact, the image quality is better for evaluation of lesions in solid organs [5]. Therefore the use of low keV in oncologic CT can improve the lesion detection rate by improving the contrast between hypervascular lesions, hypovascular lesions and normally enhancing parenchyma (Table 8.2).
Table 8.2
Applications of dual energy CT in the abdomen
Lesion detection and characterization | |
|---|---|
Liver | Low-energy VMC images increase contrast between hypervascular lesions and liver parenchyma. These images also increase absolute attenuation differences between metastasis and background liver to depict small lesions |
Multiple material decomposition algorithms allow quantification of liver fibrosis and fat | |
Pancreas | Low-energy (50–52-keV) VMC images provide high CNR and improve delineation of iso- to hypoattenuating pancreatic masses |
Kidney | Enhancing and nonenhancing renal lesions can be differentiated using iodine-extracted image, improving characterization of renal masses and independently depict and quantify tissue enhancement, eliminating the need for TUE images; VUE images can successfully replace TUE images for evaluation of renal masses, reducing radiation dose and decreasing scanning time |
DECT differentiates composition of renal stones | |
Adrenal | Iodine images can depict and help quantify enhancement of incidenttal lesions; VUE images generated concurrently provide reliable initial characterization of incidental lesions |
Treatment planning | Low-energy images increase iodine conspicuity in enhancing tumors and adjacent vasculature, providing superior depiction of tumor margins and their relationship to adjacent vascular structures |
Treatment response | Iodine-extracted images and colored overlay iodine maps depict and quantify lesion vascularity and viability and may serve as a surrogate biomarker for assessing treatment response |
Contrast safety | Low-energy (50–70-keV) images increase iodine attenuation at lower contrast material doses, which may improve safety in patients undergoing multiple follow-up examinations. DECT provides us with opportunities to explore new contrast materials |
Iodine images can be displayed as a quantitative gray-scale image or as a color-coded overlay map (Fig. 8.1). The iodine density maps have the potential to increase the detection and characterization of hypoattenuating malignancies. An iodine density map increases contrast between hypoattenuating lesion and normally enhancing parenchyma on the basis of difference in tissue iodine content (Fig. 8.2). It detects and quantifies iodine within each voxel. Thus, a small amount of enhancement within the lesion can be detected. Another potential application of iodine density maps is to improve detection rate of nodules with varying enhancement pattern in a cirrhotic liver.
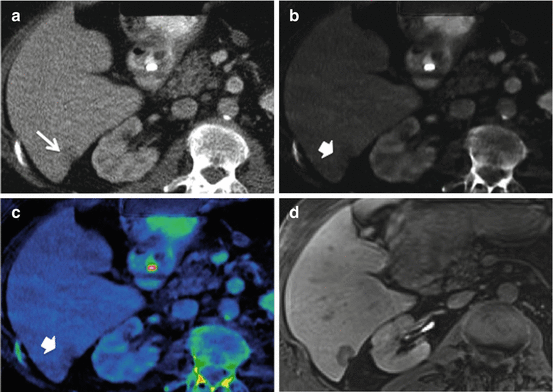
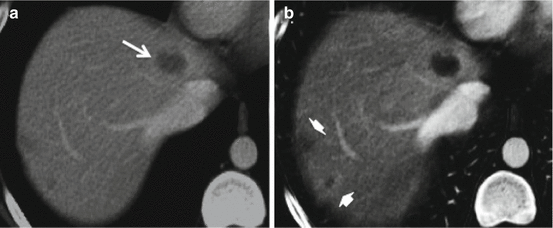

Fig. 8.1
Metastatic liver lesion from colon carcinoma in a 70-year-old man who underwent chemotherapy. (a) Axial contrast-enhanced CT images show a single hypoattenuating lesion in the segment six of the liver (arrow) with reduced attenuation of background parenchyma resulting from steatosis. (b) Postprocessed iodine CT images on a gray-scale and (c) color overlayed iodine images show improved lesion-to-parenchyma contrast and lesion conspicuity (arrowheads). (d) Contrast-enhanced T1-weighted MR image shows a low attenuation lesion in segment six of the liver, corresponding to metastatic disease. Presence of hepatic steatosis was also confirmed with in- and out-of-phase MR imaging

Fig. 8.2
Colon carcinoma metastases to the liver in a 31-year-old woman. (a) Contrast-enhanced CT images show a defined, dominant lesion in the segment 4 (arrow) and two faint hypodense areas in the segment 7. (b) Material-specific iodine images show improved visualization of the edges of the dominant lesion, and also better depict the two lesions improving lesion-to-parenchyma contrast and lesion conspicuity of all the lesions. The material-specific iodine images also better demonstrate perilesional enhancement for a lesion in the posterior right hepatic lobe (arrowhead)
Tumor-to-liver contrast and lesion conspicuity on CT images are essential for the detection of hepatocellular carcinoma. Although, a low tube voltage (80–100 kVp) has been used in past to improve conspicuity of hypervascular lesions [1–3], the increased image noise of an 80-kVp acquisition limits its widespread use in clinical practice [6]. Low keV virtual monochromatic images generated from DECT acquisitions have the potential to improve the detection of hepatocellular carcinoma or hypervascular metastatic lesion by providing better contrast to noise ratio (Fig. 8.3).
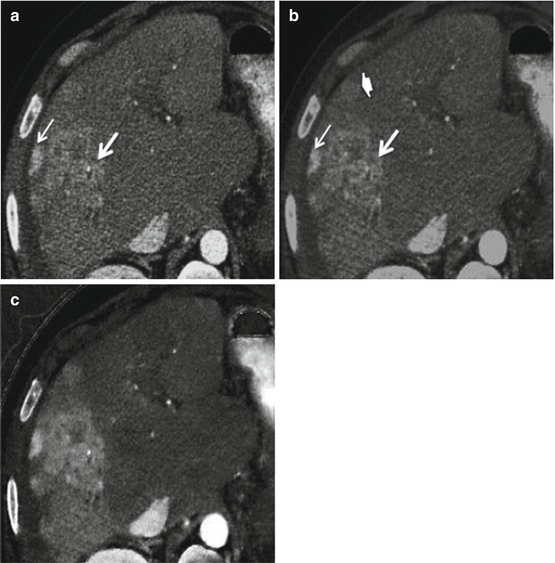

Fig. 8.3
Hypervascular liver lesions (hepatocellular carcinoma) in a 50-year-old man. (a) Contrast-enhanced CT image obtained in the arterial phase shows hypervascular liver lesions (arrows). (b) Postprocessed, low energy (50-keV) VMC CT image shows improved conspicuity of the lesions (arrows). Satellite lesions are also seen next to the main lesion (arrowheads). (c) Material-specific iodine images further improve lesion visualization
Additional applications of the low energy images include improving the identification of small focal hypoattenuating liver lesions in patients with extra-hepatic malignancies. A low kVp acquisition (80 kVp) from the DECT increases CNR between metastatic lesion and normal liver parenchyma [7]. Virtual monochromatic images at low keV have the same potential, with the added benefit of reduced beam hardening artifact, which could further improve the conspicuity of the lesion. By increasing iodine conspicuity of enhancing tumor and adjacent vasculature, the low keV images provide accurate delineation of tumor margin, local spread and relationship to adjacent vasculature that is useful to guide treatment planning [8, 9].
Small isodense pancreatic tumors tend to blend into the normal parenchyma and represent a diagnostic challenge on SECT. The low keV images can benefit isodense tumor detection rate by increasing iodine conspicuity and contrast between tumor and normal parenchyma (Fig. 8.4). Similarly, there is higher confidence in ruling out a suspected pancreatic mass. In a recent study, Patel et al. have suggested that the low energy VMC images (50–52 keV) from single source dual-energy scanner can improve the conspicuity of isodense pancreatic masses and allow the diagnosis of small isodense tumors not appreciated on the images from SECT (120 kVp) scanner [10].
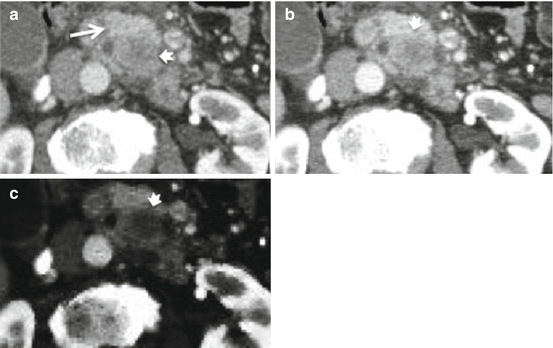

Fig. 8.4
Pancreatic mass in a 60-year-old woman. (a) Contrast-enhanced CT image shows a hypodense lesion in the uncinate process (arrowhead) surrounded by normal parenchyma (arrow). (b) Postprocessed 50-keV VMC and (c) material-specific iodine CT images show improved lesion-to-parenchyma contrast and improved delineation of tumor margins (arrowheads)
Lesion Characterization
Lesion characterization is a main clinical objective, as both benign and malignant lesions can co-exist in patients with known or suspected cancer. Moreover, incidental lesions are being detected with increased frequency. For example, about 60 % of renal cell carcinomas (RCC) have been detected incidentally on imaging studies performed for other indications [11]. Although the differentiation between a renal cyst from an enhancing renal lesion can be reliably made in a considerable number of cases on SECT images, confident differentiation of small or minimally enhancing malignant lesions from hyperattenuating cysts can be difficult. The post-processed virtual unenhanced and iodine images generated from DECT can facilitate this differentiation of enhancing from non-enhancing renal lesions [12–19]. The iodine specific maps can display presence of tissue iodine (solid lesion) or its absence (hyperdense cyst) for lesion characterization. Quantification of lesion enhancement can also be made in suspicious lesions. In a recent study with dsDECT, Song et al. suggested that a value of 20 HU on color-coded iodine overlay images could serve as a cut-off value for the determination of the presence of or absence of contrast enhancement within the renal masses [13]. A spectral attenuation curve may be plotted as a function of energy from VMC images generated at different energies. The characteristics of such a curve can be used to improve lesion characterization. For example, with the use of attenuation curves, a solid enhancing tumor may be differentiated from a hyperdense renal cyst, which has a flat curve at all energy levels, whereas the enhancing lesion has higher attenuation values at lower energy levels (Fig. 8.5). The processed VUE images can provide supplementary information of fat, hemorrhage and or calcification within the lesion nearly same as TUE images (Fig. 8.6).
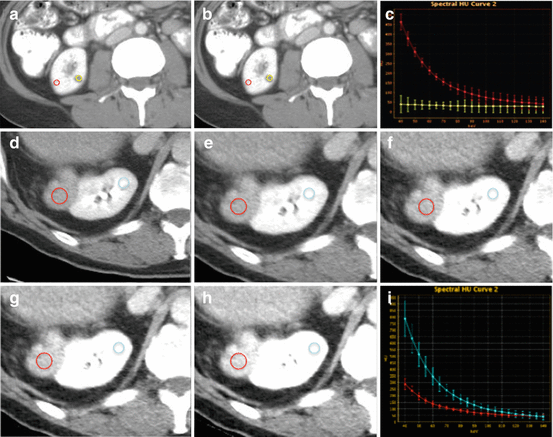
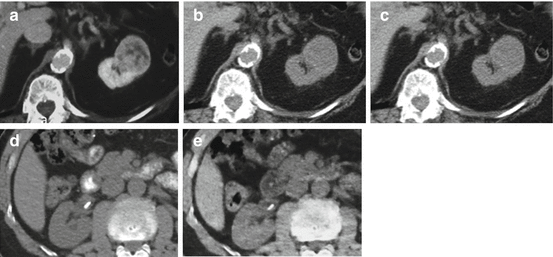

Fig. 8.5
Spectral curve analysis. (a, b) CECT (140 kVp) and VMC (60 keV) CT images show an incidentally discovered hypodense renal lesion in the right kidney (yellow circle), with no significant change in attenuation at different energies. (c) Attenuation profile of normal enhancing renal parenchyma vs. renal cyst represented by red and yellow curves, respectively. (d–i) CECT and VMC CT images show an enhancing right renal lesion (red circle) and normal renal parenchyma (blue circle), which demonstrate spectral variation in their attenuation, with higher attenuation at lower energies and lower attenuation at higher energies. Renal cell carcinoma was subsequently confirmed

Fig. 8.6
VUE images serve as a good representation of TUE images in the clinical practice. However, VUE can be smoother than TUE images. These images are created by subtraction of iodine, present in contrast material. (a) CECT image of an 80 year-old woman showing a heterogeneously enhancing renal mass. (b) TUE image and (c) VUE images are similar with the necrotic components within the mass better depicted on VUE images. (d, e) Axial images of a 50 year-old male with hematuria. (d) TUE images and (e) VUE images show a stone in the right renal pelvis
The iodine maps can also help to characterize intravascular thrombus in the abdominal organs. For instance, bland thrombus in the renal vein can be differentiated from a tumoral thrombus, by qualitative and quantitative demonstration of iodine with the thrombus. Similarly, blood clots in the renal collecting system can be differentiated from the urothelial tumors by detecting presence of iodine/enhancement within the lesion.
Characterization of incidentally detected adrenal nodules can also be facilitated on the VUE generated from the CE-DECT exam. Since TUE is not always performed with CECT of the abdomen, further imaging assessment or biopsy is often necessitated for a detected adrenal nodule. The VUE images from CE-DECT can eliminate the need for further imaging. Ho et al. have confirmed that the VUE images can provide the necessary information from TUE images for the qualitative and quantitative assessment of adrenal nodules [20].
Likewise, evaluation of small hypoattenuating liver lesions for potential metastatic lesion can make a difference in treatment decisions. The workup of these lesions with MRI or biopsy can increase the time and cost of investigation, and also create unnecessary patient anxiety. Therefore, having the possibility of solving such clinical dilemmas in one routine exam is desirable. In a DECT acquisition, cysts can be differentiated from small metastatic liver lesions by using the iodine images. The solid lesion will show iodine content whereas the cystic lesions will not (Fig. 8.7).
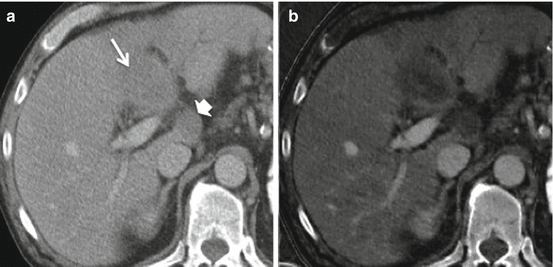

Fig. 8.7
Metastases to the liver from colon cancer, in a 58-year-old man. (a) Contrast-enhanced CT images show a hypoattenuating lesion in the segment 4 of the liver (arrow), and a second lesion in the caudate lobe (arrowhead). (b) Material-specific iodine images better depict the lesions and show intralesional enhancement, improving detection and characterization of the lesions
The characterization of some hypoattenuating pancreatic tumors can sometimes be challenging on SECT and is one of the clinical situations where DECT can be useful. The differentiation of pancreatic lesions as a solid hypovascular tumor or benign cystic lesion is very important. Sometimes, focal fatty change can also be misinterpreted as a ductal carcinoma. The solid lesion will show iodine content in the iodine images. A cystic lesion will show no enhancement in the iodine images and the focal fatty change will have the same attenuation as abdominal fat in the virtual unenhanced [21].
Thus, the improved detection and characterization of lesion by DECT scan could potentially reduce the need for short-interval follow-up studies, reduce the number of unnecessary biopsies, and more importantly will improve the success of multi-detector CT scans in screening for hypervascular liver tumors in cirrhotic patients.
Treatment Planning
Knowledge of tumor extent and its relationship to vascular structures is important for planning tumor treatment. To customize treatment for organ targeted therapies, defining tumor boundaries and quantifying tumor burden/viability is required for effective treatment delivery with minimized risks.
Stay updated, free articles. Join our Telegram channel

Full access? Get Clinical Tree


