Renal Tumors
Mark A. Rosen
Stephen M. Keefe
Priti Lal
William M.F. Lee
Renal cell carcinoma (RCC) serves as an excellent model for the application of perfusion and pharmacokinetic imaging by computed tomography (CT) and Magnetic resonance imaging (MRI). Diagnostic imaging of renal lesions requires the radiologist to assess the static and dynamic pattern of focal lesion contrast enhancement against the background of the highly vascularized renal parenchyma. The histologic subtypes of renal cell carcinoma provide a range of vascular biology, from which the dynamic enhanced imaging behavior of these masses derives. The molecular biology and genetics of RCC, especially that of the clear cell variant—driven by the von Hippel-Lindau (VHL) and hypoxia inducible factor (HIF) pathway—provide for a rich cross-sectional imaging display of the manifestations of tumor angiogenesis. Finally, recent advances in targeted antitumor therapies have revolutionized the management of metastatic RCC. Antiangiogenic therapies targeting the vascular endothelial growth factor (VEGF) receptor—including antibody blockage (e.g., bevacizumab) or small molecular tyrosine kinase inhibitors (e.g., sorafenib, sunitinib, etc.)—provide the opportunity for research into the use of perfusion imaging as a biomarker of therapeutic efficacy and clinical outcomes.
Physiology of Contrast Enhancement in Tumors and Tissues
The physiology relating to contrast-enhanced cross-sectional imaging is based on the delivery of exogenous contrast molecules into the tissue of interest. The pharmacokinetic modeling on exogenous contrast agent passage in tissues has been described in Chapter 29 in this book. Contrast is delivered via arterial blood flow and equilibrates via leakage from the plasma space into the interstitium of the tissues. The rate of contrast influx is regulated by a combination of flow into the tissue capillary bed and the permeability of the capillary bed endothelium toward passage of contrast agent into the tissue interstitium. During bolus contrast agent administration, the concentration of contrast agent in plasma is initially high, then subsequently decreases as the contrast agent is more evenly distributed throughout the body and is slowly excreted by the kidneys. In tumors, the highly permeable neovasculature allows for rapid tumor contrast agent accumulation, followed by efflux of contrast from tissues back into the plasma space. The degree of contrast accumulation is also determined by the so-called tissue leakage space, representing the extravascular-extracellular space – noting that both MRI and CT contrast agents do not routinely cross cell membranes into the intracellular space.1 In cases where the intravascular volume of the tissue is nonnegligible, the total contrast agent accumulation at any given time is a function of the amount of contrast in both the intravascular and the interstitial tissue compartments.
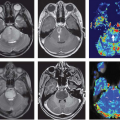
The passage of exogenous contrast in normal kidneys differs slightly from that of the previous scenario. It is beyond the scope of this chapter to describe the physiology and kinetic modeling of functioning renal tissues and exogenous contrast (see Chapter 75). However, when imaging the quantitative behavior of renal tumors, reference is often made qualitatively or semiquantitatively to the enhancement behavior of the background renal parenchyma. A brief review of the physiology of renal parenchyma is, therefore, important. The passage of contrast agent into the renal cortex is very rapid because of the high flow rates and the highly permeable endothelial membrane of the glomeruli. However, the lining of the collecting tubules is impermeable to contrast passage. As contrast moves along the collecting tubules into the renal medullary pyramids, the active resorption of water slowly increases the concentration of the contrast agent in the collecting ducts, leading to gradually increasing overall tissue contrast concentration (greater than that of blood pool), a phenomenon not encountered in other normal or pathologic tissues. As such, the “cortical-medullary” differentiation in renal parenchyma on early-phase contrast-enhanced CT or MRI studies is followed by a more uniform enhanced appearance (termed the nephrographic phase). Following this phase, increased concentration of contrast agent in the collecting tubules produces an excretory-phase appearance, where very high contrast is seen in the medullary pyramids and the pelvocalyceal portion of the collecting system. As such, the appearance of well-vascularized RCCs relative to that of the background renal parenchyma will vary based on tumor location (cortex vs. medulla) and the exact timing of imaging relative to contrast administration (Fig. 66.1).
Methods of Quantitative Analysis of Tumor Enhancement in Dynamic Enhanced Imaging
In quantitative contrast-enhanced CT and MRI, the degree of tumor or tissue enhancement is evaluated as a function of time from contrast agent administration or
contrast arrival in tissues. This implies a comparison of the postcontrast signal intensities of the tissue relative to those of the same tissue(s) prior to contrast administration. The presence of exogenous contrast enhancement will lead to increases in tissue signal intensity in CT or T1-weighted MRI and to a lesser extent decreases in signal intensity on T2*-weighted MRI (e.g., dynamic susceptibility). In CT, iodinated contrast agents will increase tissue signal intensity in proportion to their concentration in the tissue.1 As such, the postcontrast enhancement of tissues, described as the difference between the precontrast and the postcontrast tissue signal intensity (in Hounsfield units), is a direct reflection of the tissue contrast concentration. In T1-weighted MRI, the relation between gadolinium-contrast agent concentration and changes in signal intensity is more complex (see Chapter 6), and different quantitative models will measure either the change in signal intensity (measured in arbitrary MRI units) or the percentage enhancement of tissue, described by the ratio of postcontrast to precontrast tissue signal intensity. In T2*-weighted dynamic susceptibility imaging (less commonly used in evaluation of RCC), the percentage of signal decrease is identified to determine tumor flow and blood volume parameters.
contrast arrival in tissues. This implies a comparison of the postcontrast signal intensities of the tissue relative to those of the same tissue(s) prior to contrast administration. The presence of exogenous contrast enhancement will lead to increases in tissue signal intensity in CT or T1-weighted MRI and to a lesser extent decreases in signal intensity on T2*-weighted MRI (e.g., dynamic susceptibility). In CT, iodinated contrast agents will increase tissue signal intensity in proportion to their concentration in the tissue.1 As such, the postcontrast enhancement of tissues, described as the difference between the precontrast and the postcontrast tissue signal intensity (in Hounsfield units), is a direct reflection of the tissue contrast concentration. In T1-weighted MRI, the relation between gadolinium-contrast agent concentration and changes in signal intensity is more complex (see Chapter 6), and different quantitative models will measure either the change in signal intensity (measured in arbitrary MRI units) or the percentage enhancement of tissue, described by the ratio of postcontrast to precontrast tissue signal intensity. In T2*-weighted dynamic susceptibility imaging (less commonly used in evaluation of RCC), the percentage of signal decrease is identified to determine tumor flow and blood volume parameters.
 FIGURE 66.1. Clear cell renal cell carcinoma appearance on multiphase gadolinium-enhanced magnetic resonance imaging. Axial T1-weighted spoiled gradient echo images before (A), and during the corticomedullary phase (B), early nephrographic phase (C), and late nephrographic phase (D) of contrast passage through the kidneys. (A) The mass is isointense to kidney except for a small necrotic portion (white arrow) that is hyperintense to renal parenchyma. (B) The solid portion of the mass (black arrows) avidly enhances much more intensely than the neighboring renal medulla. As contrast continues to accumulate in the renal parenchyma (C, D), the mass becomes less conspicuous and harder to identify. |
Analysis of dynamic contrast-enhanced (DCE) CT or MRI experiments can be semiquantitative (also known as heuristic) or quantitative (also referred to as pharmacodynamic). Heuristic methods measure aspects of dynamic tissue enhancement, including the rate of initial enhancement, the degree of maximal or peak enhancement, the time to peak enhancement, and the rate of delayed contrast washin or washout, using absolute imaging intensity or percent enhancement units. Pharmacodynamic analyses will quantify aspects of tissue physiology, including (depending on the model used) tissue blood flow, tissue perfusion, vascular permeability, tissue leakage space, and so forth. Because of the high permeability of small molecular weight gadolinium-based contrast agents used in DCE-MRI, rapid transfer from the blood plasma to the tumor interstitium often precludes the individual evaluation of tumor flow and vascular permeability. Rather, the first order transfer constant of these agents into the tumor interstitium, termed Ktrans, is evaluated via pharmacokinetic modeling. The physiologic meaning of Ktrans can
vary, but in general it represents a combination of tumor blood flow and vascular permeability.2 For more details the interested reader is referred to Chapter 29.
vary, but in general it represents a combination of tumor blood flow and vascular permeability.2 For more details the interested reader is referred to Chapter 29.
Pharmacokinetic modeling, whether by DCE-CT or DCE-MRI, requires the use of a vascular input function. This function can be derived from population-based kinetic data or can be measured directly (or indirectly in some DCE-MRI models) from each patient via information from vascular or reference tissues within the imaged area of anatomy. In general, the more formal pharmacokinetic modeling methods require more rapid imaging than heuristic methods do, although for heuristic analysis, accurate measurement of early enhancement rates can also improve when more rapid imaging is performed.
 FIGURE 66.2. Subtypes of renal cell carcinoma. Photomicrographs of renal cell carcinoma specimens stained with hematoxylin and eosin. (A) Clear cell variant of renal cell carcinoma (20X). The tumor is composed of sheets of clear cells surrounded by in intricate web of capillaries. The cells are intermediate to large size, with nuclei ranging in Fuhrman grade from low (left) to high (right). (B) Papillary renal cell carcinoma, type 1 (20X). The papillae are covered by small cells with scanty cytoplasm arranged in a single layer on the capillary basement membrane. (C) Papillary renal cell carcinoma, type 2 (20X). The papillae are lined by tumor cells with high nuclear grade. The cells have abundant eosinophilic cytoplasm and the nuclei are often pseudostratified. The papillary cores in this example show abundant histiocytes. (D) Chromophobe carcinoma (40X). The tumor is composed of large cells with rigid cell borders and eosinophilic cytoplasm. The nuclei have irregular nuclear envelope giving them a “raisinoid” appearance. Perinuclear clearing (perinuclear haloes) are present. |
Molecular and Vascular Biology of Renal Cell Carcinoma
RCC is the term used to designate a group of cancers thought to arise from renal tubular epithelium. RCC subclassification is based largely on histologic characteristics,3 but genetic studies have established links between molecular genetic alterations and histopathology. The majority (approximately 75%) of RCC are of the clear cell subtype (ccRCC, Fig. 66.2A), so called because the glycogen- and lipid-laden tumor cells appear to have clear, featureless cytoplasm upon routine histochemical staining. The ccRCC tumors are highly vascular and graded on the basis of nuclear characteristics (Fuhrman grades 1 to 4), which has been shown to be prognostically significant. Papillary RCCs (approximately 10% to 15% of RCC, Fig. 66.2B, C) display papillae and tubule formation and are subdivided into types 1 and 2 based on tumor cell arrangement and morphology. Chromophobe RCC (approximately 5% of RCC, Fig. 66.2D) is characterized by large polygonal cells with reticulated cytoplasm and prominent cell membranes. A common benign tumor of the kidneys, oncocytomas, share some cellular and molecular characteristics with chromophobe tumors. Rarely, RCC can display a mixture of two different morphologic subtypes. Tumor cells in each of these RCC histologic subtypes can also display
sarcomatoid transformation, which is associated with poorer prognosis. Several more rare histopathologic variants make up the remainder of RCCs.
sarcomatoid transformation, which is associated with poorer prognosis. Several more rare histopathologic variants make up the remainder of RCCs.
The major RCC histopathologic subtypes are found both among sporadic (nonfamilial) RCCs and RCCs arising in members of cancer-predisposed families. Although relatively rare, familial RCC cases are highly informative because they have led to the discovery of several genes that predispose to RCC development. These genes, in turn, reveal genetic and molecular pathogenic mechanisms, some of which underlie common nonfamilial RCC as well. A prime example is the insight into ccRCC pathogenesis gained from study of patients with VHL disease, who are predisposed to developing renal cysts, ccRCC, and other neoplasms (reviewed by Kaelin4). The protein product of the gene responsible for VHL (pVHL) regulates degradation of other proteins, including those in the HIF family. Under oxygenated conditions, pVHL binds to the alpha subunit of HIFs, leading to their rapid degradation. Under conditions of oxygen deprivation, pVHL cannot bind to the HIF alpha subunits and the latter are stabilized, leading to higher HIF levels in cells. HIF proteins are transcriptional activators, and their abundance leads to activation of genes that facilitate cell adaptation and response to hypoxia. In familial ccRC–and a large majority of sporadic ccRCC, the VHL gene is deleted, mutated, or epigenetically silenced in tumor cells, resulting in loss of functional pVHL, elevated HIF levels, and deregulated expression of HIF-responsive genes.
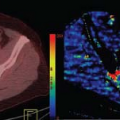
An important HIF transcriptional target is the gene encoding VEGF-A, which is a potent endothelial cell mitogen and chemotactic factor and a major inducer of physiologic and tumor angiogenesis.5 The deregulated production of VEGF-A in ccRCC results in the dense meshwork of fine capillaries characteristic of these tumors (Fig. 66.3). In addition, VEGF-A increases the permeability of microvessels. The combination of high tumoral blood volume and highly permeable capillary bed contributes to the pharmacokinetics of CT and MRI contrast agent accumulation in ccRCC tumors.
RCC histologic subtypes besides ccRCC are also associated with anomalies in specific genes,3,6 but these alterations tend to be seen only in familial tumors, and their importance in pathogenesis of sporadic RCC is uncertain at this time. Familial type 1 papillary RCC are associated with activating mutations of the c-Met gene, while type 2 papillary RCC arising in hereditary leiomyomatosis and renal cell cancer syndrome are associated with functional loss of the fumarate hydratase (FH) gene. Notably, loss of FH activity causes cells to accumulate fumarate, which can lead to HIF upregulation even when functional pVHL is present.7 Chromophobe RCC and oncocytomas occur in Birt-Hogg-Dube syndrome, which is associated with loss of the folliculin (FLCN) gene. Other familial RCCs are associated with inactivation of genes of the tuberous sclerosis complex (TSC1 and TSC2), the phosphatase and tensin homolog (PTEN) gene, and genes encoding subunits of the succinate dehydrogenase (SDH) complex. Sporadic RCC can be associated with chromosomal translocations involving genes encoding TFE3 and related transcription factors. To date, no antitumor therapies targeted to these activated molecular pathways have been shown to be effective against these other subtypes of RCC, although evaluation in many cases is ongoing.
Imaging Protocols for Evaluation of Renal Masses
In clinical body imaging, CT and MR acquisitions are geared toward high-resolution large volume anatomic evaluation. Few radiology centers routinely acquire dynamic CT or MRI sets that are suitable for physiologic modeling of renal tumor dynamic enhancement patterns. The typical contrast-enhanced imaging protocol for renal mass evaluation includes a single precontrast image set of the kidneys, followed by two or three postcontrast image sets at distinct phases of renal enhancement. These dynamic enhanced imaging sets (referred to here as a multiphase CT or MRI) are performed at relatively low temporal resolution, often acquiring a single postcontrast image per breath-hold. The temporal resolution of these imaging protocols is at best 30 to 40 seconds per image set and can be even greater if imaging is acquired at certain fixed “phases” (e.g., cortical-medullary, nephrographic, and excretory) of contrast enhancement of the renal parenchyma. These clinical imaging datasets cannot in general be used for the evaluation of perfusion parameters. Because the clinical evaluation of renal masses by CT or MRI is so ubiquitous, there are a wealth of data on the appearance of renal masses in these multiphase contrast enhanced studies. These reports have demonstrated much about the use of imaging to reveal the vascular status of renal tumors, setting the stage for perfusion imaging to interrogate more precisely the vascular physiology of renal tumors.
In the patient with metastatic disease, clinical cross-sectional imaging protocols (especially CT) are not generally performed as dynamic enhancement sets, and large volume “single-phase” postcontrast imaging only is the rule. This limits the ability of clinical investigators to evaluate the dynamic enhancement pattern of tumors in patients with RCC (or other) metastases. Instead, specialized imaging methods (usually used only in research protocols) are required for such evaluations. Nevertheless, single-phase imaging studies (especially CT) performed to evaluate the morphologic effects (i.e., tumor growth or shrinkage) of antitumor therapy have provided a wealth of data to explore the antivascular effects of these therapies via unique image analysis methods.
 FIGURE 66.3. Vascular density patterns in renal cell carcinoma subtypes. Photomicrographs (200X magnification) of RCC subtypes stained with anti-CD34 antibody to demonstrate vascular endothelial cells (green fluorescence, right, B, D, F) and counterstained with hematoxylin to demonstrate cell nuclei (left A, C, E). High vascular density of clear cell subtype (A, B) is demonstrated relative to the comparatively sparse vasculature of papillary (C, D) and chromophobe (E, F) subtypes. |
Dynamic Computed Tomography for Characterization of Solid Renal Lesions
With the advent of helical CT scanning, rapid multipass imaging of the kidneys during bolus iodinated contrast-enhanced CT became feasible. Early on in this experience, it became clear that the dynamically changing pattern of renal neoplasms held important information for tumor detection and characterization. Dynamic-enhanced imaging has been shown to better depict renal lesions than single-phase, enhanced studies.8 Furthermore, enhancement patterns between corticomedullary and nephrographic phase imaging differ between benign and malignant lesions.
Qualitative analysis of enhancement at early- and late-phase imaging can differentiate between renal lesion types. The ccRCC tumors are more prominently represented as highly enhancing lesions on early corticomedullay phase imaging.9,10 Chromophobe tumors demonstrate more intermediate levels of early enhancement, with papillary lesions the least enhancing.11 But on nephrographic phase imaging, Kutman et al.12 demonstrated that benign lesions, such as oncocytoma and vascularized angiomyelolipomas, had higher enhancement than malignant RCCs, possibly owing to more homogeneous fill in of these benign tumors. These findings extend to more quantitative kinetic analysis of DCE-CT imaging, with Chen et al.13 demonstrating that ccRCC demonstrate higher blood volume (BV), blood flow (BF), and vascular permeability and shorter mean transit time when compared with nonclear cell tumors.
Heuristic analysis of dynamic CT enhancement patterns demonstrated that multiple dynamic enhancement parameters, including initial slope and area under the time–density curve, correlated strongly with tumor microvessel density (MVD) analysis at histology.14,15 Perfusion CT analysis also demonstrates positive significant correlation between BV, BF, permeability surface-area product, and tumor microvessel density.13
Dynamic Magnetic Resonance Imaging for Renal Lesion Characterization
Like CT, dynamic-enhanced MRI can also be used to define and characterize the vascular behavior of solid renal masses. Early investigations demonstrated the usefulness of multiphase gadolinium-enhanced MRI for characterizing renal masses.16,17,18 In one report, researchers demonstrated that dynamic multiphase MRI improved detection of small RCC versus single-phase conventional (i.e., steady-state) gadolinium-enhanced imaging.19
As is true for CT, the vascular patterns of renal lesions vary in multiphase enhanced MRI. Cysts demonstrate no enhancement. Benign solid lesions, such as angiomyolipomas (but not oncocytoma), tend to enhance less avidly. Clear-cell RCC lesions tend to enhance more avidly then non-ccRCC lesions. Nevertheless, unlike CT, there is no standard intensity scale in MRI. As such, it is difficult to compare the results of quantitative analyses of enhanced MRI data performed at different imaging centers. Furthermore, the inherent high sensitivity of MRI for gadolinium (owing to the nonlinear relationship between gadolinium contrast accumulation in tissues and the resulting change in signal intensity) can at time magnify the MRI signal intensity differences between tissue types or within a given tissue as a function of time.
Nevertheless, researchers have successfully used both qualitative and quantitative analyses of dynamic MRI-enhancement data to infer information about tumor cell type, grade, and vascularity. Sun et al.20 studied the dynamic enhancement characteristics of RCCs using heuristic analytic methods. They showed that ccRCCs demonstrated the greatest percentage of enhancement in both the corticomedullary and nephrographic phases of enhancement, with papillary RCCs much less enhancing and chromophobe tumors demonstrating intermediate degrees of enhancement. Similar results were obtained when the tumor–renal cortex enhancement index was evaluated. Palmowski et al.21 were able to distinguish grade 3 RCC from grade 2 RCC by quantitative enhancement characteristics using pharmacokinetic modeling of DCE-MRI series. In a separate study using two-compartment pharmacokinetic modeling of DCE-MRI data, Notohamiprodjo et al.22 were unable to distinguish between clear cell and papillary RCC variants.
Given the emerging literature on conservative (i.e., nonsurgical) approaches to incidentally detected small renal masses, there is renewed interest in noninvasive means to assess tumor aggressiveness and to find imaging correlates for tumor grade. This is further motivated by the reluctance of many groups to perform needle biopsy of renal masses, given the concern for misclassification and misgrading based on limited sampling from percutaneous tissue biopsy. Because clear cell variants of RCC tend to be more biologically aggressive, the ability of functional imaging such as dynamic-enhanced CT or MRI to delineate the clear cell subtype of suspected RCC masses could have implications for future patient management decisions.
Monitoring of Local Therapy
In recognition of the indolent nature of many small RCCs, nonsurgical ablative methods for treatment of these early-stage RCC patients has become more widespread.23,24 Methods such as radio-frequency ablation and cryoablation are increasingly used to manage patients with small solid renal masses, particularly in the elderly population and those with increased surgical risk owing to comorbid conditions. With the increase in the population of patients with locally ablated renal tumors, there is an ongoing need for effective imaging-based assessment of these ablated lesions to evaluate for treatment failure and to triage for subsequent interventions.
Typically, CT or MRI is used 1 month or several months after therapy and then at regular intervals to ascertain tumor growth. Nevertheless, because of the effects of therapy on surrounding nontumorous tissue, the ablated tumors can appear larger early on after treatment. In some cases, lesion shrinkage might not be seen, even years after successful therapy. In general, the presence of contrast enhancement in the ablation zone has been a criteria for determining local recurrence.25,26 Nevertheless, the presence of contrast enhancement on these imaging studies can be nonspecific, as scar tissue can also enhance following administration of contrast on CT or MRI studies.
In light of these issues, one group has investigated quantitative dynamic-enhanced CT imaging as a means of detecting tumor residual or recurrent tumor after local therapies. Squillaci et al.27 used DCE-CT to map perfusion parameters in locally ablated renal tumors, demonstrating an altered time-intensity curve type in one patient with local treatment failure. In a different study of 10 patients who underwent percutaneous renal tumor ablation, both conventional contrast-enhanced T1-weighted MRI and arterial spin labeled MRI perfusion measurements correlated well with the ultimate ablated volume of tissue.28
TABLE 66.1 U.S. FOOD AND DRUG ADMINISTRATION–APPROVED TARGETED AGENTS FOR RENAL CELL CARCINOMA | |||||||||||||||||||||||||||||||||||||||||||||
|---|---|---|---|---|---|---|---|---|---|---|---|---|---|---|---|---|---|---|---|---|---|---|---|---|---|---|---|---|---|---|---|---|---|---|---|---|---|---|---|---|---|---|---|---|---|
| |||||||||||||||||||||||||||||||||||||||||||||
Related posts:


Stay updated, free articles. Join our Telegram channel

Full access? Get Clinical Tree


