Renal Tumors
INTRODUCTION
While there are many types of solid renal tumors; the most common solid renal masses are renal cell carcinomas (RCCs), angiomyolipomas (AMLs), and oncocytomas. Unfortunately, with the exception of the majority of AMLs, most solid renal tumors do not have a radiographic appearance sufficiently characteristic to allow for a definite diagnosis to be made. In some instances, however, combinations of imaging features can be used to suggest a likely diagnosis. Modern imaging techniques also play a major role in management and follow-up of many patients with renal tumors.
INDETERMINATE VERY SMALL RENAL MASSES (<1 TO 1.5 CM)
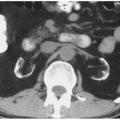
Continued improvement in cross-sectional imaging modalities has enabled detection of many very small renal lesions. Most masses <1 to 1.5 cm in maximal diameter appear to be of soft tissue attenuation but are usually too small to characterize as cystic or solid (Fig. 6.1). This is for two reasons: (1) volume averaging and (2) pseudoenhancement.
Volume averaging results from the unintentional averaging of pixels within a small renal mass with pixels in adjacent normal tissue. When a region of interest measurement is obtained in a small cystic mass, the obtained attenuation of the mass represents an average of the true attenuation of the mass itself and adjacent renal
parenchyma. As a result, a cystic mass can be falsely assumed to be of soft tissue attenuation on unenhanced or enhanced CT images and can also be falsely identified as enhancing when both unenhanced and enhanced series are available. Volume averaging can be eliminated as a problem when CT image collimation is decreased to less than half of a renal mass’s diameter. In this way, it can be assured that at least one image obtained through the mass does not contain any volume-averaged tissue.
parenchyma. As a result, a cystic mass can be falsely assumed to be of soft tissue attenuation on unenhanced or enhanced CT images and can also be falsely identified as enhancing when both unenhanced and enhanced series are available. Volume averaging can be eliminated as a problem when CT image collimation is decreased to less than half of a renal mass’s diameter. In this way, it can be assured that at least one image obtained through the mass does not contain any volume-averaged tissue.
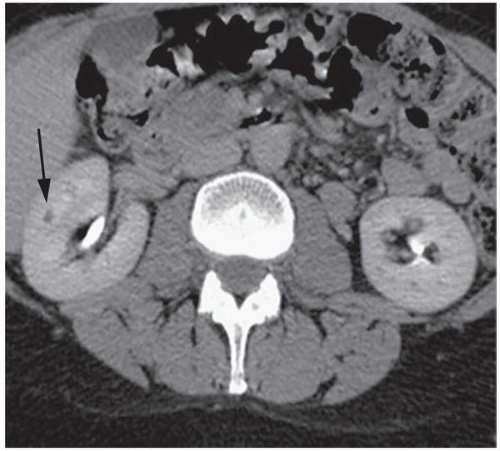 FIGURE 6.1. Indeterminate renal mass. Contrast-enhanced axial CT image demonstrates a tiny sub-cm indeterminate lesion in the right kidney (arrow). This mass is too small for accurate attenuation measurements to be obtained. |
Pseudoenhancement is an artifactual increase in attenuation of a renal cyst after contrast material administration, due to the reconstruction algorithm used for CT, even when the effects of partial volume averaging have been accounted for and eliminated. Thus, even when appropriately thinly collimated images are obtained on a contrast-enhanced CT, a small renal cyst can spuriously appear as solid. A number of factors have been identified that increase the likelihood of pseudoenhancement. Pseudoenhancement is more often present on multidetector CT examinations when masses are small. Thus, pseudoenhancement is seen in about one-third of renal masses <1 cm in maximal diameter (compared to about 10% of masses measuring 1 cm or larger). It is also more often present in masses that have a central location (as these are surrounded by brightly enhancing renal parenchyma), seen in about one-third of such masses (compared to only about 10% of masses that are peripheral). It should be emphasized that pseudoenhancement almost always results in attenuation increases of up to no more than 30 HU. Any measured enhancement exceeding this amount should, therefore, be considered to be true enhancement, providing that volume averaging has been accounted for.
The overwhelming majority of small renal masses are benign cysts. For this reason, nearly all small renal masses that cannot be characterized by CT can be ignored. In only a few settings, additional evaluation should be performed: (1) when a small renal mass is demonstrably heterogeneous (a feature that is unlikely to be encountered in a renal cyst) or (2) when a small renal mass is detected in patients with known renal cancer-causing syndromes, even if the mass is homogeneous. In these two instances, follow-up CT or MRI is suggested to assess these lesions for stability. It should be noted, however, that many benign and malignant renal masses grow at slow and comparable rates (of only 2 to 4 mm per year). So, the average rate of renal mass growth between two sequential 6-month CTs is actually close to the intraobserver and interobserver variability in measuring renal masses, even when they do not grow. For these reasons, follow-up studies should be compared to multiple previous examinations, and any detected renal masses should also be assessed for increasing complexity. Also, once an indeterminate mass enlarges above 1.5 cm in greatest dimension, it can be more reliably assessed as cystic or solid.
SOLID RENAL MASSES
Imaging Techniques
Two basic imaging characteristics of solid renal masses are encountered on cross-sectional imaging studies: those that contain macroscopic fat and those that do not. Nearly all of the former lesions represent benign AMLs, while the majority of the latter represent renal cancers. Pre- and postcontrast thin-section multiphasic CT or MRI are the methods of choice for evaluating a patient with a suspected renal mass. When a renal mass is identified on a CT scan performed for another purpose, it may be prudent to perform a dedicated renal CT in order to assess the vascularity of the lesion and its enhancement characteristics, as well as to assess the status of the inferior vena cava, regional lymph nodes, and adjacent organs.
Although ultrasound can be helpful in distinguishing solid from cystic renal masses, it is not nearly as sensitive in detecting small renal masses as is CT or MRI. In one study of patients with VHL followed with US and CT examinations US failed to identify 80% of masses smaller than 1 cm seen on CT. When detected on US, solid renal masses are usually identified as such, although cystic regions representing areas of hemorrhage or necrosis may be seen. Microbubble contrast ultrasound agents have been shown to enhance vascular elements within soft tissues, including the kidney, and may be useful in evaluating patients with known or suspected renal cancers when contrast agents cannot be administered for CT or MRI.
Isoechoic solid renal tumors may be difficult to detect with ultrasound, especially if they are small and do not displace the collecting system or produce a contour deformity. Less echogenic primary renal tumors can simulate more homogeneous tumors such as lymphomas or may be confused with renal cysts. However, these solid tumors usually have poorly defined margins and do not have the increased sound transmission seen with cysts. A few renal adenocarcinomas are primarily cystic. However, these cystic tumors can usually be distinguished from simple cysts by their irregularly thick walls and the presence of some internal echoes. Duplex and color Doppler ultrasounds provide a noninvasive measure of the vascularity of a renal mass. High-velocity signals, which are presumably due to arteriovenous shunting, are frequently seen in renal carcinomas.
Dedicated renal mass CT or MRI should be obtained as the study of choice in any patient with a known or suspected solid renal mass. At a minimum, a two-phase study that includes a noncontrast examination of the liver and kidneys and postcontrast study made during the nephrographic phase (NP) should be performed. In some instances, the addition of arterial phase (e.g., to evaluate the arteries prior to planned surgery), corticomedullary phase (CMP) (to evaluate the veins and other organs), and/or excretory phase (to evaluate the renal collecting systems) series may also be helpful. Arterial phase images (in which the arteries enhance briskly, the renal cortex enhances briskly, but the renal medulla demonstrates little enhancement) are usually acquired beginning at about 20 to 30 seconds following the initiation of intravenous contrast material administration. CMP images (in which the arterial enhancement is not as pronounced, but the renal cortex continues to enhance briskly and the medulla enhances, but to a much lesser extent) are routinely acquired beginning at about 60 to 70 seconds, NP images (in which the kidney now enhances homogeneously) beginning at about 90 to 100 seconds, and excretory phase (EP) images (when the nephrogram remains homogeneous but begins to fade and when excreted contrast material is detected in the renal collecting systems) beginning at 120 to 180 seconds.
CT is best performed by obtaining narrowly collimated thinsection images (no more than 2.5 to 5.0 mm in thickness) both before and after intravenous contrast material administration. A comparison of the density on the enhanced series to that of the unenhanced image allows for assessment of contrast enhancement. While all findings can be made on the axial images, coronal reformatted images are particularly helpful in identifying renal masses, especially those that are small or that have a polar location.
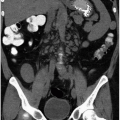
NP images are important for the detection of solid renal masses for several reasons. Firstly, some solid renal masses will not demonstrate definite enhancement on CT until the NP images occur. If only CMP images are obtained in these patients, a renal cancer might be falsely diagnosed as a high-density renal cyst. Secondly, the persistent differential enhancement of the renal cortex and renal medulla on CMP images may result in failure to diagnose some hypervascular cortical renal masses (enhancing similarly to normal renal cortex) or some hypovascular medullary masses (enhancing similarly to normal renal medulla) (Fig. 6.2).
There are a few problematic issues related to CT imaging of solid renal masses. It has recently been shown that just under 10% of
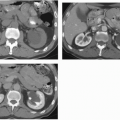
renal cancers may measure water attenuation on noncontrast images (between -10 and 20 HU). This is problematic, as these lesions could be misdiagnosed as cysts if only unenhanced CT images are available (Fig. 6.3). The low attenuation of these lesions has primarily been seen in some patients with clear cell carcinomas, probably due to the fact that these tumors contain large amounts of intracellular lipid. While the vast majority of water attenuation masses seen on unenhanced CT are cysts, it is important to assess any such masses for even subtle heterogeneity, to minimize the likelihood that a renal cancer is not erroneously diagnosed as a benign lesion.
renal cancers may measure water attenuation on noncontrast images (between -10 and 20 HU). This is problematic, as these lesions could be misdiagnosed as cysts if only unenhanced CT images are available (Fig. 6.3). The low attenuation of these lesions has primarily been seen in some patients with clear cell carcinomas, probably due to the fact that these tumors contain large amounts of intracellular lipid. While the vast majority of water attenuation masses seen on unenhanced CT are cysts, it is important to assess any such masses for even subtle heterogeneity, to minimize the likelihood that a renal cancer is not erroneously diagnosed as a benign lesion.
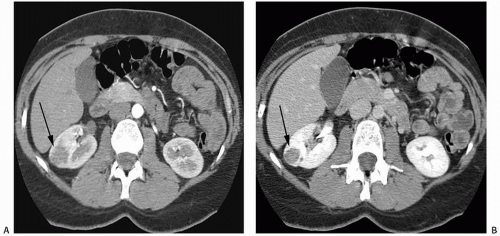 FIGURE 6.2. Advantage of NP or EP images over CMP images. A small renal cancer in the right kidney is less well seen on axial CMP images (A) than on EP images (B) (arrows). |
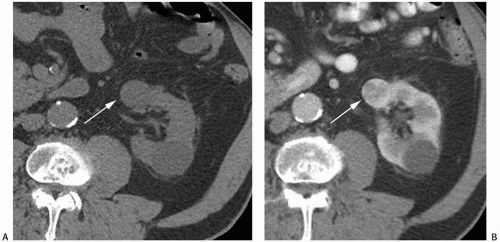 FIGURE 6.3. Renal cancer mimicking a cyst on noncontrast CT. A: Two left renal masses measure water attenuation on noncontrast axial images, one located posteriorly (4 HU) and the other located anteriorly (9 HU) (arrow). B: The posterior mass remains of water attenuation on the CMP contrast-enhanced images (12 HU); however, the anterior mass, which was subsequently diagnosed as a clear cell renal cancer (arrow), demonstrates brisk heterogeneous enhancement (up to 113 HU). |
In general, a renal mass can be considered as being definitely solid (and enhancing) on CT if it increases in attenuation by 20 HU or more (between the unenhanced and enhanced series). Most investigators agree that an increase in attenuation of 10 to 20 HU should be considered equivocal, and follow-up (preferably with MRI, which is more sensitive in detecting enhancement) is warranted. In one recent study, 20 (17%) and 4 (3%) of 116 renal cancers did not enhance by 15 HU or more on CMP images alone and both corticomedullary and NP images, respectively. In this series, if the threshold was increased to 20 HU to define enhancement, the number of renal
cancers that did not enhance increased to 24 (21%) and 11(9%). Only masses that increase in attenuation by 10 HU or less should be considered as truly nonenhancing; however, even this threshold is not absolute. Some hypoenhancing renal cancers may increase in attenuation by <10 HU (Fig. 6.4). Once again, it is essential that any renal mass be assessed for heterogeneity on contrast-enhanced CT images. Most, but not all, nonenhancing or equivocally enhancing renal cancers will not be completely homogeneous. MRI is more sensitive for detecting enhancement. In some series, even those solid renal masses that did not demonstrate an increase in attenuation between nonenhanced and enhanced series on CT could be seen to enhance on subtraction MR images (Fig. 6.5).
cancers that did not enhance increased to 24 (21%) and 11(9%). Only masses that increase in attenuation by 10 HU or less should be considered as truly nonenhancing; however, even this threshold is not absolute. Some hypoenhancing renal cancers may increase in attenuation by <10 HU (Fig. 6.4). Once again, it is essential that any renal mass be assessed for heterogeneity on contrast-enhanced CT images. Most, but not all, nonenhancing or equivocally enhancing renal cancers will not be completely homogeneous. MRI is more sensitive for detecting enhancement. In some series, even those solid renal masses that did not demonstrate an increase in attenuation between nonenhanced and enhanced series on CT could be seen to enhance on subtraction MR images (Fig. 6.5).
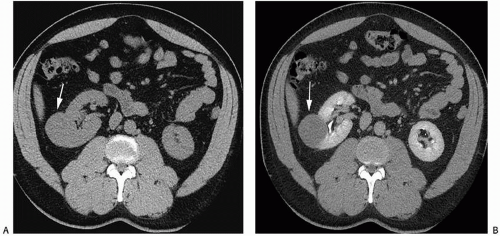 FIGURE 6.4. Nonenhancing papillary renal cancer. A: A homogeneous right renal mass measures 27 HU on precontrast axial images (arrow). B: After contrast material administration, the mass, which remains homogeneous, increases to measure 35 HU (arrow). This increment of 8 HU is not sufficient to diagnose this lesion as solid and enhancing. |
Angiomyolipoma
Angiomyolipomas (AMLs) are tumors composed of a mixture of mature adipose tissue, thick-walled blood vessels, and sheets of smooth muscle. The amount of each component varies in each tumor. AMLs belong to a group of tumors classified as perivascular epithelioid cell tumors or PEComas. The vast majority of these tumors are benign. They are generally seen in two groups of patients: (1) as small isolated renal masses in middle-aged or older women and (2) in up to 80% of patients with tuberous sclerosis (in which case the tumors are often multiple and are equally likely to occur in men and women). The AMLs associated with tuberous sclerosis also occur at a younger age and tend to be larger in size than the sporadic lesions.
 FIGURE 6.5. Minimal enhancement in a right renal mass seen only on subtraction MR images. A: T1-weighted axial image demonstrates a high T1 signal intensity mass in the posterolateral aspect of the right kidney (arrow). B: Following contrast material administration, the mass again has high signal intensity on this T1-weighted axial image; however, it appears slightly heterogeneous. It is difficult to determine whether the mass is enhancing, given its intrinsic T1 hyperintensity. C: A subtraction axial image reveals that the mass contains a thickened enhancing septation centrally (arrow). |
Manifestations of tuberous sclerosis include epilepsy, mental retardation, hamartomas (which may be cerebral), and retinal phakomas. Adenoma sebaceum may be seen in the malar areas of the face. Patients may also develop intrahepatic AMLs. In addition to renal AMLs, renal abnormalities in patients with tuberous sclerosis may also include the development of multiple renal cysts. Tuberous sclerosis is caused by an autosomal dominant inherited gene mutation, with variable expressivity. In some patients, the clinical syndrome is incompletely manifest.
Nonetheless, the presence of multiple AMLs with or without associated renal cysts on imaging studies should raise the possibility of tuberous sclerosis.
Nonetheless, the presence of multiple AMLs with or without associated renal cysts on imaging studies should raise the possibility of tuberous sclerosis.
Renal AMLs are also found in approximately 15% of patients with lymphangiomyomatosis. Lymphangiomyomatosis, which is considered by many to be a forme fruste of tuberous sclerosis, is an idiopathic disease that occurs in young women. It consists of smooth muscle hamartomas along the lymphatic system. It most commonly involves intrathoracic lymphatics, but abdominal involvement can be extensive. The pulmonary findings are diffuse and include a reticular or reticulonodular pattern and multiple small cysts, with a honeycomb-like appearance.
Most patients with AMLs have no symptoms; however, patients with large tumors may present with abdominal fullness or pain. Patients who develop hemorrhage, the most common and potentially clinically significant complication, can present with sudden back or flank pain, hypotension, and/or hematuria. Hemorrhage is more likely to occur when AMLs exceed 4 cm in maximal diameter and/or in tumors that contain more and larger renal artery branch aneurysms.
About 95% of AMLs contain enough macroscopic fat to produce characteristic findings on imaging studies. On plain abdominal radiography, some large AMLs may contain enough fat to produce an area of increased radiolucency. Calcification is seldom seen with conventional radiography or on other imaging studies, but may rarely be present, usually as a result of previous hemorrhage.
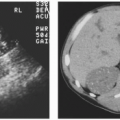
On ultrasonography, most AMLs are very echogenic (Figs. 6.6 and 6.7). Hypoechoic areas are occasionally encountered within an echogenic mass, however, possibly resulting from prior hemorrhage. It should be noted, however, that small renal cancers may also be echogenic (Fig. 6.8). Therefore, hyperechogenicity cannot be used to establish a definite diagnosis of AML. Some AMLs may also demonstrate posterior shadowing, a finding not encountered posterior to renal cancers (Fig. 6.9). Conversely, an anechoic rim or halo is sometime present around hyperechoic renal carcinomas, but has not been seen surrounding AMLs.
Both CT and MRI can be used to make diagnoses of AML with certainty in most instances. On CT, the detection of any component of a solid renal mass that measures fat attenuation is considered to
be definitive. In general, macroscopic fat can be identified if any measured component of a solid renal mass measures -10 HU or less (Figs. 6.10, 6.11 and 6.12). Examination of a small fatty renal mass by CT must be performed carefully to avoid volume averaging of a solid mass not containing any macroscopic fat with adjacent perinephric fat and a false low-density reading. Additionally, volume averaging of an AML containing macroscopic fat with adjacent normal renal parenchyma can create a false high density reading (Fig. 6.13). Other approaches for identifying small amounts of fat (such as counting individual pixels or pixel distribution) remain controversial and have not been widely accepted.
be definitive. In general, macroscopic fat can be identified if any measured component of a solid renal mass measures -10 HU or less (Figs. 6.10, 6.11 and 6.12). Examination of a small fatty renal mass by CT must be performed carefully to avoid volume averaging of a solid mass not containing any macroscopic fat with adjacent perinephric fat and a false low-density reading. Additionally, volume averaging of an AML containing macroscopic fat with adjacent normal renal parenchyma can create a false high density reading (Fig. 6.13). Other approaches for identifying small amounts of fat (such as counting individual pixels or pixel distribution) remain controversial and have not been widely accepted.
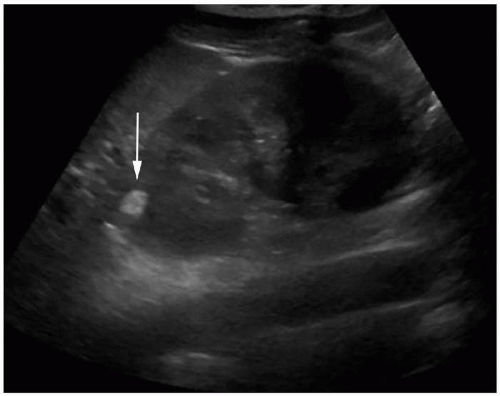 FIGURE 6.6. Ultrasound image of an AML. This longitudinal ultrasound image of the left kidney demonstrates a single echogenic mass in the upper pole in this middle-aged female (arrow). The appearance is characteristic but not diagnostic of a sporadic AML. |
 FIGURE 6.7. Ultrasound image of two AMLs. This longitudinal ultrasound image of a right kidney demonstrates two highly echogenic masses in this patient with tuberous sclerosis (arrows). Their appearance is characteristic, but not diagnostic of AMLs. |
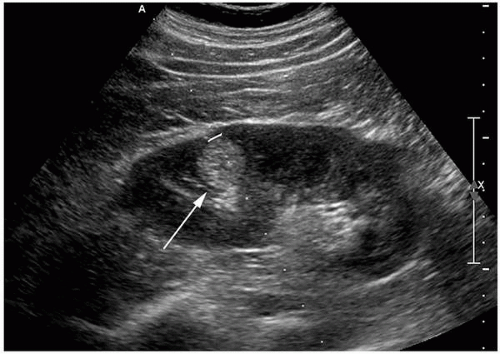 FIGURE 6.8. Ultrasound image of an echogenic renal cancer. This longitudinal image shows an echogenic renal mass (arrow). The appearance is suggestive of an AML; however, this lesion was subsequently diagnosed as a chromophobe renal cancer. |
 FIGURE 6.9. Ultrasound image of an AML with posterior shadowing. An echogenic mass in the lateral aspect of the upper pole of the right kidney demonstrates brisk posterior shadowing, a feature that has been described as being present only in AMLs (arrows). |
CT is occasionally performed in symptomatic patients with AMLs. Spontaneous hemorrhage can produce large acute perinephric hematomas or even active extravasation of blood if arterial phase contrast-enhanced images are acquired (Fig. 6.14). In some cases, the perinephric hematoma may be sufficiently large enough to obscure visualization of the bleeding tumor, in which case identification of the AML may require repeat imaging after the hematoma has resolved. For this reason, repeat 4- to 6-week follow-up imaging is recommended in any patient who has spontaneous subcapsular or perinephric hemorrhage if no cause of the hemorrhage can be visualized on the initial imaging study.
MRI can detect fat within an AML, also allowing for a definitive diagnosis to be made. The macroscopic fat in AMLs produces high signal intensity that is seen on both T1- and T2-weighted images. Most characteristic is the loss of signal intensity of components of macroscopic fat on fat-suppressed images (Fig. 6.15C). Chemical shift imaging may also be helpful, as a thin dark line, often termed “India ink” artifact, is usually seen at the interface between AMLs and adjacent renal parenchyma on opposed-phase images, with this line representing signal loss at a fat-fluid interface (Fig. 6.15A,B). While an entire AML may also lose signal on opposed-phase images, this feature is not as helpful for two reasons: (1) some AMLs do not lose signal (since they may contain a great deal of fat, but little fluid, with both of these components required for signal loss), and (2) some clear cell renal cancers can lose signal on these images (due to their containing a great deal of intracellular lipid) (Fig. 6.16).
Although macroscopic fat has occasionally been identified in other renal neoplasms, including renal cancer (often due to osseous metaplasia, in which case calcification is also often present), oncocytomas, Wilms tumor, and metastases, these are all considered to be case reportable exceptions (Fig. 6.17). For this reason, any
mass that contains macroscopic fat on CT or MRI should be considered an AML, unless that mass contains calcification (a feature that can only be detected on CT). Additionally, sometimes, solid renal masses can engulf perinephric or renal sinus fat, creating the impression that the mass itself contains the fat. Only rarely, does this create confusion on CT.
mass that contains macroscopic fat on CT or MRI should be considered an AML, unless that mass contains calcification (a feature that can only be detected on CT). Additionally, sometimes, solid renal masses can engulf perinephric or renal sinus fat, creating the impression that the mass itself contains the fat. Only rarely, does this create confusion on CT.
 FIGURE 6.10. CT image of an AML. An axial unenhanced CT image shows a large mass in the right kidney, which is almost entirely of fatty attenuation (with most components measuring < -10 HU). |
 FIGURE 6.11. CT images of an AML. Axial (A) and coronal (B) reformatted contrast-enhanced CT images demonstrate a small mass in the lateral aspect of the left kidney, which is of homogeneous fat attenuation (arrows). |
 FIGURE 6.12. CT image of multiple AMLs in a patient with tuberous sclerosis. A coronal reformatted contrast-enhanced CT image demonstrates multiple lobulated fatty attenuation masses, which have almost completely replaced normal renal parenchyma. |
 FIGURE 6.13. CT image of a tiny AML. An unenhanced thinsection axial CT image demonstrates a small AML in the upper pole of the left kidney (arrow). The macroscopic fat might not have been detected had thicker images been created or if contrast material had been administered. |
 FIGURE 6.14. CT image of a hemorrhagic AML. A contrast-enhanced axial CT image shows a large fatty mass in the posterior aspect of the left kidney (white arrow). A large perinephric hematoma is also present (black arrow). |
 FIGURE 6.15. MR images of an AML. A: In phase T1-weighted axial image demonstrates a homogeneous hyperintense mass in the posteromedial portion of the mid left kidney (arrow). B: The mass loses signal on an axial fat-suppressed image, confirming the presence of macroscopic fat and a diagnosis of AML. C: The mass remains hyperintense on opposed-phase gradient-echo images (arrow), a feature that can be seen in some, but not all AMLs. There is a thin black line or “India ink” artifact between the hyperintense mass and the normal renal parenchyma, another feature diagnostic of AML. |
 FIGURE 6.16. MR images of a renal cancer that loses signal on opposed-phase images. A: Phase axial MR image shows a solid appearing heterogeneous mass in the left kidney (arrow). B: The mass loses signal on an opposed-phase image obtained at the same level (arrow). This lesion was subsequently diagnosed as a clear cell renal cancer. |
Both lipomas and liposarcomas usually also contain CT-detectable macroscopic fat. These neoplasms can usually be distinguished from AMLs, because the former create smooth impressions on the kidney, while the latter create a defect in the renal contour (indicating the site at which they originated) (Figs. 6.18 and 6.19). Also, AMLs are usually hypervascular lesions, demonstrating large enhancing vessels on contrast-enhanced CT, while lipomas and liposarcomas are hypovascular.
Several variants of AMLs have been described. Up to 5% of all AMLs contain little or no fat. For this reason, the absence of fat does not exclude the diagnosis of AML. These tumors are referred to as lipid-poor or minimal fat-containing AMLs. On ultrasonography, lipid-poor AMLs are often isoechoic rather than echogenic (Fig. 6.20A). On CT, AML without detectable fat usually appear as homogenous tumors with attenuation higher than normal renal parenchyma (Fig. 6.20B). By definition, these lesions do not contain any identifiable macroscopic fat, as seen on either CT or MRI (Fig. 6.20C). They may demonstrate homogeneous enhancement after the intravenous administration of contrast material (Fig. 6.21). These lesions cannot be distinguished from other nonfat-containing renal masses, including renal cancers.
 FIGURE 6.17. Macroscopic fat in a renal cancer. A: An axial contrast-enhanced CT image shows a large solid heterogeneous mass in the upper pole of the right kidney. B: A more caudally obtained axial image shows a small centrally located area of macroscopic fat, as well as several punctate calcifications. This combination of findings makes renal cancer with osseous metaplasia more likely than AML (since AMLs rarely contain calcification). |
There are several rare histologic types of AML. Epithelioid AMLs are composed partially or entirely of epithelioid cells having abundant neoplasm. Most of these lesions behave as benign lesions; however, approximately one-third of these AML subtypes have aggressive features. On histology, these lesions contain two
or more mitotic figures per high-power field. Although epithelioid AMLs are probably less likely to contain identifiable macroscopic fat on cross-sectional imaging studies (Fig. 6.22), at least some of these tumors do have visible fat (Fig. 6.23), making distinction from other types of AML impossible. Clinically, these tumors can invade the renal veins or inferior vena cava and can even metastasize distantly. Thus, when a fatty mass appears to be behaving aggressively on CT or MRI (extending locally into other organs or growing into the inferior vena cava), a diagnosis of epithelioid AML should be considered (Fig. 6.24).
or more mitotic figures per high-power field. Although epithelioid AMLs are probably less likely to contain identifiable macroscopic fat on cross-sectional imaging studies (Fig. 6.22), at least some of these tumors do have visible fat (Fig. 6.23), making distinction from other types of AML impossible. Clinically, these tumors can invade the renal veins or inferior vena cava and can even metastasize distantly. Thus, when a fatty mass appears to be behaving aggressively on CT or MRI (extending locally into other organs or growing into the inferior vena cava), a diagnosis of epithelioid AML should be considered (Fig. 6.24).
 FIGURE 6.18. Large exophytic AML. A contrast-enhanced axial CT image demonstrates a large fatty mass intimately associated with the left kidney. There is a pronounced defect in the lateral aspect of the kidney, indicating the site of origin. The mass also contains several large vessels. |
 FIGURE 6.19. Large perinephric liposarcoma. A contrastenhanced coronal reformatted CT image demonstrates a large fatty mass intimately associated with the left kidney. The mass has a smooth impression on the kidney, No renal cortical defect could be identified on this or other images. |
 FIGURE 6.20. Lipid-poor AML. A: A longitudinal ultrasound image shows a small isoechoic exophytic mass in the lower pole of the left kidney (arrow). B: An unenhanced axial CT image shows the mass to be of soft tissue attenuation (arrow). There is no visible macroscopic fat. The mass also has higher attenuation than normal renal parenchyma. C: T1-weighted MR image shows the mass to be isointense to the normal renal parenchyma (arrow). There is no area of T1 hyperintensity, a feature characteristic of fat. |
Another AML variant is the AML with epithelial cysts (AMLEC). These tumors, which are benign, contain both solid and cystic elements, both of which can be visualized on cross-sectional imaging
studies. Macroscopic fat has not been described in these lesions. For this reason, AMLECs can be confused with cystic renal cancers.
studies. Macroscopic fat has not been described in these lesions. For this reason, AMLECs can be confused with cystic renal cancers.
 FIGURE 6.21. Lipid-poor AMLs in a patient with tuberous sclerosis. A contrast-enhanced axial CT image shows brisk enhancement of bilateral lipid-poor AMLs (arrows). |
Treatment of isolated/solitary AMLs is unnecessary in asymptomatic patients with lesions that measure up to 4 cm in maximal diameter. Partial nephrectomy is recommended by many urologists for AMLs exceeding 4 cm in diameter, due to their increased propensity to bleed. As an alternative, selective arterial embolization may be performed in patients with large tumors, if they are not considered amenable to partial nephrectomy. Should hemorrhage occur, prompt catheter embolization is often effective. Surgical treatment is much more problematic in patients with tuberous sclerosis, when many AMLs may be present. Recently, it has been found that some chemotherapeutic agents can be effective in reducing AML size in such patients. Specifically, mammalian target of rapamycin (mTOR) inhibitors, such as temsirolimus, have been used in this setting. These agents
have been observed to reduce tumor volumes by 50% or more in nearly half of the treated patients, with response being greatest during the first year of treatment (beginning at about 3 months) (Fig. 6.25). Of course, mTOR inhibitors are not without side effects, which include stomatitis, hyperlipidemia, amenorrhea, and increased susceptibility to infection.
have been observed to reduce tumor volumes by 50% or more in nearly half of the treated patients, with response being greatest during the first year of treatment (beginning at about 3 months) (Fig. 6.25). Of course, mTOR inhibitors are not without side effects, which include stomatitis, hyperlipidemia, amenorrhea, and increased susceptibility to infection.
 FIGURE 6.22. Epithelioid AML without macroscopic fat. A contrast-enhanced axial CT image demonstrates an exophytic homogeneous solid mass projecting medially from the upper pole of the left kidney (arrow). |
 FIGURE 6.23. Epithelioid AML with macroscopic fat. A contrast-enhanced axial CT image demonstrates a large mass involving the lower pole of the right kidney. The mass, which contains both soft tissue and fatty components, is indistinguishable from any other AML. |
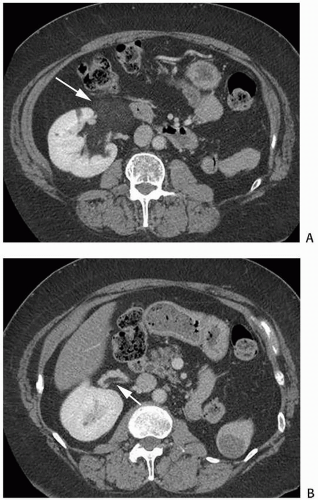 FIGURE 6.24. AML invading the renal vein. A: A contrast-enhanced axial CT image shows a relatively homogeneous fat attenuation mass growing exophytically into the renal sinus from the mid right kidney (arrow). B: An axial CT image obtained slightly more cephalically shows that there is a small amount of fatty attenuation tumor thrombus extending into the right renal vein (arrow). |
 FIGURE 6.25. Response of AMLs to mTOR inhibitors in a patient with tuberous sclerosis. A: A contrast-enhanced axial CT image in a patient with tuberous sclerosis demonstrates multiple bilateral renal masses, all suspected to be AMLs, some containing macroscopic fat and others being lipid poor. This includes the two masses demarcated with arrows. The patient was started on the mTOR inhibitor everolimus. There is embolization material in one of the AMLs in the right kidney. B: Three months later, many of the AMLs have decreased in size, including the two previously annotated lesions. |
Solid Renal Masses without Macroscopic Fat
Many renal masses do not contain any identifiable fat. Most of these non-fat-containing renal masses represent renal cancers; however, up to 20% of solid renal masses measuring 4 cm or less and nearly 50% of solid renal masses measuring 1 cm or less in size have been found to be benign. The odds that a large renal mass is a cancer are much higher, with nearly 95% of solid renal masses exceeding 7 cm in diameter being malignant.
While there have been a large number of studies attempting to analyze both CT and MRI features of non-fat-containing masses in an effort to identify imaging features, which allow for their differentiation from one another (including noncontrast attenuation or signal intensity, degree of enhancement, rate of enhancement, and pixel distribution on region of interest analysis), overall, these have not been very successful, due to overlap. Occasionally, however, some combinations of features may be suggestive, as will be discussed in the paragraphs that follow.
It should be emphasized that, to date, there is also no proof that differences in renal mass growth rate can be utilized to differentiate malignant from benign renal masses. Several studies have demonstrated that malignant and benign renal masses frequently enlarge at similar rates. Some researchers have recommended that growth of a renal mass should only be considered suspicious when it exceeds 5 mm within a 12 month period of time.
In recent years, there has been a concerted movement toward performance of percutaneous biopsy to determine the nature of small non-fat-containing solid renal masses. Biopsies can be performed safely in the vast majority of patients, with a low complication rate and little risk of significant bleeding or seeding along the tumor tract.
Renal Cancer
Renal cell carcinoma (RCC) is twice as common in men as in women. This tumor may occur at any age, but the incidence peaks in the sixth decade. No specific etiologic agents are recognized, but there is an as much as 50% increased incidence in patients who use tobacco and an increased incidence in patients with obesity and uncontrolled hypertension. RCC has been increasing worldwide, partly owing to the more frequent detection by imaging, but also to an increase in the prevalence of risk factors. There is also a fourfold increase in the incidence of the disease in first-degree family members of patients with RCCs. This is largely because about 5% to 10% of renal cancers are believed to develop in patients with hereditary renal cancer syndromes, including von Hippel-Lindau (VHL) disease, hereditary papillary renal cancer, hereditary leiomyomatosis renal cancer syndrome, Birt-Hogg-Dube, hereditary succinate dehydrogenase-deficient renal cell cancer, and Lynch syndrome.
Also, patients on chronic hemodialysis or peritoneal dialysis nearly always eventually develop acquired renal cystic disease (see Chapter 8). These patients have an incidence of renal carcinoma of approximately 7%, although not all of these tumors behave in a biologically aggressive manner. Tumors in patients with acquired cystic disease of dialysis begin to appear in patients as early as 3 years after initiation of dialysis. They can be difficult to detect because these patients’ kidneys are not functioning and usually contain multiple cysts and dystrophic calcifications. The incidence of renal tumors seems to parallel the development of acquired cystic disease, such that more tumors are seen the longer the patients are maintained on dialysis. The effect of renal transplantation on the development of renal cancer is unclear. Although it is likely that successful transplantation reduces the risk of renal carcinoma, this is counterbalanced by the increased risk of malignancy with immunosuppression.
The classic clinical presentation of renal cancer, of a flank mass, pain, and hematuria occurs in only a minority of patients. As abdominal computed tomography (CT) and ultrasound examinations are commonly performed for a variety of nonrenal indications, the vast majority of renal tumors are now discovered incidentally in patients who are asymptomatic.
Among symptomatic patients, hematuria is the most common sign, occurring in more than 50% of patients. Flank pain, present in more than one-third of patients, is probably caused by distension of the renal capsule. A flank mass is palpable at presentation in approximately one-third of patients with large tumors.
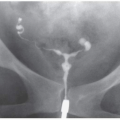
Occasionally, patients with large renal tumors may first complain of nonspecific symptoms such as weight loss, fatigue, or even gastrointestinal or neurologic symptoms. Less common presenting complaints include fever or a new left-sided varicocele (Fig. 6.26). Fatigue may be caused by a normochromic normocytic anemia. A variety of hormones may be secreted by
RCCs in sufficient quantity to cause distinct clinical manifestations, including renin, erythropoietin, parathyroid hormone, adrenocorticotropic hormone, prolactin, and gonadotropin (Table 6.1).
RCCs in sufficient quantity to cause distinct clinical manifestations, including renin, erythropoietin, parathyroid hormone, adrenocorticotropic hormone, prolactin, and gonadotropin (Table 6.1).
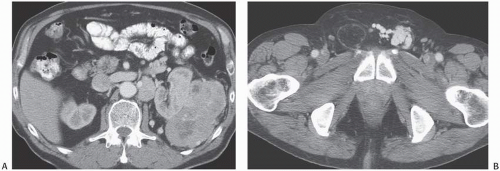 FIGURE 6.26. Renal cancer presenting as a varicocele. A patient with a large left renal tumor (A) presented with a varicocele of the left testes (B). |
It is difficult to predict the natural history of renal carcinoma. Some tumors demonstrate aggressive behavior by growing rapidly and metastasizing early. However, occasional patients may live for years with an untreated primary tumor. Small tumors, in particular, may show only minimal growth when followed over many years. Metastases generally occur when tumors are larger than 5 cm and are extremely rare when tumors are <3 cm in diameter. Metastases may be present at the time of initial presentation, but have also been reported to first appear as late as 31 years after nephrectomy. Spontaneous regression of metastases or the primary tumor may also occur.
Classification
Although it is now understood that renal cortical neoplasms are a family of differing neoplasms with distinct cytogenetic and molecular defects and differing prognoses and morbidities, assessment of histologic grade is similar for all primary renal cancers. The Fuhrman nuclear grading system is usually used to characterize renal cancer aggressiveness and has been shown to have an excellent correlation with staging and survival. The system ranges from grade 1 (small uniform nuclei) to grade 4 (severe nuclear anaplasia).
In recent years, the number of known distinct histologic types of renal cancers has expanded dramatically, particularly with the advent of genetic sequencing and multiple immunohistochemical stains. The 2016 World Health Organization classification is provided in Table 6.2. By far, the most common renal cancers are of the clear cell type, with these tumors accounting for nearly 70% of renal cancers. About 10% to 15% of renal cancers are then of the papillary type, with most papillary tumors behaving much less aggressively than most clear cell renal cancers. For this reason, in general, the majority of patients with papillary cancers have a better prognosis than do patients with clear cell cancers of similar size. Chromophobe renal cancers are the third most common type, accounting for 5% of renal cancer cases. There are many other rare types of renal cancers, including collecting duct carcinomas and renal medullary carcinoma (both of which behave very aggressively and which have a very poor prognosis), multilocular cystic renal neoplasms of low malignant potential, tubulocystic renal cancers, microphthalmia/TFE (MiT) gene family translocation renal cancers (which includes the Xp11 cancers), and unclassified tumors. As yet more genetic mutations in renal cancers are identified, there will likely be further modifications in the renal cancer histologic classification system.
TABLE 6.1 Endocrine Manifestations of Renal Adenocarcinoma | ||||||||||||||
|---|---|---|---|---|---|---|---|---|---|---|---|---|---|---|
|
TABLE 6.2 Classification of Renal Tumors | ||||||||||||||||
|---|---|---|---|---|---|---|---|---|---|---|---|---|---|---|---|---|
|
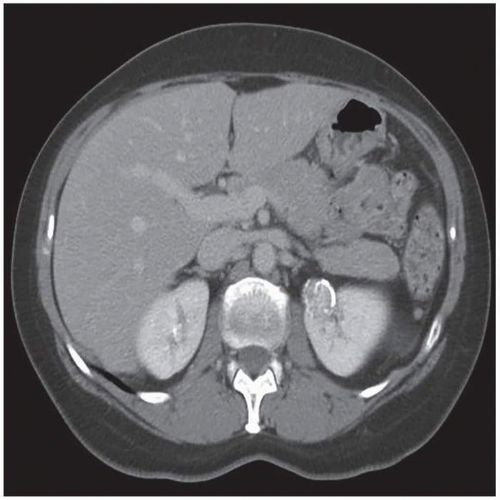 FIGURE 6.27. Solid renal cancer with dystrophic calcification. A contrast-enhanced axial CT image in a patient with a renal cancer demonstrates extensive dystrophic calcification within a minimally heterogeneous solid renal mass. Although some of the calcification is peripheral, some components are quite thick. Also, several calcifications are centrally located. |
General Imaging Features of Renal Cancers
Most renal cancers appear as solid enhancing heterogeneous masses (with components measuring between 20 and 70 HU on unenhanced CT). Cystic renal cancers are not uncommon, however. In many instances, the correct diagnosis of a malignant rather than benign cystic renal mass can be suggested, because cystic cancers often demonstrate thickened enhancing walls or enhancing mural nodules. It is likely that there are pathologic mechanisms resulting in the unique cystic RCCs: intrinsic multiloculated growth, intrinsic unilocular growth (cystadenocarcinoma), cystic necrosis, and an origin from the epithelial lining of a pre-existing simple cyst. Three radiologic patterns of cystic RCC have been described: unilocular cystic mass, multiloculated cystic mass, and discrete mural nodule in a cystic mass.
Calcification can be detected on CT in many renal cancers. Calcification is not a specific finding, however, as it may also be seen in other renal masses, including benign cysts. The character of the calcification can be helpful in determining the etiology of a renal mass, however. Thin peripheral curvilinear calcification is more commonly seen in a cyst, whereas central or thick mural calcification means the lesion is more likely a renal carcinoma (Figs. 6.27, 6.28 and 6.29). If a mass or component of a mass is partially located in the collecting system, the lesion is more likely to represent a urothelial carcinoma that has invaded the renal parenchyma rather than an RCC that invades the collecting system (Fig. 6.30), although in some instances, distinguishing a centrally located renal cancer from a urothelial cancer may be difficult (Fig. 6.31). On MRI, the T1 and T2 features and measured diffusion and contrast-enhanced signal characteristics of renal carcinomas vary with the vascularity of the tumor and the presence or absence of central necrosis, calcification, hemorrhage, and iron deposits, as well as the type of renal tumor that is present.
Perinephric hemorrhage may be the presenting sign of a renal tumor in some renal cancer patients (Fig. 6.32). While AMLs can bleed spontaneously, so can cancers. In fact, the most common cause of spontaneous perinephric hemorrhage in patients who are not being anticoagulated is one of these types of renal neoplasms.
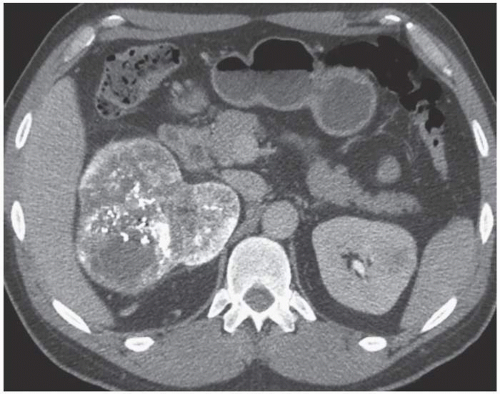 FIGURE 6.28. Solid renal cancer with dystrophic calcification. A contrast-enhanced axial CT image in a patient with a renal cancer demonstrates extensive dystrophic calcification within a large heterogeneous predominantly solid renal mass. Most of the calcification is centrally located. |
CT FEATURES OF RENAL CANCER
Typically exophytic but may be intrarenal or an infiltrative mass.
May be hypervascular and heterogeneous (conventional) or homogeneous; poorly enhancing tumors are more likely to be papillary.
Typically discovered as an incidental finding.
Best characterized on nephrographic or excretory phase images.
MRI FEATURES OF RENAL CANCER
Sensitivity similar to CT; but ability to detect enhancement superior to CT.
Homogeneous tumors may be isointense with parenchyma on T1- and T2-weighted sequences (low T2 signal intensity should suggest papillary type).
Opposed-phase signal loss should suggest clear cell type.
May be hypervascular and heterogeneous (conventional) or homogeneous and poorly enhancing (papillary).
Imaging Features of Different Types of Renal Cancer
Clear Cell Renal Cancers
Histologically, clear cell renal cancers have abundant clear cytoplasm with a predominant alveolar architecture. On imaging studies, clear cell cancers are usually solid heterogeneous masses,
although they can occasionally be homogeneous. Most clear cell cancers demonstrate brisk enhancement, due to the fact that the majority are very hypervascular. On CT and MRI, clear cell renal cancers tend to show much greater enhancement than other renal tumors on images obtained during the CMP phase (Fig. 6.33). As has been mentioned previously, clear cell renal cancers may demonstrate opposed-phase signal loss on chemical shift MR images, due to the extensive amount of intracellular lipid that is present in most tumors (Fig. 6.16).
although they can occasionally be homogeneous. Most clear cell cancers demonstrate brisk enhancement, due to the fact that the majority are very hypervascular. On CT and MRI, clear cell renal cancers tend to show much greater enhancement than other renal tumors on images obtained during the CMP phase (Fig. 6.33). As has been mentioned previously, clear cell renal cancers may demonstrate opposed-phase signal loss on chemical shift MR images, due to the extensive amount of intracellular lipid that is present in most tumors (Fig. 6.16).
 FIGURE 6.29. Cystic renal cancer with peripheral calcification. Noncontrast (A) and nephrographic phase (B) images show a cystic mass in the upper pole of the left kidney with thick mural calcification. Multiple enhancing tumor nodules are seen on a contrast-enhanced image. |
Papillary Renal Cancers
On histologic examination, papillary renal cancers typically have a frondlike appearance and contain a central fibrovascular core on histologic examination. Papillary renal cancers often demonstrate highly suggestive imaging features on CT and MRI. On unenhanced CT, papillary cancers often measure above the attenuation of normal renal parenchyma (a feature also seen with many lipid-poor AMLs). On contrast-enhanced CT or MRI, papillary cancers are often homogeneous. They frequently enhance less and on a more delayed basis than do other renal neoplasms (a feature which allows many of these tumors to be distinguished from briskly and rapidly enhancing lipid-poor AMLs) (Fig. 6.34). Papillary renal cancers do not enhance maximally until the nephrographic or excretory phases. On MRI, papillary cancers often are hypointense on T2-weighted images, a feature
uncommonly seen in clear cell renal cancers (Figs. 6.35 and 6.36). Some papillary renal cancers can have predominantly cystic features (Fig. 6.37).
uncommonly seen in clear cell renal cancers (Figs. 6.35 and 6.36). Some papillary renal cancers can have predominantly cystic features (Fig. 6.37).
 FIGURE 6.30. Centrally located urothelial cancer. A centrally located solid mass in the right renal sinus, seen on this corticomedullary phase axial CT image, was subsequently confirmed to be a urothelial cancer. The high attenuation focus within the mass represents portion of the tip of a ureteral stent. |
 FIGURE 6.31. Centrally located renal cancer. A centrally located solid mass in the right renal sinus, seen on this excretory phase CT image, was subsequently confirmed to be a renal cancer. Differentiation from a urothelial cancer is difficult, although renal cancers can often be seen to displace, but not distort, the renal collecting system. They are also much more likely to invade the renal vein. |
 FIGURE 6.32. Renal cancer presenting with acute hemorrhage. A: An axial unenhanced CT image shows high attenuation acute perinephric hemorrhage surrounding the left kidney. B: The underlying renal mass is identified on this contrast-enhanced image obtained several centimeters more cephalad. |
Some investigators divide papillary renal cancers into two major subtypes. Type 1 papillary tumors are of low grade (Fuhrman grade 1 or 2) and have a small amount of basophilic to clear cytoplasm. These are slow-growing tumors, which have a better prognosis than do clear cell renal cancers or type 2 papillary renal cancers (Figs. 6.35 and 6.36). Type 2 papillary tumors are higher-grade neoplasms (Fuhrman grade 3 or 4) and contain abundant eosinophilic neoplasm. Patients with type 2 papillary tumors have a much worse prognosis. It is controversial whether or not type 1 and type 2 papillary cancers can be differentiated from one another based upon their imaging appearance; however, a few studies have suggested that tumor heterogeneity, indistinct margins, and T2 heterogeneity are more commonly in MRI
examinations of patients with type 2 tumors than in patients with type 1 tumors (Fig. 6.38).
examinations of patients with type 2 tumors than in patients with type 1 tumors (Fig. 6.38).
 FIGURE 6.33. Renal cancer: clear cell type. A contrast-enhanced axial MR image obtained during the nephrographic phase shows a large briskly enhancing clear cell renal cancer in the posterior aspect of the mid left kidney. |
 FIGURE 6.34. Renal cancer: papillary type. A: Unenhanced axial CT image shows an exophytic renal mass with an attenuation of 40 HU. While many papillary cancers have an unenhanced attenuation exceeding that of normal parenchyma, this mass is relatively isoattenuating to normal renal parenchyma. B: On the contrast-enhanced axial CT image, the mass is seen to be poorly enhancing. The mass increases to only 60 HU. Because of this low level of enhancement and the homogeneous appearance of the mass, confusion with a mildly hyperdense renal cyst may occur. |
 FIGURE 6.35. Renal cancer: papillary type 1. Axial MR images of a type 1 papillary renal cancer show the cancer to be mildly hyperintense on a T1-weighted image (A, arrow), to be characteristically hypointense on a fat suppressed T2-weighted image (B, arrow), to be relatively poorly enhancing on a fat suppressed T1-weighted image obtained after gadolinium-based contrast material administration (C, arrow), and to have restricted diffusion on diffusion-weighted images (D, arrow). |
 FIGURE 6.36. Renal cancer: papillary type 1. Axial MR images demonstrate a right renal papillary cancer, which is isointense to slightly hypointense relative to the adjacent kidney on T1-weighted (A) and fat suppressed T2-weighted (B) images and which is homogeneous and hypoenhancing on a T1-weighted nephrographic phase image obtained after contrast material administration (C). |
 FIGURE 6.37. Renal cancer: cystic papillary type. Axial contrast-enhanced CT image in a patient with multiple cystic papillary cancers demonstrates near water attenuation central components. Most of the lesions have a thick enhancing rim of tissue. |
Unfortunately, up to one-third of papillary renal cancers cannot be classified as belonging to the type 1 or type 2 groups, due to the presence of confusing histologic features, including a more aggressive appearance and higher grade of tumors with otherwise type 1 histology, a less aggressive appearance and lower grade of tumors with otherwise type 2 histology, and/or the presence of clear and papillary cells. This has created some debate about whether this subtyping should be used at all.
 FIGURE 6.38. Renal cancer: papillary type 2. A: Axial contrast-enhanced CT images show type 2 papillary cancer projecting exophytically from the posterior aspect of the left kidney (arrow). This papillary cancer is heterogeneous and has indistinct margins, features more commonly seen in type 2 tumors. B: A CT image obtained several centimeters more cephalad shows both lymph node and left adrenal metastases (arrows), which have developed despite the relatively small size of the primary tumor. |
Hereditary papillary renal cell carcinoma (HPRCC) is an autosomal dominantly inherited disease in which patients develop multifocal papillary renal cancers, usually classified as type 1 tumors (Fig. 6.39). As with other type 1 papillary renal cancers, HPRCC tumors metastasize less frequently than do clear cell tumors; however, when metastases occur, they may behave aggressively.
Chromophobe Renal Cancers
Chromophobe renal cancers arise from medullary collecting ducts. These tumors, which are the third most common cell type of renal cancer, generally show a much more favorable course than do the other types of renal cancer. Histologically, chromophobe renal cancers are characterized by the presence of large polygonal cells. Birt-Hogg-Dube syndrome is associated with inherited renal neoplasms also characterized by hair follicle hamartomas and frequent pneumothoraces from rupture of thin-walled lung cysts. Patients with this syndrome often develop chromophobe renal tumors or mixed chromophobe tumors and oncocytomas. No distinctive imaging features of chromophobe renal cancers have been identified (Figs. 6.40 and 6.41).
Clear Cell Papillary Renal Cancers
The fourth most common type of renal cancer is now believed to be the mixed clear cell papillary or clear cell tubulopapillary cancer. This cancer, which is generally slow growing and which rarely metastasizes distantly, can occur sporadically, but is often encountered in patients with end-stage renal disease. At the present time, no imaging features have been identified, which allow it to be differentiated from other renal cancers (Fig. 6.42).
Multilocular Cystic Neoplasms of Low Malignant Potential
There are several even more rare types of renal neoplasms. Multilocular cystic neoplasms of low malignant potential are very-low-grade tumors and have not been reported to metastasize. On cross-sectional imaging studies, these tumors tend to appears as complex cystic masses, with many being classified as Bosniak category III or IV lesions. Septal thickening and mural calcification are often present (Fig. 6.43).
 FIGURE 6.39. Hereditary papillary renal cancer syndrome (HPRCC). A: Axial contrast-enhanced CT image shows a large hypoenhancing papillary cancer in the posterior aspect of the left kidney in a patient who has already had a right nephrectomy for a papillary renal cancer. B: An image obtained slightly more caudally demonstrates three other papillary cancers (arrows) in the same kidney. Patients with HPRCC often present with multiple papillary tumors at the same time.
Related posts:Stay updated, free articles. Join our Telegram channel
Full access? Get Clinical Tree
 Get Clinical Tree app for offline access

|