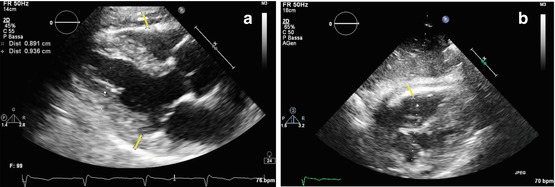
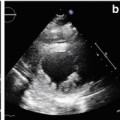
Fig. 19.1
(a, b) Echocardiographic findings in a patient with idiopathic restrictive cardiomyopathy. Severe left atrial and moderate right atrial dilation with normal ventricular dimensions and function. M-mode tracing on the left atrium (end-systolic diameter = 6.87 cm) (a); apical four-chamber view (b)
The disease can involve both the LV and RV [11]. Wall thickness is usually normal, but in some cases, it is possible to detect mild LV or RV wall hypertrophy [12]. Various degrees of systolic dysfunction with diffuse hypokinesis can be found in more advanced disease [11] (Clip 19.2). Functional mild-to-moderate mitral (MR) and tricuspid (TR) regurgitation are frequent (Clip 19.3) [8]. The inferior vena cava is dilated with reduced inspiratory collapse, the consequence of elevated right atrial (RA) pressure (Clip 19.4).
Typical echo-Doppler characteristics of the disease are severe diastolic dysfunction, with RFP interrogation of transmitral and/or tricuspid flow: there is a high, early diastolic E wave; a low, late diastolic A wave; and a short E-wave deceleration time, indicative of increased ventricular chamber stiffness (Fig. 19.2) [2–4, 11–13]. This transmitral and tricuspid flow pattern corresponds to the dip-plateau appearance (square root sign) of diastolic ventricular pressure curves at cardiac catheterization, i.e., abrupt, early diastolic increase of ventricular pressure followed by persistent high pressure during mid- and end-diastole (plateau) [7].
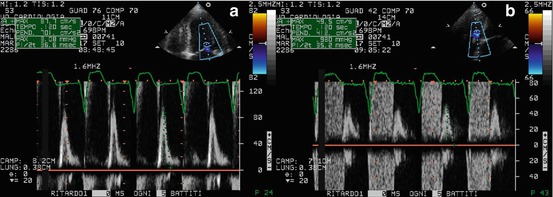
Fig. 19.2
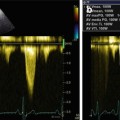
(a, b) Doppler interrogation of transmitral (a) and tricuspid (b) flow showing restrictive filling pattern in a patient with restrictive cardiomyopathy and atrial fibrillation. In both cases, E-wave deceleration time was reduced to 120 ms
Pulmonary venous-flow Doppler shows reduced systolic wave peak velocity, increased diastolic wave peak velocity with reduced deceleration time, and accentuated and prolonged end-diastolic retrograde wave due to LA contraction against high end-diastolic ventricular pressure [14]. A similar pattern can be observed at the level of hepatic vein flow, with reverse systolic waves in the presence of severe TR, and prolonged end-diastolic retrograde flow due to increased RV end-diastolic pressure [13].
Transmitral and pulmonary vein flow Doppler patterns demonstrate good correlation with LV end-diastolic and pulmonary-wedge pressure at cardiac catheterization [3, 13], providing a semiquantitative assessment of the hemodynamic severity of the disease.
In clinical practice, it is important to recall that in some patients with RCM, treatment with diuretics may normalize the filling pattern. In this situation, RFP can be unmasked after a fluid challenge.
Tissue Doppler imaging (TDI) can be useful in the diagnostic workup of patients with suspected RCM. TDI curves on the septal or lateral mitral annulus and basal LV segments typically show low velocities of both the systolic (S′) and the early diastolic (E′) wave (Fig. 19.3). The ratio of transmitral E velocity to mitral annular E′ velocity (E/E′) is therefore high, and this is an additional marker of elevated ventricular filling pressures. Furthermore, global reduction of TDI-derived annular velocities in RCM is a sign of intrinsic myocardial disease. However, it must be remembered that these abnormalities are nonspecific.
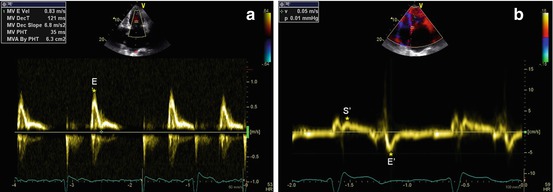
Fig. 19.3
(a, b) Patient with idiopathic restrictive cardiomyopathy. Doppler interrogation of transmitral valve (a) shows a restrictive filling pattern (E-wave velocity = 83 cm/s, E-wave deceleration time = 121 ms). Tissue Doppler imaging curve on the septal mitral valve annulus (b) shows low velocities of the systolic (S′ wave = 4 cm/s) and early diastolic (E′ wave = 5 cm/s) waves. E/E′ ratio is 16
The value of TDI in identifying initial alterations in myocardial contractility through reduced systolic velocities has been studied in RCM patients. In fact, TDI imaging was employed to evaluate longitudinal velocities at the LV lateral wall, interventricular septum (IVS), and RV in children with RCM and normal LV ejection fraction (EF): TDI peak velocities were significantly lower at the septum in RCM patients and could therefore identify global subclinical systolic dysfunction in this setting [15].
19.2.3 Other Imaging Techniques
To our knowledge, extensive and systematic studies on cardiac magnetic resonance (CMR) or other imaging techniques in this specific CMP are lacking in published literature considering the extreme rarity of this pathology. However, some information can be obtained from of studies on distinctive features between RCM and CP. RCM is characterized at CMR and computed tomography (CT) studies by small, nonhypertrophied ventricles with preserved systolic function, enlarged atria, and severe myocardial fibrosis in the absence of pericardial abnormalities. CMR late gadolinium enhancement (LGE) and/or T1 analyses can be employed to identify myocardial fibrosis, which is the histologic hallmark of this CMP.
19.2.4 Imaging in Prognosis and Patient Management
In RCM, prognosis mainly depends on the clinical stage of the disease, which can range from an early subclinical phase to the severe advanced stage. Early recognition and a correct and specific diagnosis are essential for prognostic stratification and choice of treatment, as there is no specific therapy for idiopathic RCM; pharmacologic therapy of certain underlying diseases (such as sarcoidosis and hemochromatosis) may be beneficial. Furthermore, the differential diagnosis with CP is crucial because pericardiectomy can be the definitive treatment in this pathologic condition when it is refractory to medical treatment [16].
Treatment of idiopathic RCM is aimed at reducing pulmonary and systemic congestion. This is best achieved by lowering venous pressure, controlling heart rate, increasing filling time, maintaining atrial contractions, correcting atrioventricular conduction disturbances, and avoiding anemia, nutritional deficiency, calcium overload, and electrolyte imbalance.
In idiopathic RCM, echocardiographic evaluation can contribute to prognostic stratification of patients. In fact, patients with severe LA enlargement (dimension >60 mm) have a poor prognosis, particularly if >70 years and with advanced NYHA class [8]. In a series of 94 patients [8] followed for a mean of 68 months, estimated overall survival was significantly lower than expected for an age- and gender-matched group (64 % vs 85 % at 5 years, and 37 % vs 70 % at 10 years). Approximately two-thirds of deaths were cardiovascular, primarily due to HF, SD, or cerebrovascular accident. Survival was not related to the presence of AF, LV systolic dysfunction, or findings on endomyocardial biopsy (EMB).
Another echocardiographic feature that is important in patient management is identifying, particularly in the advanced phase of the disease and in AF, thrombi within the atrial appendages [7] due to the risk of embolic stroke and indication of prophylactic anticoagulant therapy.
19.3 Differential Diagnosis Between Restrictive Cardiomyopathy and Constrictive Pericarditis
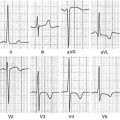
The clinical problem of distinction between RCM and CP is one of the most challenging in cardiology and in internal medicine, despite the advances in diagnostics and imaging techniques [17–19]. The first step in the diagnostic workup is clinical suspicion. RCM or, alternatively, CP must be hypothesized if a patient shows signs of congestive HF in the absence of significant LV systolic dysfunction or valvular heart disease. Clinical history may provide important clues for the correct diagnosis. In fact, the possibility of CP must be considered in patients with a history of tuberculosis, past cardiac surgery, mediastinal irradiation, or previous pericarditis. Physical examination and ECG are usually nonspecific, and the described clinical signs of CP are extremely subtle. Chest X-ray can be useful only when it shows pericardial calcifications, which are particularly frequent in tubercular CP but rare in the other forms.
Hemodynamically, CP is characterized by impaired diastolic filling caused by the outer restriction of the pericardium, which is rigid from fibrosis and/or inflammation. Consequently, an increase in ventricular interdependence is present, as is a dissociation between intrathoracic and intracardiac pressures, thus isolating the heart from normal respiratory changes in intrathoracic pressure [19].
Doppler echocardiography can help in CP diagnosis in its differentiation from RCM. Both RCM and CP show RFP, but in CP, peak early diastolic filling velocities (E waves) of the two ventricles change and are reciprocal with respiration: tricuspid E wave velocity increases in inspiration; mitral velocity E wave decreases (Fig. 19.4) [13, 20]. This is a sign of increased ventricular interaction due to the presence of an abnormally stiff pericardium, typical of this disease and absent in RCM [13, 20].
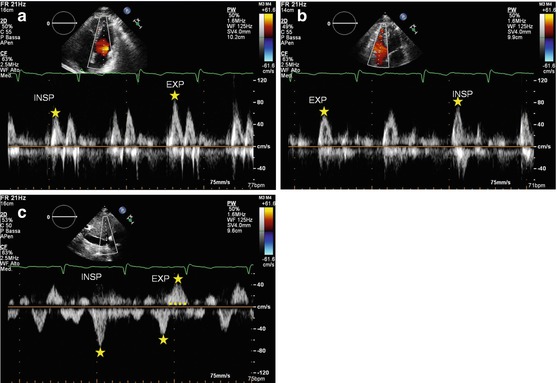
Fig. 19.4
(a–c) Patient with constrictive pericarditis. Mitral (a) and tricuspid (b) flow Doppler patterns show reciprocal respiratory variations: E-wave transmitral peak velocity increases with expiration; tricuspid E-wave peak velocity increases with inspiration. The hepatic vein flow Doppler (c) shows an increase in early diastolic wave velocity in inspiration and a prominent and prolonged end-diastolic reversal wave in expiration. INSP inspiration, EXP expiration
Furthermore, pulmonary vein flow evaluation by Doppler shows reduced forward flow during inspiration with a prominent systolic component in CP, whereas in RCM, the diastolic component is prevalent [21]. Finally, in CP hepatic vein flow on Doppler displays increase during inspiration and reduction in expiration, when there is a more prominent and prolonged end-diastolic flow reversal (Fig. 19.4) [20]. Conversely, in RCM, this flow reversal increases during inspiration.
It is important to keep in mind that some patients with CP do not demonstrate marked respiratory variations in Doppler velocities, particularly in the presence of very high filling pressure [22]. This abnormality can be unmasked by studying the patient in the upright position in order to decrease preload.
Additional echocardiographic indices have been proposed for the differential diagnosis between RCM and CP. For example, quantification of flow propagation in the LV cavity on color M-mode can be informative, and slope velocity >100 cm/s shows good accuracy in distinguishing between these two pathologies [23]. Moreover, pulmonary hypertension and diastolic MR are more likely found in RCM than in CP. On the other hand, typical characteristics of CP are abnormal diastolic septal motion with a leftward shift in inspiration, and flattening of the posterior wall in mid-diastole (Fig. 19.5, Clip 19.5) [24].
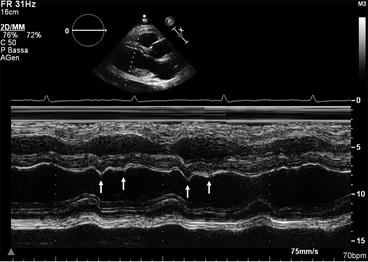
Fig. 19.5
M-mode trace in a patient with constrictive pericarditis. The posterior wall is flat during diastole, and the ventricular septum shows abnormal motion in inspiration (double arrows)
Pericardial thickness assessment is another useful feature in the differential diagnosis between RCM and CP (Fig. 19.6, Clip 19.6). In particular, measuring pericardial thickness using TEE shows good correlation with that performed by CMR [25].
Novel echocardiographic techniques are particularly useful in the differential diagnosis between RCM and CP. In contrast to the global reduction in TDI-derived annular velocities seen in RCM, CP is distinguished by preserved TDI annular velocities of the LV and RV free walls, as well as of the IVS (Fig. 19.7) [26]. Peak E′ wave velocity ≥8 cm/s (in either case the septal or lateral wall) has an excellent accuracy in differentiating CP from RCM [27]. Ha et al. [28] identified a condition called annulus paradoxus in patients with CP, i.e., a paradoxical inverse correlation between low E/E′ and elevated LV filling pressures. Furthermore, other authors demonstrated that in patients with CP, E′ at the lateral mitral annulus was lower than E′ at the medial or septal mitral annulus; this condition is called annulus reversus, ascribed to LV free wall tethering to the pericardium [29].
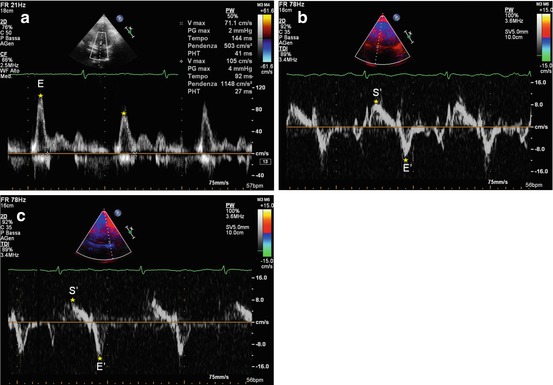
Fig. 19.7
(a–c) Patient with constrictive pericarditis. Doppler interrogation of transmitral valve (a) shows a restrictive filling pattern (E-wave velocity = 85 cm/s, E-wave deceleration time = 120 ms), with marked respiratory variations. Tissue Doppler imaging curve on the septal mitral valve annulus (b) shows normal systolic (S′ wave = 9 cm/s) and early diastolic (E′ wave = 10.1 cm/s) wave velocities. E/E′ ratio is 8. Tissue Doppler imaging curve on the lateral mitral valve annulus (c) shows normal systolic (S′ wave = 8 cm/s) and early diastolic (E′ wave = 11.3 cm/s) wave velocities. E/E′ ratio is 7
However, the diagnostic value of TDI-derived annular velocities may be limited to annular-based constriction [30]. Furthermore, TDI annular velocities are reduced in the presence of surgical annular rings, prosthetic mitral valves, and mitral annular calcification.
In this subset of patients, evaluation of segmental myocardial deformation using 2D speckle-tracking echocardiography might add useful information to discriminate between constrictive from restrictive physiology [18]. In a study evaluating myocardial mechanics using 2D speckle-tracking echocardiography in patients with CP and RCM, CP patients had reduced depressed longitudinal strain in the LV anterolateral wall and RV free wall but preserved strain in the LV septal wall. There was a significant inverse correlation between pericardial thickness detected by CMR and ventricular strain in adjacent segments [31]. Sengupta et al. [32] demonstrated that in RCM the prominent endocardial dysfunction with sparing of epicardial function causes abnormal longitudinal mechanics with relative sparing of circumferential and twist mechanics, whereas patients with CP have relatively preserved longitudinal LV mechanics and markedly abnormal circumferential deformation, torsion, and untwisting velocity (Fig. 19.8).
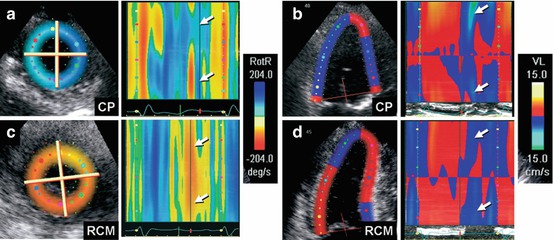
Fig. 19.8
(a–d) Color M-mode display of apical untwisting velocity [rotational rate of the left ventricular apex (RotR)], obtained from speckle-tracking imaging in short-axis view, demonstrates reduced early diastolic rate of untwisting in constrictive pericarditis (a, arrows), whereas longitudinal early diastolic velocities (VL) from the left ventricular base in apical four-chamber view (b, arrows) are normal. In contrast, patients with restrictive cardiomyopathy show a normal early diastolic rate of untwisting (c, arrows) and reduced longitudinal early diastolic velocities from the left ventricular base (d, arrows). CP constrictive pericarditis, RCM restrictive cardiomyopathy (From Sengupta et al. [32], with permission)
CMR and/or CT play a major role in the diagnostic workup of suspected CP or RCM (Fig. 19.9) [17–19]. Volume analysis in RCM reveals normal-sized ventricles with enlarged atria and normal pericardial thickness with normal myocardial contours. CP, on the other hand, is characterized by tubular or indented, smaller-sized ventricles, normal myocardial thickness, and increased pericardial thickness, which can be generalized or localized [17].
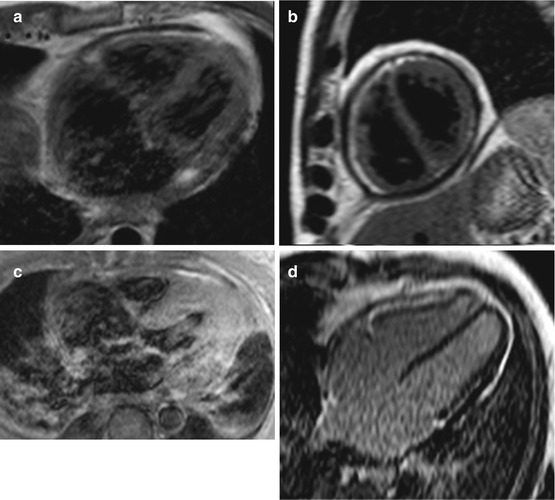
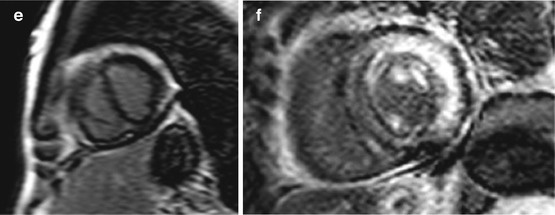
Fig. 19.9
(a–e) Examples of cardiac magnetic resonance (CMR) in differential diagnosis between restrictive cardiomyopathy (RCM) and constrictive pericarditis (CP). T1-weighted imaging showing pericardial thickening in CP axial (a) and short axis (b) and absence of pericardial thickening (c) in a case of RCM secondary to amyloid; axial image. Late gadolinium enhancement (LGE) imaging of CP showing absence of fibrosis in four-chamber (c) and short-axis (d) views. LGE imaging short-axis view, of RCM secondary to amyloid showing diffuse gadolinium infiltration; note septal flattening (in end-diastole) in short-axis views (b, e) in CP
Black-blood T1-weighed sequences are used to assess pericardial thickness [33]. Hyperintensity at T2-weighed black-blood sequences [34] and T1-weighted sequences after gadolinium administration [35] are indicative of active myocardial and pericardial inflammation, whereas hyperintensity at LGE sequences alone is indicative of pericardial fibrosis [36]. Calcification in CP is usually seen as a profound hypointensity on all pulse sequences.
In CP, CMR tagging sequences are used to show pericardial adhesions [37], whereas real-time cine CMR sequences during deep inspiration are used to assess ventricular interdependence. Typically, leftward movement of the IVS is seen in deep inspiration, and a rightward movement is seen in expiration, which is a pathognomonic sign of pericardial constriction [38]. Septal flattening, another sign of increase interventricular interdependence, may be observed with CMR in CP, with a reported sensitivity of 80 % and specificity of 100 % [39].
Cardiac CT provides excellent imaging of the pericardium, allowing accurate measurement of pericardial thickness. However, the demonstration of pericardial thickening (>4 mm) is not completely sensitive or specific for CP. Findings that suggest CP on CT include diffusely thickened or calcified pericardium, tubular LV and RV, and a sigmoid IVS [40]. The choice between CMR and CT depends upon the clinical setting and the available technologies. If the diagnosis is unclear, CMR study may be preferable, whereas CT is probably the best imaging modality in cases with a high suspicion of CP at clinical and echo-Doppler assessment [19].
A problem-oriented invasive hemodynamic study could be performed, particularly in the most severe cases with a surgical option or in the presence of conflicting results of noninvasive tests. CP is classically characterized by elevation and equalization of filling pressures [17, 19]. However, this finding is not very sensitive or specific, because it can be observed in RCM also. Furthermore, in CP, an inspiratory fall in pulmonary capillary wedge pressure (PCWP), contrasting with a fixed systemic venous pressure, is present. Reciprocal pressure variations in the two ventricles during respiratory phases is a useful sign of CP and is characterized by discordance between RV and LV systolic pressures, which increase and decrease, respectively, during inspiration. Conversely, a concordant respiratory behavior in systolic pressures in both ventricles is present in RCM [19].
In selected cases with refractory HF and nondiagnostic or discrepant imaging and hemodynamic data, an EMB and/or pericardial biopsy may be indicated [19, 41].
Finally, the intriguing possibility of mixed constrictive/restrictive physiology must be considered, particularly in patients without typical respiratory changes in flow velocities and ventricular size. These patients, however, may be less likely to benefit from pericardiectomy [42]. A useful diagnostic algorithm for a patient with suspected RCM vs CP is shown in Fig. 19.10 [19].
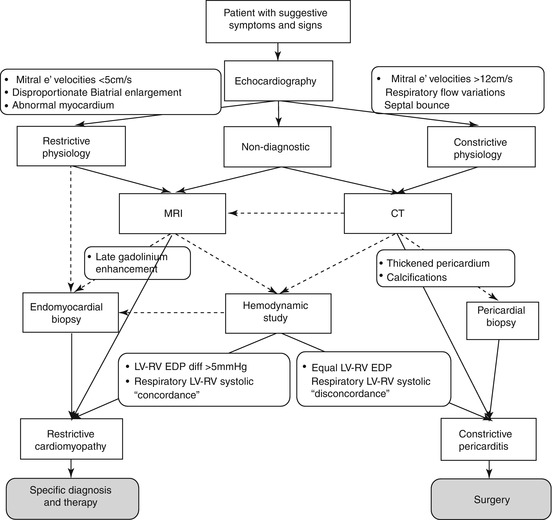
Fig. 19.10
Algorithm for evaluating patients with restrictive cardiomyopathy vs constrictive pericarditis. Dotted arrows denote optional choices (From Zwas et al. [19], with permission)
19.4 Eosinophilic Endomyocardial Disease and Endomyocardial Fibrosis
The definition of hypereosinophilic syndrome requires a sustained peripheral blood eosinophilia, >1.5 × 10⁹/L [43]. There are two types of hypereosinophilic syndromes [5, 43]. The most common is secondary hypereosinophilia, which occurs as a result of certain tumors, lymphoma, vasculitis, or parasitic or infectious diseases, as well as the hypereosinophilia that follows hypersensitivity reaction. The other form is primary hypereosinophilic syndrome that was first described by Loeffler in 1936 as “endocarditis parietalis fibroplastica.” In this form, there is evidence of eosinophil-mediated end-organ damage. The disease can affect all organs, including the heart, lungs, and nervous system, leading to neurological deficits [5, 43]. The cardiac pathology of hypereosinophilic syndrome has traditionally been divided into three stages: acute necrosis, thrombosis, and fibrosis [44]. The acute necrotic stage is characterized by myocardial necrosis due to progressive degranulation of eosinophils; acute myonecrosis is followed by formation of mural thrombi, often involving both ventricles; ventricular outflow tracts (OT); and subvalvular regions. This process may lead to atrioventricular valvular incompetence. The third phase is characterized by fibrotic replacement, leading to an RCM or a DCM phenotype.
Endomyocardial fibrosis (EMF) is an idiopathic disorder common mostly in tropical and subtropical regions (predominantly in Africa), but possibly present worldwide, characterized by the development of RCM [45]. EMF is sometimes considered part of a single disease process that includes Loeffler disease. Clinical presentation of the disease includes HF with preserved LV EF, reduced LV EF in advanced stages, tricuspid and/or mitral regurgitation, hyper- or hypokinetic arrhythmias, and, rarely, angina. Therapy comprises medical drugs (mostly diuretics, angiotensin-converting enzyme (ACE) inhibitors, beta-blockers, and anticoagulant agents in the presence of thrombi and/or AF), and surgery (endocardiectomy combined with mitral/tricuspid repair/replacement) in order to resolve RFP and HF [45].
Both Loeffler eosinophilic endocarditis and EMF are characterized at echocardiography in the early stage by endocardial hyperechogenicity due to eosinophilic infiltration with necrosis and mural thrombus formation, particularly in the apex of both ventricles (Fig. 19.11) [46–49]. Notably, wall motion adjacent to this deposition is normal. The use of contrast agents permits better evaluation not only of the extend of the thrombotic mass but also of the continuity of the mass with the infiltrated endocardium [50]. A highly echogenic line in the endocardial border [attributable to areas of fibrosis (Fig. 19.11)] can be found—particularly at the level of the RV free wall or the LV posterolateral wall—that can be hypokinetic [46]. In the late stage, mural thrombosis is replaced by fibrosis, which progresses to the endomyocardium, leading to RCM with typical apical obliteration [5, 46–49]. The fibrotic mass can also involve the atrioventricular (mitral and/or tricuspid) subvalvular apparatus and leaflets, causing leaflet restriction and valvular regurgitation, which can often be severe [49].
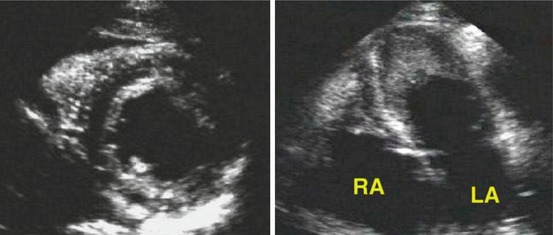
Fig. 19.11
Parasternal short-axis (left) and four-chamber (right) views from a patient with hypereosinophilic syndrome. A bright echogenic line surrounds the left ventricular endocardial border. The apical four-chamber view shows mural thrombi in the apex of both ventricles. LA left atrium, RA right atrium (From Nihoyannopoulos and Dawson [5], with permission)
Loeffler endocarditis usually involves the LV, whereas EMF shows a biventricular involvement in 50 % of cases and LV involvement in 40 %; the remaining 10 % has RV involvement [51]. Ventricles typically are normal in size and systolic function is preserved, whereas there is RFP due to interstitial fibrosis. There is usually prominent biatrial dilation [46, 47]. Finally, pericardial effusion is frequently present in EMF.
The feasibility of 3D contrast echocardiography has been proven in the diagnosis and follow-up evaluation of Loeffler disease complicated by thrombus formation and neoangiogenesis of the LV apex [52]. A preliminary report shows how 3D transthoracic echocardiography can provide substantial information in right-sided EMF concerning the region of RV involvement, as well as the various characteristics of RA thrombi [53].
Endocardial fibrous tissue deposition, the hallmark of EMF, can be assessed with LGE at contrast-enhanced CMR. A typical LGE pattern was described, with a V sign at the ventricular apex, characterized by a three-layer appearance of the myocardium, thickened fibrotic endomyocardium, and superimposed thrombus [54, 55] (Fig. 19.12). Electron-beam CT allows direct visualization of EMF, which is depicted as linear calcifications and/or a thin tissue band of low attenuation within the endomyocardium; CT enables differential diagnosis with CP [56]. In patients with hypereosinophilic syndrome undergoing CMR, a 29 % prevalence of LGE was reported, typically confined to the endocardium, located circumferentially within the RV and LV apexes [57]. A marked regression of LGE was seen after adequate therapy. Other authors report extensive myocardial hyperintensity at T2-weighted imaging during the acute phase of eosinophilic myocarditis [58].
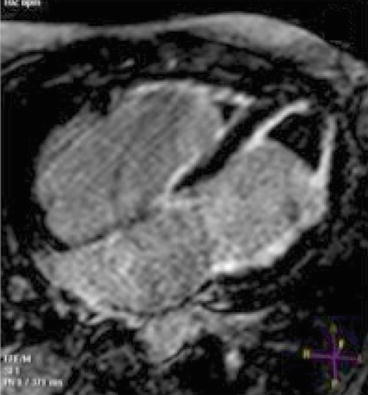
Fig. 19.12
 Dilated Cardiomyopathy: Usefulness of Imaging in Prognostic Stratification and Choice of Treatment
 Hypertrophic Cardiomyopathy: Clinical Assessment and Differential Diagnosis
 Definition, Classification, Epidemiology, and Clinical Relevance of Cardiomyopathies
 Arrhythmogenic Right Ventricular Cardiomyopathy: Clinical Assessment and Differential Diagnosis
 Basic Echocardiography in Hypertrophic Cardiomyopathy
 Infiltrative/Storage Cardiomyopathies: Clinical Assessment and Imaging in Diagnosis and Patient Management


Related posts:
Dilated Cardiomyopathy: Usefulness of Imaging in Prognostic Stratification and Choice of Treatment
Hypertrophic Cardiomyopathy: Clinical Assessment and Differential Diagnosis
Definition, Classification, Epidemiology, and Clinical Relevance of Cardiomyopathies
Arrhythmogenic Right Ventricular Cardiomyopathy: Clinical Assessment and Differential Diagnosis
Basic Echocardiography in Hypertrophic Cardiomyopathy
Infiltrative/Storage Cardiomyopathies: Clinical Assessment and Imaging in Diagnosis and Patient Management
Stay updated, free articles. Join our Telegram channel
Full access? Get Clinical Tree
