and Vincent L. Sorrell2
(1)
Division of Nuclear Medicine and Molecular Imaging Department of Radiology, University of Kentucky, Lexington, Kentucky, USA
(2)
Division of Cardiovascular Medicine Department of Internal Medicine Gill Heart Institute, University of Kentucky, Lexington, Kentucky, USA
Electronic supplementary material
The online version of this chapter (doi: 10.1007/978-3-319-25436-4_13) contains supplementary material, which is available to authorized users.
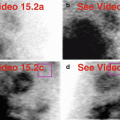
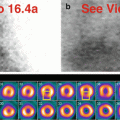
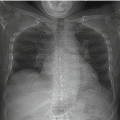
SPECT MPI can reveal abnormalities or normal variants related to the right side of the heart (Table 13.1). Not uncommonly, focal, often intense, radiopharmaceutical localization is seen in the region of the right atrium (Fig. 13.1). This represents uptake in the right auricular appendage which contains mitochondrial-rich myocardial tissue. This is a normal finding and should not be misinterpreted as a mediastinal mass (Mlikotic and Mishkin 2000; Mohr et al. 1996). Another benign etiology for a similar appearance is brown adipose tissue (BAT) which is avid for the MPI radiopharmaceuticals. Correlation with SPECT/CT is helpful in clinching the diagnosis by demonstrating the associated fat density (Goetze et al. 2008).


Table 13.1
Differential diagnosis of “hot” and “cold” imaging findings related to the right atrium and right ventricle
Organ system | “Hot” finding | “Cold” finding | References |
|---|---|---|---|
Right atrium and right ventricle | Prominent right ventricular wall (coronary artery disease, valvular disease, pulmonary hypertension) Brown adipose tissue Prominent right auricular appendage Neoplasm, primary or metastatic | Enlarged atria | Chamarthy and Travin (2010) Goetze et al. (2008) Mlikotic and Mishkin (2000) Mohr et al. (1996) Williams and Schneider (1999) Wosnitzer et al. (2012) |
Fig. 13.1


Right auricular appendage. Focal activity in the region of the right atrium (a–e) is a normal variant.(a) Stress raw projection images (Video 13.1a, frame 1), 99mTc sestamibi. (b) Stress raw projection image (Video 13.1b, frame 20), 99mTc sestamibi, right auricular appendage (pink box). (c) Stress/rest processed SPECT images (SA, VLA, HLA), right auricular appendage (HLA, yellow ovals). (d) Stress and rest gated SPECT images (Video 13.1c, frame 1) (SA, VLA, HLA). (e) Stress and rest gated SPECT image (Video 13.1d, frame 1) (SA, VLA, HLA), right auricular appendage (HLA, yellow ovals)
Related posts:

Stay updated, free articles. Join our Telegram channel
Full access? Get Clinical Tree
