Summary of Key Points
- •
Absent or reverse flow during diastole in the umbilical artery represents an advanced stage of placental compromise and is associated with more than 70% of placental arterial obliteration.
- •
In the presence of fetal hypoxemia, central redistribution of blood flow occurs, resulting in an increased blood flow to the brain, heart, and adrenals and a reduction in flow to the peripheral and placental circulations, known as the brain-sparing effect.
- •
Middle cerebral artery (MCA) peak systolic velocities (PSVs) are increased in the presence of fetal anemia. The greater velocity results from decreased blood viscosity and increased cardiac output.
- •
Pulsed Doppler velocimetry of the uterine artery should be obtained immediately after the vessel crosses the hypogastric artery and before it divides into the uterine and cervical branches. Abnormal uterine artery circulation has been associated with fetal growth restriction (FGR), preeclampsia, preterm delivery, and nonreassuring fetal status in labor.
- •
Doppler flow studies of the inferior vena cava and ductus venosus in the fetus provide information with regard to right ventricular preload, myocardial compliance, and right ventricular end-diastolic pressure.
- •
Inferior vena cava Doppler waveforms are triphasic in shape, with the first phase corresponding to ventricular systole, the second phase to early diastole, and the third phase to late diastole or the atrial kick. Ductus venosus Doppler waveforms are biphasic in shape, with the first phase corresponding to ventricular systole, the second phase to early diastole, and the nadir of the second phase to late diastole or the atrial kick.
- •
Reversed flow in the ductus venosus during atrial systole may be due to worsening placental disease, impaired cardiac function secondary to metabolic compromise, congenital heart defects, redistribution of hepatoportal blood flow through the liver, or a combination of these factors.
- •
To obtain accurate Doppler indices in fetal echocardiography, the sample volume is placed distal to the respective valves, the insonating angle should be within 0 to 20 degrees of the direction of blood flow, Doppler waveforms should be obtained during fetal apnea, and multiple measurements should be made.
- •
Doppler waveforms across the atrioventricular valves are bicuspid in shape. The first peak (E wave) corresponds to early ventricular filling of diastole, the second peak (A wave) corresponds to atrial systole or the atrial kick, with the E/A ratio being an index of ventricular preload and compliance.
- •
Doppler waveforms across the semilunar valves are uniphasic in shape. PSV and the time to peak velocity (TPV) increase with advancing gestation. These Doppler indices reflect ventricular contractility, arterial pressure, and afterload.
- •
Umbilical artery Doppler surveillance should be initiated when a growth-restricted fetus is considered viable. Abnormal Doppler waveforms of the umbilical artery have been associated with adverse perinatal outcome.
- •
Obtaining umbilical artery Doppler screening routinely in low-risk pregnancies has not been shown to improve outcome.
Physical Principles
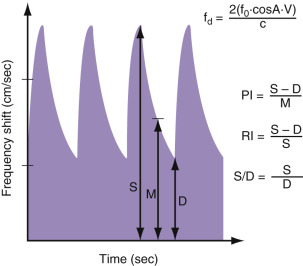
The Doppler effect, first reported by Christian Doppler in 1842, describes the apparent variation in frequency of a light or a sound wave as the source of the wave approaches or moves away relative to an observer. The traditional example that is given to describe this physical phenomenon is the apparent change in sound level of a train as it approaches and then departs a station. The sound seems higher in pitch as the train approaches the station and seems lower in pitch as the train departs the station. The actual sound of the train is constant, it is the apparent change in sound pitch to a stationary observer that describes the Doppler effect. This apparent change in sound pitch (Doppler effect), or what is also termed the frequency shift, is proportional to the speed of movement of the sound-emitting source. In clinical applications, when an ultrasound beam with a certain frequency is used to insonate a blood vessel, the reflected frequency or frequency shift is directly proportional to the speed with which the red blood cells are moving (blood flow velocity) within that particular vessel. This frequency shift of the returning signal is displayed in a graphic form as a time-dependent plot. In this display, the vertical axis represents the frequency shift, and the horizontal axis represents the temporal change of this frequency shift as it relates to the events of the cardiac cycle ( Fig. 22-1 ). This frequency shift is highest during systole, when the blood flow is at its fastest, and lowest during end diastole, when the blood flow is at its slowest in the peripheral circulation. Given that the velocity of flow in a particular vascular bed is inversely proportional to the downstream impedance to flow, the frequency shift therefore derives information on the downstream impedance to flow of the vascular bed under study. The frequency shift is also dependent on the cosine of the angle that the ultrasound beam makes with the direction of blood flow in the targeted blood vessel (see formula in Fig. 22-1 ). When the sound beam is parallel to the blood vessel of interest and thus the moving red blood cells, the entire Doppler shift is measured. However, when an angle exists between the direction of flow and the sound beam, the measured velocity is less than the true velocity. The degree to which the velocity is accurately measured depends on the angle of incidence (cosine Q). At an angle of 0 degrees, the measured velocity is equal to the true velocity. When the sound beam is perpendicular to the direction of flow (90 degrees), the measured velocity is zero, because the cosine of 90 degrees is zero. Thus, ideally, one wants to measure the velocity with as small an angle as possible.

Given that the insonating angle is difficult to measure in clinical practice, indices that rely on ratios of frequency shifts were developed to quantitate Doppler waveforms. By relying on ratios of frequency shifts, these Doppler indices are thus independent of the effects of the insonating angle of the ultrasound beam. Doppler indices that are commonly used in obstetric practice are shown in Figure 22-2 .
Fetal Arterial Doppler
Umbilical Artery
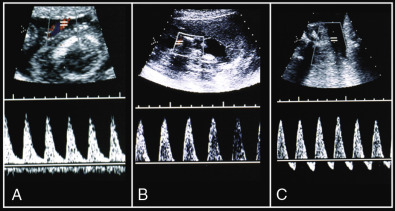
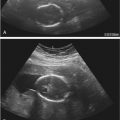
The umbilical arterial circulation is normally a low-impedance circulation, with an increase in the amount of end-diastolic flow with advancing gestation. Umbilical arterial Doppler waveforms reflect the status of the placental circulation, and the increase in end-diastolic flow that is seen with advancing gestation is a direct result of an increase in the number of tertiary stem villi that takes place with placental maturation ( Fig. 22-3 ). Diseases that obliterate small muscular arteries in placental tertiary stem villi result in a progressive decrease in end-diastolic flow in the umbilical arterial Doppler waveforms until absent, and then reverse flow during diastole is noted ( Fig. 22-4 ). Reversed diastolic flow in the umbilical arterial circulation represents an advanced stage of placental compromise and is associated with more than 70% of placental arterial obliteration. The notation of absent or reversed end-diastolic flow in the umbilical artery is commonly associated with severe FGR and oligohydramnios. Only in pregnancies with suspected FGR does the use of umbilical artery Doppler sonography reduce the number of perinatal deaths and unnecessary obstetric interventions.

Doppler waveforms of the umbilical arteries can be obtained from any segment along the umbilical cord. Waveforms obtained from the placental end of the cord show more end-diastolic flow and thus lower ratio values (resistive index [RI], systole/diastole [S/D] ratio) than waveforms obtained from the abdominal cord insertion. There are differences in Doppler indices of arterial waveforms obtained from different anatomic locations of the same umbilical cord, but they are generally minor and have no significance in clinical practice ( Tables 22-1 through 22-3 ). In 2013, the International Society for Ultrasound in Obstetrics and Gynecology (ISUOG) recommended taking Doppler measurements from a free loop of cord for the sake of simplicity and consistency.
| Gestation (weeks) | SYSTOLIC-DIASTOLIC RATIO, BY PERCENTILE | ||||||||
|---|---|---|---|---|---|---|---|---|---|
| 2.5th | 5th | 10th | 25th | 50th | 75th | 90th | 95th | 97.5th | |
| 19 | 2.73 | 2.93 | 3.19 | 3.67 | 4.28 | 5.00 | 5.75 | 6.26 | 6.73 |
| 20 | 2.63 | 2.83 | 3.07 | 3.53 | 4.11 | 4.80 | 5.51 | 5.99 | 4.43 |
| 21 | 2.51 | 2.70 | 2.93 | 3.36 | 3.91 | 4.55 | 5.22 | 5.67 | 6.09 |
| 22 | 2.43 | 2.60 | 2.83 | 3.24 | 3.77 | 4.38 | 5.03 | 5.45 | 5.85 |
| 23 | 2.34 | 2.51 | 2.72 | 3.11 | 3.62 | 4.21 | 4.82 | 5.22 | 5.61 |
| 24 | 2.25 | 2.41 | 2.62 | 2.99 | 3.48 | 4.04 | 4.63 | 5.02 | 5.38 |
| 25 | 2.17 | 2.33 | 2.52 | 2.88 | 3.35 | 3.89 | 4.45 | 4.83 | 5.18 |
| 26 | 2.09 | 2.24 | 2.43 | 2.78 | 3.23 | 3.75 | 4.30 | 4.66 | 5.00 |
| 27 | 2.02 | 2.17 | 2.35 | 2.69 | 3.12 | 3.63 | 4.15 | 4.50 | 4.83 |
| 28 | 1.95 | 2.09 | 2.27 | 2.60 | 3.02 | 3.51 | 4.02 | 4.36 | 4.67 |
| 29 | 1.89 | 2.03 | 2.20 | 2.52 | 2.92 | 3.40 | 3.89 | 4.22 | 4.53 |
| 30 | 1.83 | 1.96 | 2.13 | 2.44 | 2.83 | 3.30 | 3.78 | 4.10 | 4.40 |
| 31 | 1.77 | 1.90 | 2.06 | 2.36 | 2.75 | 3.20 | 3.67 | 3.98 | 4.27 |
| 32 | 1.71 | 1.84 | 2.00 | 2.29 | 2.67 | 3.11 | 3.57 | 3.87 | 4.16 |
| 33 | 1.66 | 1.79 | 1.94 | 2.23 | 2.60 | 3.03 | 3.48 | 3.77 | 4.06 |
| 34 | 1.61 | 1.73 | 1.88 | 2.16 | 2.53 | 2.95 | 3.39 | 3.68 | 3.96 |
| 35 | 1.57 | 1.68 | 1.83 | 2.11 | 2.46 | 2.87 | 3.30 | 3.59 | 3.86 |
| 36 | 1.52 | 1.64 | 1.78 | 2.05 | 2.40 | 2.80 | 3.23 | 3.51 | 3.78 |
| 37 | 1.48 | 1.59 | 1.73 | 2.00 | 2.34 | 2.74 | 3.15 | 3.43 | 3.69 |
| 38 | 1.44 | 1.55 | 1.69 | 1.95 | 2.28 | 2.67 | 3.08 | 3.36 | 3.62 |
| 39 | 1.40 | 1.51 | 1.64 | 1.90 | 2.23 | 2.61 | 3.02 | 3.29 | 3.54 |
| 40 | 1.36 | 1.47 | 1.60 | 1.85 | 2.18 | 2.56 | 1.96 | 3.22 | 3.48 |
| 41 | 1.33 | 1.43 | 1.56 | 1.81 | 2.13 | 2.50 | 2.90 | 3.16 | 3.41 |
| Gestation (weeks) | Resistance Index, by Percentile | ||
|---|---|---|---|
| 5th | 50th | 95th | |
| 20 | 0.567 | 0.690 | 0.802 |
| 21 | 0.557 | 0.680 | 0.793 |
| 22 | 0.548 | 0.671 | 0.784 |
| 23 | 0.539 | 0.663 | 0.776 |
| 24 | 0.530 | 0.655 | 0.768 |
| 25 | 0.522 | 0.646 | 0.760 |
| 26 | 0.514 | 0.639 | 0.752 |
| 27 | 0.506 | 0.631 | 0.745 |
| 28 | 0.498 | 0.623 | 0.737 |
| 29 | 0.490 | 0.615 | 0.730 |
| 30 | 0.482 | 0.608 | 0.723 |
| 31 | 0.474 | 0.600 | 0.715 |
| 32 | 0.465 | 0.592 | 0.707 |
| 33 | 0.457 | 0.584 | 0.700 |
| 34 | 0.449 | 0.576 | 0.692 |
| 35 | 0.440 | 0.567 | 0.684 |
| 36 | 0.431 | 0.559 | 0.675 |
| 37 | 0.422 | 0.550 | 0.667 |
| 38 | 0.412 | 0.540 | 0.657 |
| 39 | 0.402 | 0.530 | 0.648 |
| 40 | 0.390 | 0.519 | 0.637 |
| Gestation (weeks) | PULSATILITY INDEX, BY PERCENTILE | ||
|---|---|---|---|
| 5th | 50th | 95th | |
| 20 | 0.940 | 1.216 | 1.505 |
| 21 | 0.913 | 1.189 | 1.476 |
| 22 | 0.890 | 1.165 | 1.450 |
| 23 | 0.869 | 1.142 | 1.427 |
| 24 | 0.849 | 1.122 | 1.405 |
| 25 | 0.831 | 1.102 | 1.385 |
| 26 | 0.813 | 1.084 | 1.365 |
| 27 | 0.798 | 1.065 | 1.346 |
| 28 | 0.780 | 1.048 | 1.327 |
| 29 | 0.764 | 1.031 | 1.308 |
| 30 | 0.748 | 1.014 | 1.290 |
| 31 | 0.732 | 0.997 | 1.272 |
| 32 | 0.716 | 0.980 | 1.254 |
| 33 | 0.700 | 0.963 | 1.236 |
| 34 | 0.684 | 0.946 | 1.218 |
| 35 | 0.668 | 0.928 | 1.199 |
| 36 | 0.651 | 0.910 | 1.180 |
| 37 | 0.634 | 0.891 | 1.160 |
| 38 | 0.615 | 0.872 | 1.139 |
| 39 | 0.595 | 0.851 | 1.117 |
| 40 | 0.573 | 0.828 | 1.093 |
Middle Cerebral Artery
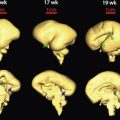
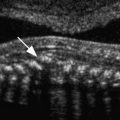
The MCA is the most accessible cerebral vessel to ultrasound imaging in the fetus, and it carries more than 80% of cerebral blood flow. The cerebral circulation is normally a high-impedance circulation with continuous forward flow throughout the cardiac cycle. In the presence of fetal hypoxemia, central redistribution of blood flow occurs, resulting in increased blood flow to the brain ( Fig. 22-5 ), heart, and adrenals and a reduction in flow to the peripheral and placental circulations. This blood flow redistribution is known as the brain-sparing effect and plays a major role in fetal adaptation to oxygen deprivation.

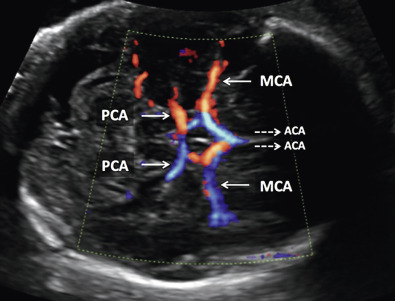
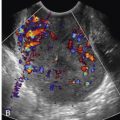
The right and left middle cerebral arteries represent major branches of the circle of Willis in the fetal brain. The circle of Willis, which is supplied by the internal carotid and vertebral arteries, can be imaged with color flow Doppler sonography in a magnified axial plane of the fetal head obtained at the base of the skull, at the level of the thalami and wings of sphenoid bone ( Fig. 22-6 ). In this plane, the proximal and distal middle cerebral arteries are seen in their long axis, with their course almost parallel to the ultrasound beam. As such, the insonating beam, which is parallel to the vessel and thus has an angle of insonation of 0 degrees, will result in a measured velocity that accurately reflects the true velocity of blood in this vessel (cos 0 = 1). MCA Doppler waveforms, obtained from the proximal third portion of the vessel, immediately after its origin from the circle of Willis, have shown the best reproducibility ( Tables 22-4 and 22-5 and Fig. 22-7 ).
| Gestation (weeks) | RESISTANCE INDEX, BY PERCENTILE | Gestation (weeks) | RESISTANCE INDEX, BY PERCENTILE | ||||
|---|---|---|---|---|---|---|---|
| 5th | 50th | 95th | 5th | 50th | 95th | ||
| 18 | 0.544 | 0.687 | 0.787 | 31 | 0.652 | 0.798 | 0.907 |
| 19 | 0.574 | 0.708 | 0.808 | 32 | 0.645 | 0.792 | 0.902 |
| 20 | 0.592 | 0.727 | 0.828 | 33 | 0.636 | 0.783 | 0.894 |
| 21 | 0.608 | 0.744 | 0.846 | 34 | 0.625 | 0.773 | 0.885 |
| 22 | 0.622 | 0.758 | 0.861 | 35 | 0.612 | 0.761 | 0.873 |
| 23 | 0.633 | 0.771 | 0.874 | 36 | 0.597 | 0.747 | 0.86 |
| 24 | 0.643 | 0.782 | 0.886 | 37 | 0.579 | 0.73 | 0.844 |
| 25 | 0.651 | 0.79 | 0.895 | 38 | 0.56 | 0.712 | 0.826 |
| 26 | 0.656 | 0.796 | 0.902 | 39 | 0.539 | 0.692 | 0.807 |
| 27 | 0.659 | 0.801 | 0.907 | 40 | 0.515 | 0.669 | 0.785 |
| 28 | 0.661 | 0.803 | 0.91 | 41 | 0.489 | 0.644 | 0.761 |
| 29 | 0.66 | 0.803 | 0.911 | 42 | 0.462 | 0.618 | 0.735 |
| 30 | 0.657 | 0.801 | 0.91 | ||||
| Gestation (weeks) | UA RESISTANCE INDEX | MCA RESISTANCE INDEX | RATIO | ||||||
|---|---|---|---|---|---|---|---|---|---|
| 5th | 50th | 95th | 5th | 50th | 95th | 5th | 50th | 95th | |
| 24 | 0.615 | 0.717 | 0.828 | 0.778 | 0.867 | – | 0.696 | 0.809 | 0.968 |
| 25 | 0.605 | 0.707 | 0.819 | 0.789 | 0.881 | – | 0.676 | 0.791 | 0.955 |
| 26 | 0.594 | 0.697 | 0.810 | 0.795 | 0.892 | – | 0.658 | 0.775 | 0.945 |
| 27 | 0.583 | 0.687 | 0.802 | 0.798 | 0.898 | – | 0.642 | 0.761 | 0.937 |
| 28 | 0.572 | 0.678 | 0.793 | 0.797 | 0.901 | – | 0.628 | 0.750 | 0.932 |
| 29 | 0.562 | 0.668 | 0.785 | 0.793 | 0.900 | – | 0.616 | 0.740 | 0.929 |
| 30 | 0.551 | 0.658 | 0.776 | 0.786 | 0.897 | – | 0.606 | 0.732 | 0.928 |
| 31 | 0.540 | 0.648 | 0.767 | 0.776 | 0.891 | – | 0.597 | 0.726 | 0.929 |
| 32 | 0.530 | 0.638 | 0.759 | 0.764 | 0.883 | – | 0.590 | 0.722 | 0.931 |
| 33 | 0.519 | 0.629 | 0.750 | 0.750 | 0.872 | – | 0.585 | 0.719 | 0.936 |
| 34 | 0.508 | 0.619 | 0.742 | 0.734 | 0.860 | – | 0.581 | 0.717 | 0.941 |
| 35 | 0.498 | 0.609 | 0.733 | 0.717 | 0.846 | – | 0.578 | 0.717 | 0.949 |
| 36 | 0.487 | 0.599 | 0.724 | 0.698 | 0.831 | – | 0.576 | 0.718 | 0.957 |
| 37 | 0.476 | 0.589 | 0.716 | 0.677 | 0.814 | – | 0.575 | 0.720 | 0.967 |
| 38 | 0.465 | 0.580 | 0.707 | 0.655 | 0.795 | – | 0.576 | 0.724 | 0.978 |
| 39 | 0.455 | 0.570 | 0.699 | 0.632 | 0.776 | – | 0.577 | 0.728 | 0.991 |
| 40 | 0.444 | 0.560 | 0.690 | 0.607 | 0.755 | – | 0.580 | 0.734 | 1.004 |
| 41 | 0.433 | 0.550 | 0.681 | 0.582 | 0.734 | – | 0.583 | 0.740 | 1.018 |
| 42 | 0.423 | 0.540 | 0.673 | 0.556 | 0.711 | – | 0.588 | 0.747 | 1.034 |
Related posts:

Stay updated, free articles. Join our Telegram channel

Full access? Get Clinical Tree


