Jean Noel Buy1 and Michel Ghossain2
(1)
Service Radiologie, Hopital Hotel-Dieu, Paris, France
(2)
Department of Radiology, Hotel Dieu de France, Beirut, Lebanon
11.1 Introduction
11.2 Embryology
11.2.1 The Indifferent Gonad
11.2.2 Development of Testes
11.2.3 Development of Ovaries
11.3 Definitions
11.3.1 Sex Cords
11.4 Frequency (Fig. )
11.7 Radiologic Findings
11.7.2 Estrogen-Secreting Tumors
11.7.3 Androgen-Secreting Tumors
11.7.5 Steroid (Lipid) Cell Tumor
11.7.6 Gynandroblastoma
Abstract
It comprises neoplasms that contain cells of the follicular wall (granulosa cells, theca cells, and their luteinized derivates), as well as fibroblasts of stromal origin, singly or in various combinations and in varying degrees of differentiation [1, 2]. More rarely, these tumors arise from Leydig cells mainly located in the hilus of the ovary. Uncommonly, tumors can contain Sertoli cells, (which are not present in the normal ovary) isolated or less exceptionally associated with other cells types mentioned above.
11.1 Introduction
It comprises neoplasms that contain cells of the follicular wall (granulosa cells, theca cells, and their luteinized derivates), as well as fibroblasts of stromal origin, singly or in various combinations and in varying degrees of differentiation [1, 2]. More rarely, these tumors arise from Leydig cells mainly located in the hilus of the ovary. Uncommonly, tumors can contain Sertoli cells, (which are not present in the normal ovary) isolated or less exceptionally associated with other cells types mentioned above.
Most sex cord-stromal tumors are composed of ovarian cell types (granulosa-stromal cell tumor). Very uncommonly, Sertoli-stromal cell tumors contain only cells of testicular type. Exceptionally cells of both gonads coexist (gynandroblastomas).
11.2 Embryology
11.2.1 The Indifferent Gonad
A mesodermal origin: on the medial aspect of the urogenital ridge, proliferation of cells of the coelomic epithelium and the underlying mesenchyme gives rise to the gonadal ridge. Soon fingerlike epithelial cords called primary sex cords grow into the underlying mesenchyme.
An endodermal origin: primordial germ cells originate in the wall of the yolk sac near the origin of the allantois. They migrate along the dorsal mesentery of the hindgut to the gonadal ridges into the underlying mesenchyme and become incorporated in the primary sex cords.
11.2.2 Development of Testes
In the presence of a gene called the SRY (the sex-determining region Y), the indifferent gonad differentiates in an anatomically distinct testis by day 44.
The prominent sex cords loose their connections with the coelomic epithelium because of the development of the tunica albuginea. They develop into seminiferous tubules which extend into the medulla, and their ends anastomose to form the rete testis. The walls of seminiferous tubules are composed of cells of Sertoli derived from the coelomic epithelium and spermatogonia derived from the primordial germ cells. They are separated by the mesenchyme which gives rise to the interstitial cells of Leydig.
11.2.3 Development of Ovaries
The primary sex cords do not become prominent, but they extend into the medulla and form a rudimentary rete ovarii in the hilus of the ovary.
Secondary sex cords extend from the coelomic epithelium into the underlying mesenchyme. Primitive germ cells are incorporated into them. At about 16 weeks, the cortical cords begin to break up into isolated cell clusters called primordial follicles, which consist of an oogonium derived from a primordial germ cell, surrounded by a single layer of pregranulosa cells derived from the cortical cords. The mesenchyme surrounding the follicles forms the ovarian stroma.
11.3 Definitions
11.3.1 Sex Cords
In the developing testis by the fifth week of the embryonic life, the sex cords are formed by slender columns of primitive Sertoli cells.
In the developing ovary by the twelfth week of the embryonic life, there are not real sex cords but instead packets of small pregranulosa cells enveloping germ cells.
For that reason, the term “sex cord-stromal tumors” has been considered inappropriate. However, this term which has been adopted by the WHO has the advantage of acknowledging the presence in these neoplasms of derivates of either or both the sex cords.
11.3.2 Cells That Are Present in the Normal Ovary
11.3.2.1 Stroma
It is composed of stromal cells separated by a dense reticulin network and a variable amount of collagen.
11.3.2.2 Stromal Cells
Spindle-shaped stromal cells which resemble fibroblasts:
Luteinized stromal cells
Enzymatically stromal cells
Decidual cells
Endometrial stromal cells
Smooth muscle cells
Fat cells
Stromal Leydig cells
11.3.2.3 Granulosa Cells
Theca Cells
Theca cells differentiate continuously from the stromal cells at the periphery of developing follicles from fetal life to the termination of the menopause.
Theca interna: well-defined layer of the antral follicle outside the granulose. It contains abundant reticulin.
Theca externa: ill-defined layer surrounding the theca interna and merging imperceptibly with the adjacent ovarian stroma
Hilus cells: ovarian hilus cells are morphologically identical to testicular Leydig cells except for having a female chromatin pattern.
11.3.3 Cells Which Are Present in the Normal Testis and Which Can Be Present in Ovarian Tumors
Sertoli cells: supporting epithelial cells of the seminiferous tubules
Leydig cells: in the interstitial spaces between the tubules. In the ovary, ovarian hilus cells (hilar Leydig cells) are morphologically identical to testicular Leydig cells.
11.4 Frequency (Fig. 11.1)
Fig. 11.1
Repartition of sex cord and stromal tumors of the ovary
This category accounts for approximately 8 % of all primary ovarian tumors [3].
Tumors in the thecoma-fibroma group represent roughly 87 % of these tumors, granulosa cell tumors 12 %, steroid cell tumors 1 %, Sertoli-Leydig cell tumors 0.05 %, and others 0.05 % [1].
11.6 Classification and General Features
The World Health Organization (WHO) histological classification is reported in Table 11.1 [3].
Table 11.1
WHO histological classification of sex cord-stroma cell tumors
1. Granulosa-stromal cell tumors |
1.1. Granulosa cell tumor |
1.1.1. Adult |
1.1.2. Juvenile |
1.2. Tumors in thecoma-fibroma group |
1.2.1. Thecoma |
–Typical |
–Luteinized |
1.2.2. Fibroma |
1.2.3. Cellular fibroma |
1.2.4. Fibrosarcoma |
1.2.5. Stromal tumor with mixed sex cord elements |
1.2.6. Sclerosing stromal tumor |
1.2.7. Unclassified |
1.2.8. Others |
2. Sertoli-stromal cell tumors: androblastomas |
2.1. Well differentiated |
2.1.1. Sertoli cell tumor (tubular androblastoma) |
2.1.2. Sertoli-Leydig cell tumor |
2.1.3. Leydig cell tumor |
2.2. Sertoli-Leydig cell tumor of intermediate differentiation |
2.2.1. Variant-with heterologous elements (specific type) |
2.3. Sertoli-Leydig cell tumor, poorly differentiated (sarcomatoid) |
2.3.1. Variant-with heterologous elements (specific type) |
2.4. Retiform |
2.4.1. Variant-with heterologous elements (specific type) |
3. Sex cord tumor with annular tubules (SCTAT) |
4. Gynandroblastoma |
5. Unclassified |
6. Steroid (lipid) cell tumors |
6.1. Stromal luteoma |
6.2. Leydig cell tumor |
6.2.1. Hilus cell tumor |
6.2.2. Leydig cell tumor, non-hilar type |
A simplified classification is reported in Table 11.2.
Table 11.2
Simplified classification of sex cord-stromal cell tumors
1. Tumors in the thecoma-fibroma group |
1.1. Thecoma (B), fibroma (B), fibrothecoma (B) |
1.2. Sclerosing stromal tumor (B) |
1.3. Cellular fibroma |
1.4. Fibrosarcoma (M) |
2. Granulosa cell tumor (Bo) |
3. Sertoli-Leydig cell tumors (M) |
4. Sex cord Tumor with annular tubules (M) |
5. Steroid (lipid) cell tumors |
Leydig cell tumor (B) |
Luteoma |
Not otherwise specified |
6. Gynandroblastoma (M) |
Their clinical and biological characteristics are summarized in Table 11.3.
Table 11.3
Clinical and biological characteristics
Normal precursor cell | Tumor | Biology | Age |
|---|---|---|---|
Stroma cells | Fibroma | NF | PM |
Internal theca cells | Thecoma | O, a (rare) | M |
Granulosa | Granulosa cell tumors | O, a (rare) | M |
Sertoli-Leydig cell tumors | NF (50 %) | Y | |
A (1/3), o (rare) | |||
Gynandroblastoma | A, O | ||
SCTAT | A, O | ||
Stroma cells | Stromal luteoma | O (60 %), a (rare) | M |
Hilar cells | Leydig cell tumors | A (75 %), o (rare) | M |
Nonclassified sex cord tumor | A (50 %), o (rare) | PM |
11.7 Radiologic Findings
11.7.1 Tumors in the Thecoma-Fibroma Group
11.7.1.1 Fibromas-Fibrothecomas
Thecomas and fibromas form a spectrum of benign tumors extending from thecomas in which the tumor is mainly composed of cells containing abundant cytoplasm with large amounts of lipid to fibromas composed entirely or almost entirely of spindle cells producing variable amounts of collagen. Both populations of cells can be mixed in the same tumor. According to the predominant cell component at pathology, the tumor is designated as a thecoma, a fibroma, or a fibrothecoma. Because of the overlap between them, some authors use the designation of fibrothecomas [3].
In fibromas, the average patient age is 48 years; in thecomas, 84 % are postmenopausal; in both types, 10 % are under 30 years of age [4, 5].
Fibroma is usually nonfunctional; it is exceptionally associated with steroid hormone production. It is usually discovered during a routine ultrasound examination.
Thecomas are usually estrogenic; 60 % of the postmenopausal women present with uterine bleeding [4]. In luteinized thecomas, half of them are estrogenic, 39 % are nonfunctioning, and 11 % are androgenic [6].
Macroscopy
Thecomas and fibromas are unilateral in 97 % [3] and in 92 % [5], respectively; they range in size from small to large solid masses; most are 5–10 cm in diameter.
In fibromas, sectioning typically reveals hard, flat, chalky white surfaces, resembling a uterine leiomyoma (Fig. 11.2). In thecomas, sectioning typically discloses a solid yellow mass, but in some cases, the tumor is white with only focal tinges of yellow.
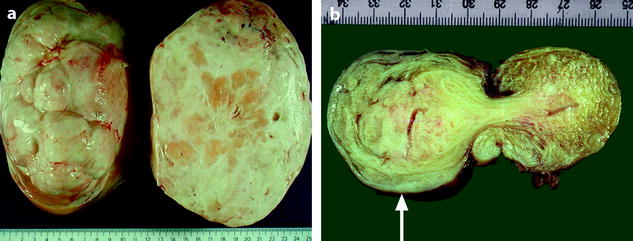
Fig. 11.2
(a) Section of an ovarian fibroma. (b) Section of a subserous pedunculated leiomyoma (arrow)
In both tumors, areas of edema, occasionally with cyst formation are present. Hemorrhage is occasionally seen. Focal or diffuse calcifications are observed in fewer than 10 % of cases in fibromas [3]. Foci of calcification may be present in thecomas; extensive calcified thecomas tend to occur in young women [7].
Vascular Findings
While the macroscopic aspect of ovarian fibrothecoma and uterine subserous leiomyoma and their degenerative changes can look very similar, their vascular findings are quite different (Fig. 11.3).
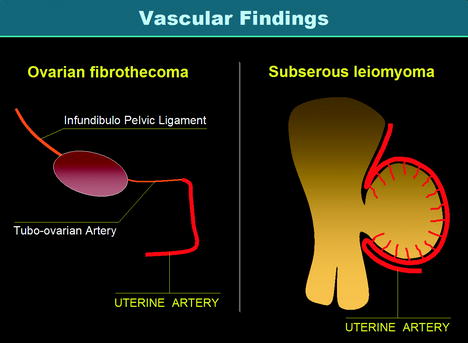
Fig. 11.3
Vascularization of ovarian fibrothecoma versus vascularization of subserous leiomyoma. Vascularization of a fibrothecoma is produced by the ovarian artery and the tubo-ovarian artery of the uterine artery which are of small caliber so that vascularization is poor and mainly central. On the opposite, vascularization of a subserous leiomyoma is produced by the marginal segment of the uterine artery and its branches (the arcuate arteries and the perforating arteries) with a characteristic peripheral vascularization more or less associated with a central vascularization
Imaging Modalities
The main findings are summarized in Table 11.4.
Table 11.4
Radiologic findings in fibroma-fibrothecomas
Small fibrothecoma (<5 cm) |
Ultrasound |
2D: similar to subserous leiomyoma |
–Smooth or lobulated contour |
–Echogenicity close to myometrium |
Characteristic sound attenuation without calcification related to fibrous tissue |
Doppler findings: different from subserous leiomyoma |
Fibrothecoma: |
–Very rare tiny vessels; can be perpendicular to the wall |
–Absence of peripheral vessels like in a subserous leiomyoma |
–Vascularization can be absent; in this case differential diagnosis with a cystic echogenic mass |
Subserous leiomyoma: |
–Characteristic circumscribed peripheral vessels |
CT / MR |
CT without injection |
Density close to myometrium, noncharacteristic; cannot be visible especially when small |
MR on T2 |
Characteristic hypointense signal |
DCT, DMR |
–Without injection: density on CT and signal on T1 close to myometrium |
–Arterial phase: absence or slight regular vessel |
–Venous phase: slight or absence of contrast uptake |
–Delayed phase: slight contrast uptake |
Differential diagnosis |
Brenner tumor |
–Identical morphologic and vascular findings |
–Psammoma like calcifications |
–Association with another tumor: mucinous cystadenoma |
Nonneoplastic ovarian processes |
(a) Massive edema |
(b) Fibromatosis: encompasses follicles and their derivates |
(c) Stromal hyperplasia: bilateral, nodular, or diffuse |
Large fibrothecoma (≥5 cm) |
Radiologic findings |
Degenerative changes identical to subserous leiomyoma |
–Edema |
–Cystic changes |
–Calcification |
–Hemorrhage |
Morphologic changes related to fibrous tissue +++ |
Differential diagnosis |
Subserous leiomyoma |
–Circumscribed peripheral vascularization (+++) more or less associated with central vascularization |
Carcinoma |
Morphologic findings |
–Can be identical |
DCT or DMR |
–Arterial phase: tumoral vessels are central, can be peripheral but never circumscribed as in subserous leiomyoma |
–Venous phase: high contrast uptake, quite different from fibrothecoma but can be identical to subserous leiomyoma |
Typical Form Without or with Few Degenerative Changes
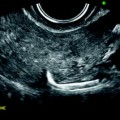
Ultrasound
On TAS, the mass is echogenic with or without acoustic shadowing (Fig. 11.4).
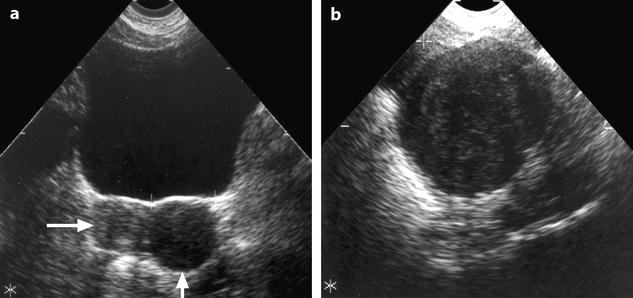
Fig. 11.4
Fibroma: typical form on ultrasound. (a) Left ovarian mass (vertical arrow) with an echogenicity lower than myometrium (horizontal arrow) without acoustic shadowing on TAS. (b) Areas of acoustic shadowing are displayed on EVS
On EVS (Figs. 11.5 and 11.6), the mass has a relatively homogeneous echogenicity slightly inferior or equal to myometrium with a very particular ultrasonic finding, a large area or multiple areas of acoustic shadowing in the absence of any hyperechogenic focus related to calcification [8–12]. Such a pattern on US is well displayed on in vivo and in vitro study (Fig. 11.6) and is typical of fibrous tissue (Table 11.4). It can be observed in other diagnosis (Table 11.5) mainly and subserous leiomyomas and Brenner tumors [10].
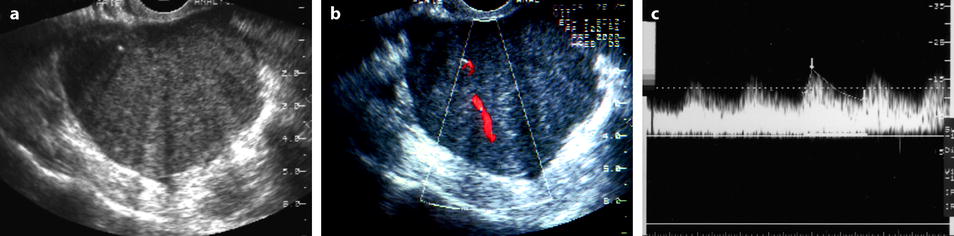
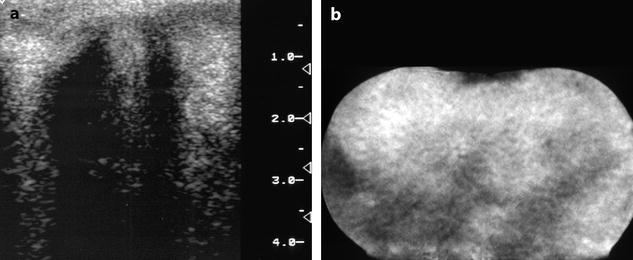
Fig. 11.5
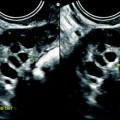
Fibrothecoma: typical aspect on US and color doppler. Seventy-four years old woman with right ovarian mass discovered at a routine gynecologic examination. (a) US: 4.8 cm right ovarian mass, with an echogenicity close to myometrium containing multiple acoustic shadowings without hyperechogenic foci (except for one) very likely related to fibrous tissue. (b) Color Doppler displays very few vessels in the mass without any peripheral vascularization, which is very suggestive of ovarian fibroma. (c) Spectral Doppler: the resistivity index is of 0.50, which is of no help in the diagnosis. At pathology a fibrothecoma was confirmed
Fig. 11.6
In vitro imaging of fibrothecoma. (a) In vitro ultrasound shows multiple acoustic shadowing without any hyperechogenic focus suggestive of calcification. (b) In vitro CT confirms the absence of calcification
For subserous leiomyoma, visualization of the normal ipsilateral ovary separated from the mass can make the differential diagnosis, while presence of follicles around the mass can exclude this diagnosis.
Color Doppler allows in most cases to distinguish ovarian fibroma and Brenner tumor from subserous leiomyoma. In ovarian fibromas, the vascularization is very poor, made of small, sparse vessels in the center of the mass (Fig. 11.5), sometimes at the periphery, while a peripheral ring vascularization is typical for a subserous leiomyoma (Figs. 11.7 and 11.8) and is not observed in ovarian fibroma [11]. However, this finding can be observed in the uncommon sclerosing stromal tumor (see later on) and cellular fibroma.
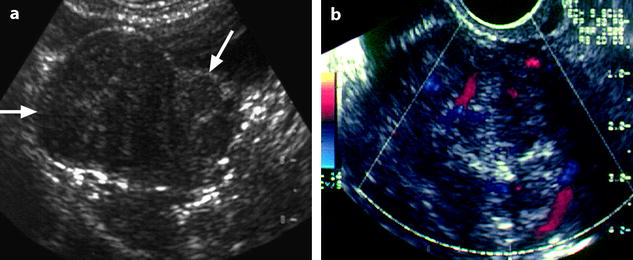
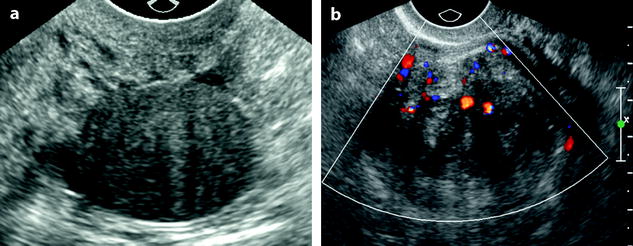
Fig. 11.7
Uterine subserous leiomyoma: ultrasound features. (a) TAS shows an echogenic mass (horizontal arrow) containing multiple acoustic shadowing, on the right side of the uterus (oblique arrow). (b) EVS with Doppler demonstrates a peripheral vascularization typical of a uterine subserous leiomyoma
Fig. 11.8
Subserous leiomyoma: ultrasound pattern. (a) Round echogenic mass against the posterior wall of the isthmus of the uterus, containing multiple acoustic shadowing without any calcification, very suggestive of fibrous tissue. As the ipsilateral ovary was not visualized, differential diagnosis between a subserous leiomyoma and an ovarian fibroma could not be made. (b) On color Doppler, a typical peripheral vascularization, with some central vessels, allowed to make the diagnosis of a subserous leiomyoma. At coelioscopy, this diagnosis was confirmed
MR and CT Findings
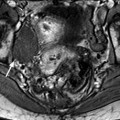
On MR (Fig. 11.9)
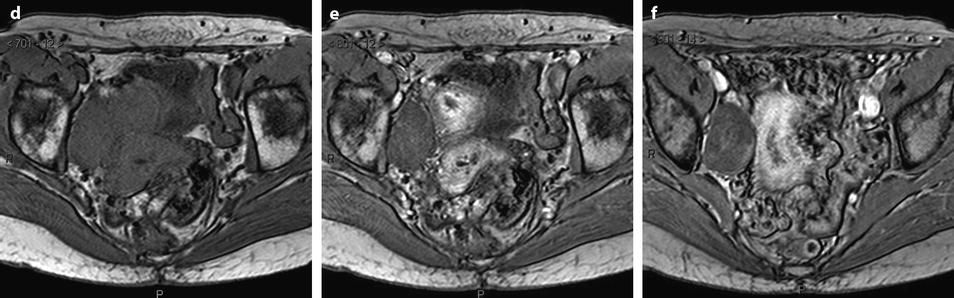
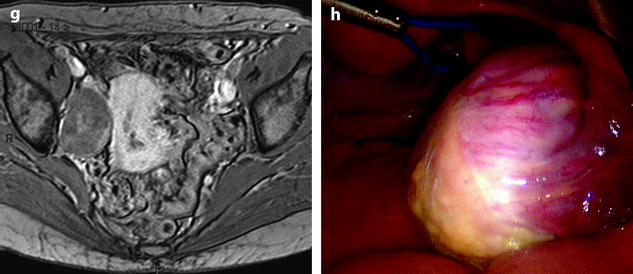
Fig. 11.9
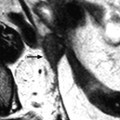
Typical fibrothecoma at MR. Sixty-six years old woman with hormonal replacement and metrorrhagia. A right ovarian mass is discovered on US. MR axial T2 (a), axial T1 (b), axial T1 fat suppression (c), DMR without injection (d), at the arterial phase (e), at the venous phase (f), and on the delayed phase (g). On T2 (a), the right ovarian mass (arrow) appears with overall low signal intensity very suggestive of fibrous tissue. On T1 and T1 fat suppression, the mass is of low signal intensity. On DMR, at the arterial phase, no tumoral vessel is visualized; a slight contrast uptake is displayed at the venous phase, which slightly increases on the delayed phase remaining very low typical for benign fibrous tissue. Preoperative diagnosis: the low signal on T2 and this type of contrast enhancement are typical for fibrothecoma. At surgery (h), a tumor suggestive of fibrothecoma was removed. Pathology: histology confirmed the diagnosis of fibrothecoma
On T2W images, the tumors are predominantly of low signal intensity (like pelvic muscle, lower than normal ovarian tissue) [13, 14] so that even when the tumor is small, it can be easily detected. This low signal is very suggestive of the presence of fibrous tissue. This low signal can be homogeneous particularly in case of small tumor [14].
OnT1W images, the signal intensity is low, close to pelvic muscles [14].
On DWI (Fig. 11.10), the tumor appears with low signal intensity.
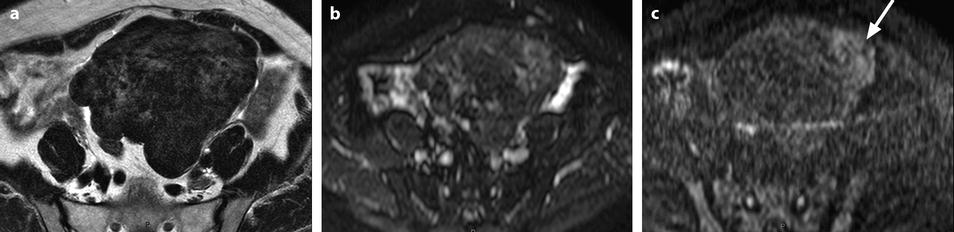
Fig. 11.10
Fibrothecoma on DWI. Sixty-six years old woman. Hormonal replacement for 10 years. Metrorrhagia related to hyperplasia of the endometrium on ultrasound. CA 125: 73 IU/ml. (a) MR axial T2 shows a large bosselated mass with overall low signal intensity. (b, c) DWI at b0 (b) and b1000 (c) shows overall low signal intensity in the mass except for some areas of slighter higher intensity related to slight degenerative changes, the most prominent one on the left (arrow in c). These areas are also slightly hyperintense on the T2WI
On CT without contrast, the mass has a density equal or slightly inferior to the myometrium [8] (Fig. 11.11).
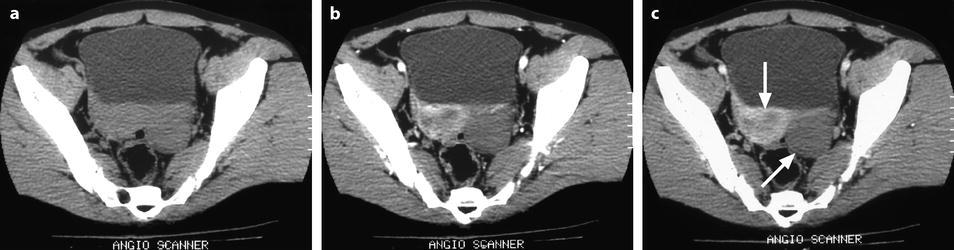
Fig. 11.11
Typical fibrothecoma on CT. (a–d) Dynamic CT scan without contrast (a), at the arterial phase (b), at the parenchymal phase (c), and delayed CT (d) shows low enhancement of the tumor (oblique in c) compared to myometrium (vertical arrow in c). (e). Time-intensity curves of the right external iliac artery and the mass show typical low enhancement of the ovarian tumor (vertical arrow) compared to the iliac artery (oblique arrows), typical for an ovarian fibroma. (f) In vitro CT displays a relatively homogeneous fibrous mass (Figures from Author’s personal publication: Bazot et al. [8])
At the arterial phase, no arterial vessel is visualized.
At the parenchymal, no contrast uptake is visualized.
On the delayed phase, a slight contrast uptake is displayed.
These findings: (1) absence of arterial vessel at the arterial phase, (2) absence of early contrast uptake, and (3) delayed contrast uptake are typical for a benign convective tissue. They are really different from the malignant tumors where irregular tumoral vessels can be observed at the arterial phase with an early intense contrast uptake. They are also very different from a uterine subserous leiomyoma (Fig. 11.12) [13–15] where multiple more or less regular vessels are present at the arterial phase at the periphery and in the center of the mass, with an intense contrast uptake at the parenchymal phase.
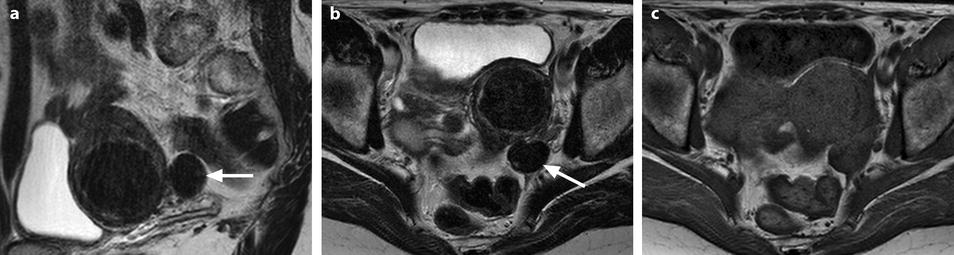
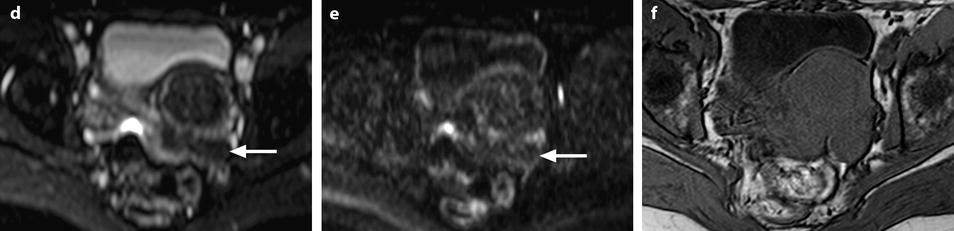
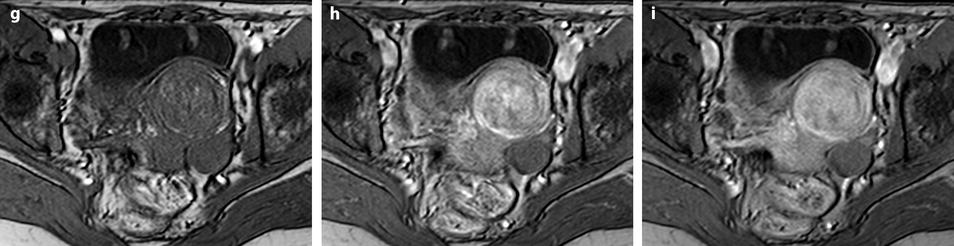
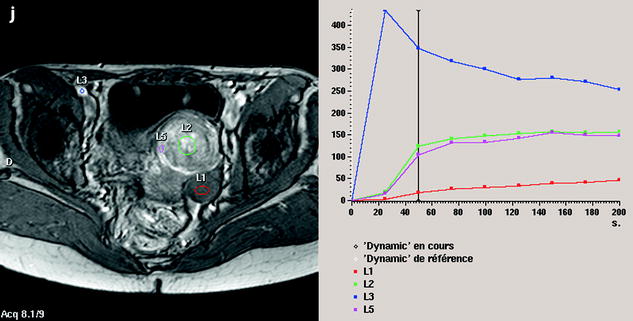
Fig. 11.12
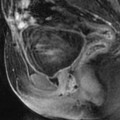
Fibrothecoma without degenerative changes versus subserous leiomyoma. (a, b) Sagittal T2 (a) and axial T2 (b) display a left ovarian mass (arrows) with homogeneous low level intensity behind the uterus that contains a leiomyoma. (c) Axial T1: the ovarian mass has a low intensity identical to the subserous leiomyoma. (d, e) Diffusion b0 (d) and b1000 (e) show low intensity in both masses (ovarian mass = arrows). (f–i) DMR without injection (f), at the arterial phase (g), at the venous phase (h) and on the delayed (i) displays: At the arterial phase, no vessel is displayed in the ovarian mass while peripheral and some central vessels are seen in the leiomyoma. At the venous phase, an absence of contrast uptake in the ovarian mass, a peripheral, and central contrast uptake in the leiomyoma. On the delayed a slight contrast uptake in the ovarian mass. (j) Time-intensity curves in the mass (L1), the center of the leiomyoma (L2), the periphery of the leiomyoma (L5), and the right external iliac artery (L3) show slow a low contrast uptake in the ovarian mass compared to the leiomyoma and the artery
Demonstration of a pedicle to the uterus or of two normal ovaries excludes the diagnosis of an ovarian mass.
Form with Degenerative Changes
The aspect of these tumors is variable, mainly because of the degenerative changes.
Edema, Cystic Degeneration
On US, ill-defined anechoic spaces can be related to edema [6] (Fig. 11.13), while clearly anechoic delineated spaces can be related to cystic degeneration (Fig. 11.14) [16, 17].
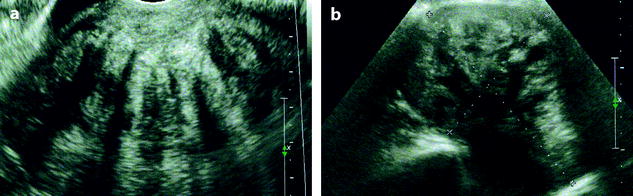
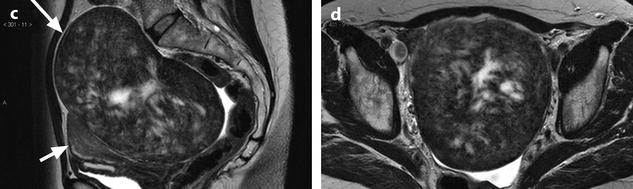
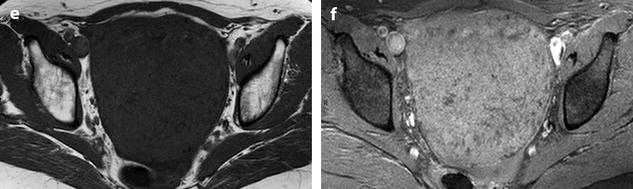
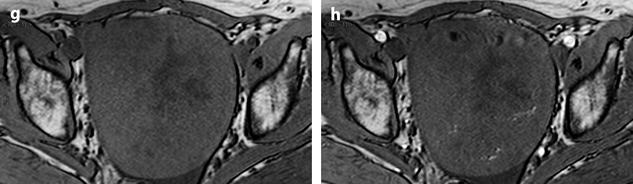
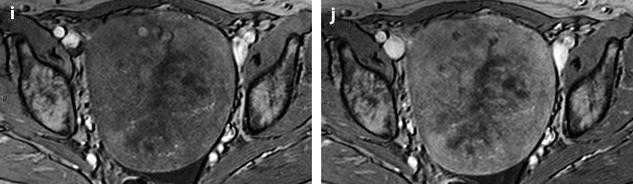
Fig. 11.13
Fibrothecoma with edematous and cystic changes. Fifty-seven years old woman without hormonal replacement. Pollakiuria. CA 125 normal. (a) EVS demonstrates an ovarian mass with a pattern very suggestive of an ovarian fibroma. (b) TAS displays well-delineated anechoic structures related to edema or cystic changes. (c, d) On sagittal (c) and axial (d) T2WI, the mass (long arrow in c) contains areas of high signal intensity and is posterior to the uterus (short arrow in c). (e, f) Axial T1 (e) and T1 fat suppression (f) show absence of hemorrhage. (g–j) DMR before injection (g), at the arterial phase (h), venous (i) and parenchymal phase (j) show the areas of edema to fill slowly with contrast medium, while no contrast enhancement can be seen in the cystic changes
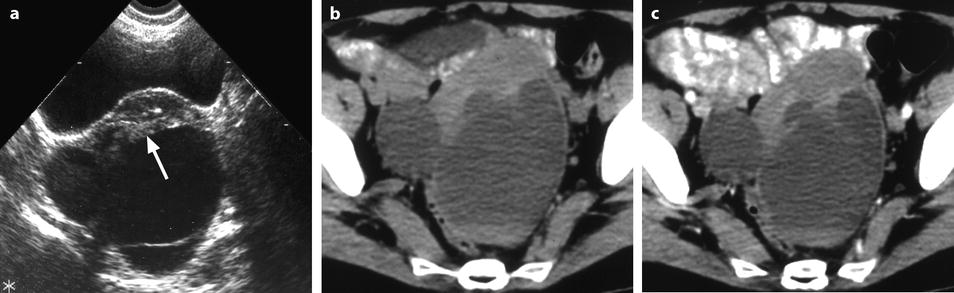
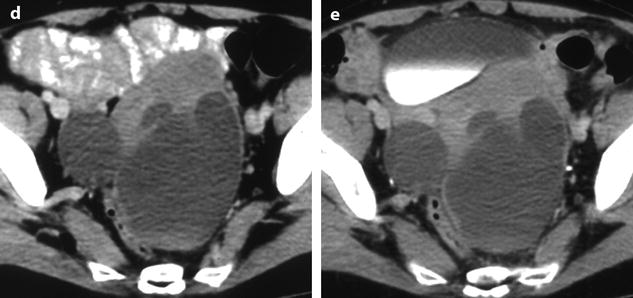
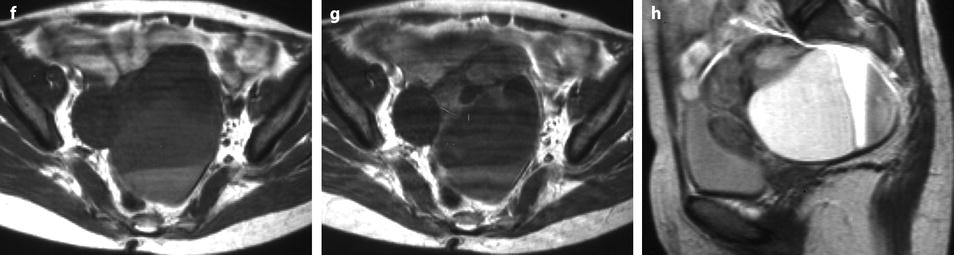
Fig. 11.14
Fibrothecoma of the ovary with cystic degeneration. The mass is mainly cystic multilocular with a tissular potion, very unusual presentation for a fibrothecoma. Sixty-three years old woman with pelvic mass at physical examination. (a) TAS: bilateral or biloculated mainly cystic ovarian mass: a small echogenic portion (arrow) is visualized anteriorly. No definite diagnosis was suggested. (b–e) Dynamic CT without contrast (b), at the arterial phase (c), at the parenchymal phase (d), and on the delayed CT (e). Absence of tumoral vessel in the tissular portion at the arterial phase rules out a carcinoma. A slight contrast uptake on the delayed CT (e) highly suggests the presence of benign connective tissue. A preoperative diagnosis of benign tumor was established; a diagnosis of cystadenofibroma was suggested. (f–h) Axial MR T1W without (f) and after injection (g), and sagittal T2W images (h). Slight contrast uptake is visualized in the tissular portion (g). Two fluid-fluid levels with a high signal intensity band are visualized in the dependent portion of the mass. Because of the age of the patient, a total hysterectomy with bilateral adnexectomy was performed. At pathology, a left ovarian fibrothecoma with a multiloculated cystic component containing only clear fluid was diagnosed
On MR, distinction between both is easier. While both types of degeneration appear on MR with a high signal on T2 and on CT as low-density areas, after contrast injection, cystic spaces do not enhance while contrast diffuses progressively in edema areas (Figs. 11.13 and 11.14).
Hemorrhage can be visualized on CT or MR (Fig. 11.15).
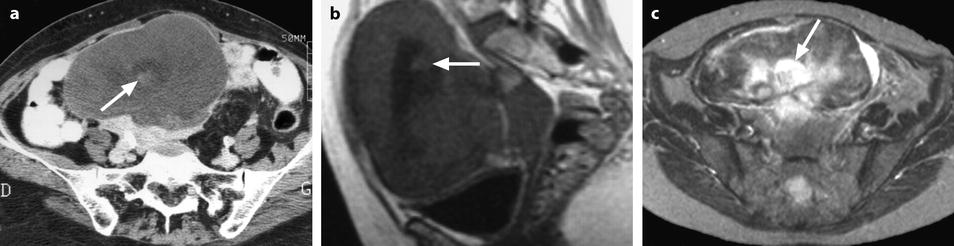
Fig. 11.15
Fibrothecoma of the ovary with hemorrhagic and edematous changes. (a) CT without contrast: a small hyperdense area suggestive of hemorrhage is seen in the center of the mass (arrow) surrounded by a larger hypodense area related to edema. (b) MR sagittal T1W image shows, like on CT, a small hyperintense hemorrhagic area (arrow) surrounded by a larger hypointense area related to edema. (c) Axial T2W image shows multiple hyperintense areas related to edema especially the central one (arrow) surrounding the hemorrhagic focus
Calcifications
On US, strong echoes can be present. They are usually better detected and characterized on CT and are hardly depicted on MR (Fig. 11.16) [8, 16]. However, when these calcifications are coarse, they can be detected on MR (Fig. 11.17).
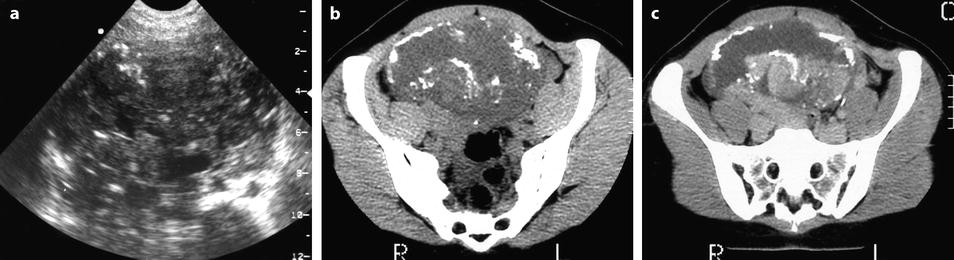
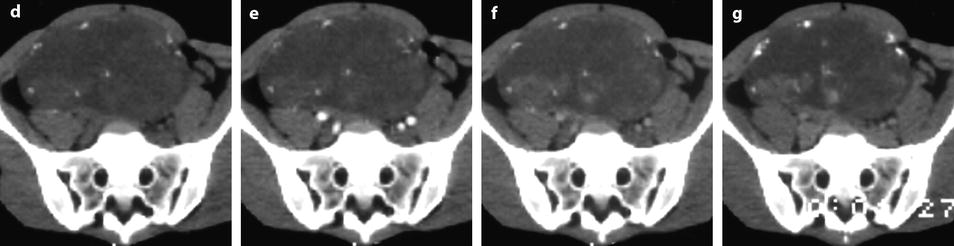
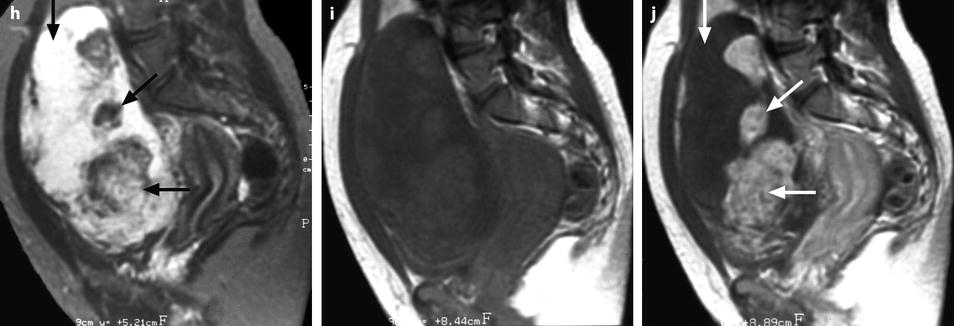
Fig. 11.16
Fibrothecoma of the ovary with calcifications and edematous and cystic changes. Eighteen years old woman with abdominal pain and right ovarian pelvic abdominal mass at physical examination. (a) Transverse TVS shows an echogenic abdominopelvic mass containing multiple hyperechogenic foci likely related to calcifications. (b, c) CT scan without contrast injection (b) and corresponding delayed CT scan after injection (c) show large irregular tissular portions with degenerative changes and multiple calcifications. (d–g) Dynamic CT without contrast (d), at the arterial phase (e), at the parenchymal phase (f), and on the delayed CT (g): absence of tumoral vessel at the arterial phase and absence of significant contrast uptake make the diagnosis of carcinoma very unlikely. Fig. 11.16 (continued) (h–j) Sagittal MR T2W image (h), T1W image before (i) and after (j) contrast: large irregular tissular portions with contrast uptake containing edema and a large cystic component are displayed. Tissular portions are seen as hypointense areas on T2 enhancing after injection (oblique arrow in j). Cystic portion is seen as hyperintense areas on T2 not enhancing after injection (vertical arrow in j). Areas of edema in tissular portions are seen as hyperintense on T2 enhancing after injection (horizontal arrow in j). On MR, calcifications are not definitely diagnosed. The pattern on MR resembles a carcinoma; however, in this case, a DMR has not been performed. At pathology, a fibrothecoma was diagnosed
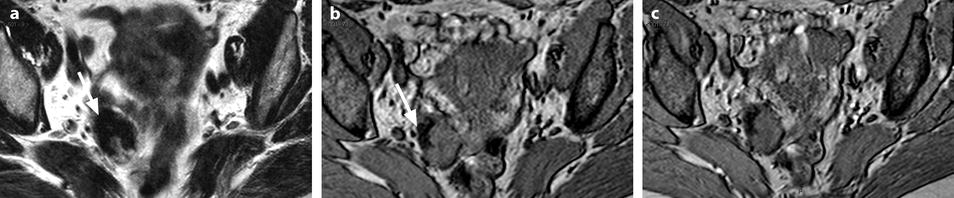
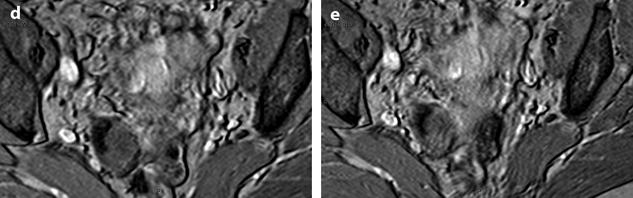
Fig. 11.17
Calcified fibrothecoma on MR. (a) MR axial T2WI shows an overall low-intensity right ovarian mass with anterolaterally a more hypointense area (arrow). (b–e) DMR without injection (b), at the arterial phase (c), at the venous phase (d), and on the delayed (e) better displays in the anterolateral part of the mass a hypointense crescent area (arrow) that did not enhance. At pathology, abundant calcifications were present in this area
Myxoid degeneration (Fig. 11.18)
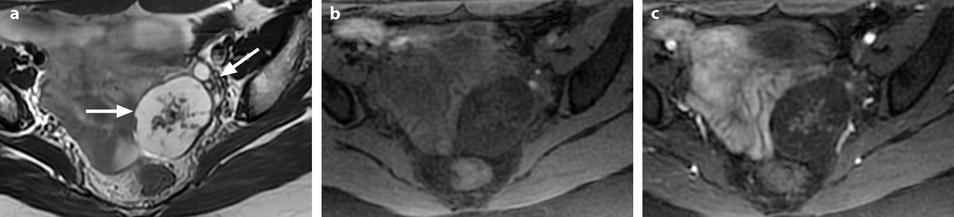
Fig. 11.18
Ovarian fibroma with myxoid changes and cellular areas in a 24 years old woman discovered during routine ultrasound examination. (a) T2W image shows a left ovarian mass (horizontal arrow) with a hypointense irregular cellular center and hyperintense periphery with myxoid changes. Normal ovarian left parenchyma is seen anterolaterally (oblique arrow). (b–f) Dynamic MRI before injection (b), at the arterial (c), venous (d), and late (e) phases, with corresponding time-intensity curves (f), shows rapid and high contrast uptake in the central portion, close to that of the myometrium and much higher than the normal ovarian parenchyma. Uptake in the other parts of the tumor was absent or low. The left ovarian parenchyma contains also some hyperintense endometriotic spots. (g, h) Diffusion weighted images b0 (g) and b1000 (h) show low signal in the central solid hypervascularized portion with an ADC value of 1.82 × 10⁻³ mm2/s. In the myxoid hyperintense portion on T2 and b0, the signal was low on b1000 with an ADC of 2.2 × 10⁻³ mm2/s
Particular Patterns
A hyperechogenic aspect has been observed in a series in 3/22 cases [8].
Exceptionally:
The fibroma is related to the ovary by a small pedicle (Fig. 11.19).
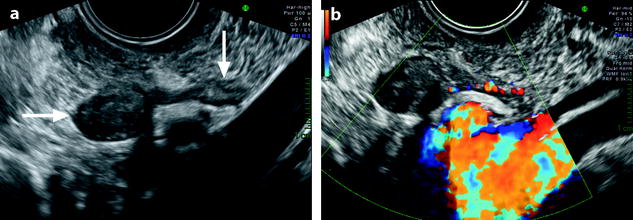
Fig. 11.19
Pedunculated ovarian fibroma. Menopausal woman without hormonal treatment; an ovarian mass is discovered during a routine examination. (a) EVS displays an 8 mm in diameter echogenic adnexal mass (horizontal arrow) with acoustic shadowing suggestive of a fibrothecoma. It is related to the left ovary (vertical arrow) by a narrow band. (b) Color Doppler displays a vascularization in the narrow band suggesting the diagnosis of a pedunculated ovarian fibroma. Pathology confirmed this diagnosis
The fibroma can be included in an ovarian cyst simulating an endocystic papillary projection of an epithelial ovarian tumor (Fig. 11.20).
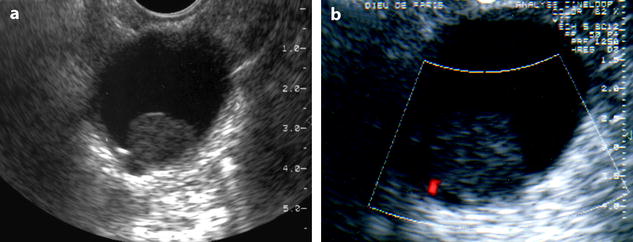
Fig. 11.20
Fibrothecoma of the ovary: unusual aspect in a cyst. (a, b) TVS (a) and color Doppler (b) demonstrate an echogenic round 2 cm mass without acoustic shadowing with a tiny vessel at the periphery, within a cyst. A papillary projection in an epithelial ovarian cyst was suggested. At pathology: a small ovarian fibroma was present in an inclusion cyst
Associated Findings: Ascites
Differential Diagnosis
Unilateral
1.
Subserous leiomyoma
2.
Brenner tumor
3.
Fibromatosis (80 % of cases are unilateral)
4.
Carcinoma
Bilateral
5.
Stromal hyperplasia: it is almost always bilateral
6.
Metastases: mainly Carcinoid and Krukenberg (Table 11.5)
Table 11.5
Ultrasound attenuation in the differential diagnosis of adnexal tumors
Structure
Histology
US attenuation
Normal ovary
Normal ovarian stroma
–Spindle-shaped stromal cells that resemble fibroblasts
Absent
–Dense reticulum network
–A variable amount of collagen which is most abundant in the superficial cortex
Nonneoplastic ovarian lesions
PCOD
The superficial cortex is fibrotic and hypocellular
Absent
Fibromatosis
Proliferation of collagen-producing spindle cells
Present
Stromal hyperplasia
Proliferation of ovarian stromal cells
Absent
Ovarian tumors
Epithelial tumors
Cystadenofibroma
The stroma can resemble normal ovarian stroma but is generally more fibrous
Absent
Brenner tumor
Stroma varies from closely resembling ovarian cortical stroma to densely fibrous
Present
Sex cord-stromal tumors
Fibroma
Intersecting bundles of spindle cells and production of abundant dense collagen
Present
Sclerosing stromal tumor
Nodules spindle cells with sclerosis (fibers) separated by densely collagen or edematous tissue
Present
Sertoli-Leydig
Nodular architecture with fibrous bands separating nodules
Present
Metastases
Carcinoid metastases
–Extensive stromal proliferation that closely resembles an ovarian fibroma
Present
–Occasionally the stroma is extensively hyalinized
Krukenberg
–Cellular ovarian stroma
Present
–Occasionally, the stroma has a storiform pattern
–In large masses, abundant collagen formation, marked stromal edema
Non–ovarian masses
Leiomyoma
–Whorled anastomosing fascicles of spindle cells (smooth muscle cells)
Present
–Hyaline fibrosis in 60 % of cases
Complications
Common: Torsion
Torsion in this type of tumor is not uncommon (Fig. 11.21) [18].
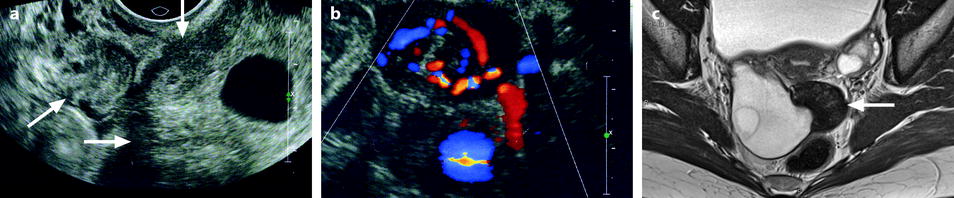
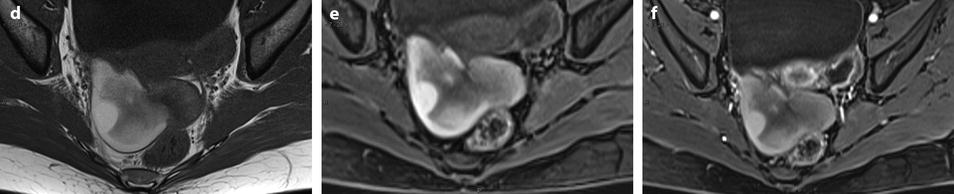
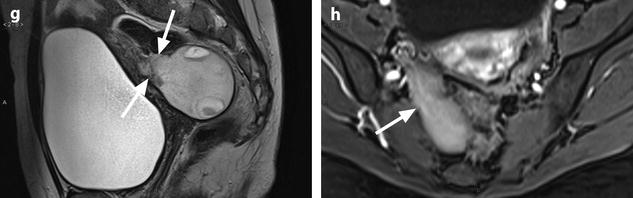
Fig. 11.21
Fibrothecoma complicated with torsion. Thirty-six years old woman with acute pelvic pain, increased leucocytes, increased sedimentation rate and at CRP 73 mg/l. (a) EVS displays an echogenic right ovarian mass (horizontal arrow) suggestive of an ovarian fibroma or Brenner tumor, containing a cystic portion. The ovarian parenchyma (vertical arrow) looks hypoechoic surrounding follicle structures containing echogenic material. A vascular thick pedicle running laterally is seen (oblique arrow). (b) Color Doppler displays tortuous vessels in the pedicle. Torsion is suspected and an MR performed. (c–f) MR axial T2WI (c), T1WI (d), and T1WI-FS before (e) and after injection (f). On T2WI, the ovarian mass comprises two components. A hypointense medial component (arrow) that was related to fibrous tissue complicated with necrosis at pathology. A lateral solid component that is hyperintense (related to edema) and that contains a cystic portion. On T1 and T1 fat suppression, hyperintense hemorrhage is seen at the periphery of the mass, in the cyst, and in some central areas. After injection, nonobvious contrast uptake is detected. (g, h) Sagittal T2 (g) and axial T1FS after injection (h) demonstrate a thickened hyperintense vascularized pedicle (arrows). At surgery, torsion of the ovary around the lombo-ovarian ligament with four turns, without tubal torsion, was found. A right ovariectomy was performed. At pathology, a tumor of the fibrothecal group comprising a cystic and a solid component complicated with necrosis and hemorrhage was diagnosed
Uncommon: Demons–Meigs Syndrome (Figs. 11.22 and 11.23)Get Clinical Tree app for offline access
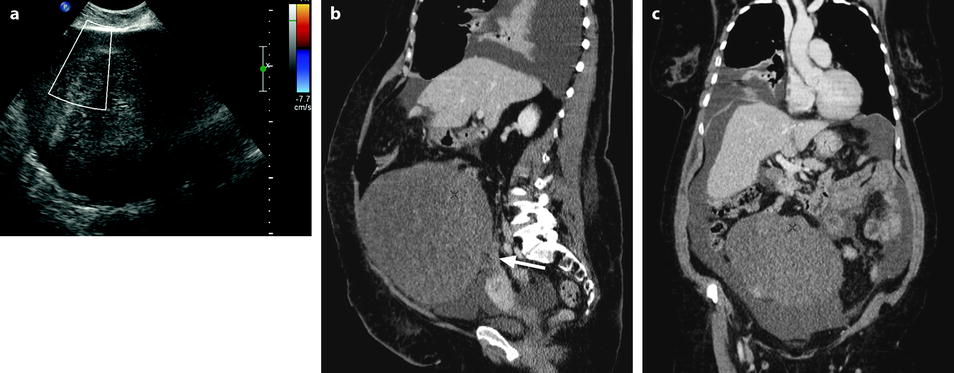
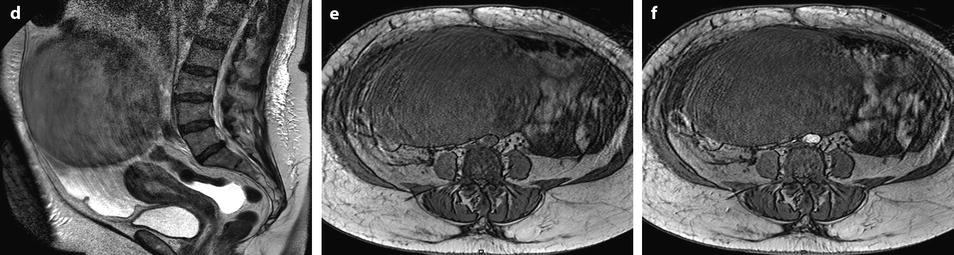
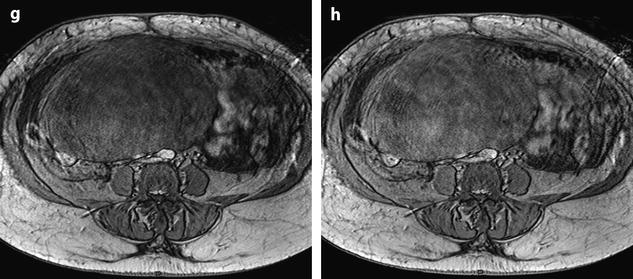
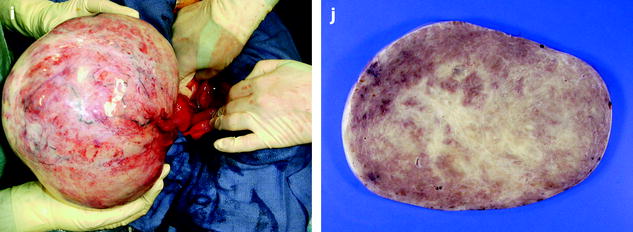
Fig. 11.22
Demons-Meigs with ovarian fibroma. EVS with Doppler (a) demonstrates a typical poorly vascularized ovarian fibroma. CT scan with sagittal (b) and coronal (c) reformations displays a tissular ovarian mass stretching the tube (arrow in b), pelvic abdominal ascites, and right pleural effusion. MR with sagittal T2 (dRelated posts:

Stay updated, free articles. Join our Telegram channel

Full access? Get Clinical Tree