points.
LV mass and volume at ED were subsequently calculated from the cardiac LV shape models. The sphericity index was calculated as the EDV divided by the volume of a sphere with a diameter corresponding to the major axis at end-diastole in LV long view [17]. The apical conicity index was calculated as the ratio of the apical axis (defined as the diameter of the endocardium one third above the apex) over the basal diameter [7]. Wall thickness was calculated as the mean distance between the corresponding endo- and epi-cardium surfaces.
For each clinical index, cases outside two standard deviations of the mean (95 % of variance). But within one standard deviation for all other indices, were chosen to form a patient subgroup linked with each clinical index. Orthogonal modes were defined sequentially, using the first principal component of each subgroup. At each step, the contribution of the previous mode was removed mathematically from the shape description, similar to the Gram–Schmidt orthogonalization algorithm [18], prior to the calculation of the principal component. Modes were defined in the following order: (1) LV size, (2) sphericity, (3) conicity, and (4) wall thickness.
Mathematically, let  represent the shape space as a matrix where each column contains the coordinates of 3D points describing the shape of one case. Selecting cases with high and low EDV as previously described, a principal decomposition of this subgroup yielded a matrix of modes (
 ), so that

 represent the shape space as a matrix where each column contains the coordinates of 3D points describing the shape of one case. Selecting cases with high and low EDV as previously described, a principal decomposition of this subgroup yielded a matrix of modes (
 ), so that
(1)
for each case m in the subgroup, where  represents the Euclidean mean,
  is the total number of modes
  , and
, and  their corresponding projections (these are also referred to as weights or scores). The first mode (
 ) was used to describe the LV size variation. The projections of the first mode were then removed from the initial space for all cases, creating a new space
  . A PCA of the resulting shapes for the subgroup consisting of high and low sphericity was then performed. The mode relating to sphericity was then defined to be the first principal component of this subgroup, i.e.
  :
:

 represents the Euclidean mean,
  is the total number of modes
  , and
, and  their corresponding projections (these are also referred to as weights or scores). The first mode (
 ) was used to describe the LV size variation. The projections of the first mode were then removed from the initial space for all cases, creating a new space
  . A PCA of the resulting shapes for the subgroup consisting of high and low sphericity was then performed. The mode relating to sphericity was then defined to be the first principal component of this subgroup, i.e.
  :
:
(2)
New mode  was then subtracted from the shape space
  , and the procedure repeated for the conicity (
 ) and wall thickness modes (
 ). Note that by construction
  is orthogonal to
  [18] and
  generate an orthogonal linear sub-space of
  .
.
 was then subtracted from the shape space
  , and the procedure repeated for the conicity (
 ) and wall thickness modes (
 ). Note that by construction
  is orthogonal to
  [18] and
  generate an orthogonal linear sub-space of
  .
.3 Results
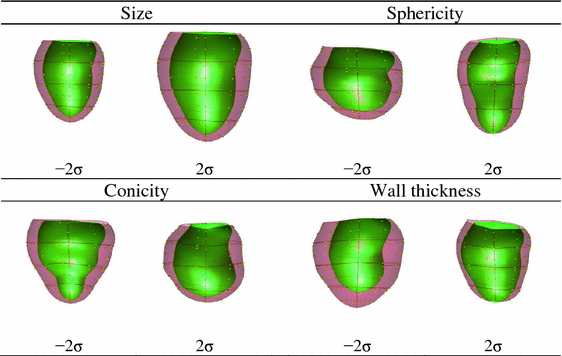
The orthogonal modes corresponding to size, sphericity, conicity and wall thickness are shown in Fig. 1. Linear correlation coefficients were calculated between the clinical indices and the shape-mode scores ( ) in the combined MESA and DETERMINE population. The linear correlation coefficient between the size score and EDV, sphericity score and LV sphericity index, wall thickness score and LV wall thickness, conicity sore and LV conicity index were 0.93, −0.87, 0.75 and −0.63 respectively (Table 1). The linear correlation coefficients among the clinical indices (Table 2), correlation coefficients among the mode scores (Table 3) and correlation coefficients between clinical indices and scores of the first four PCA modes of the original dataset (standard PCA in Table 4) were also calculated as a reference. It can be seen that, although the shape modes are orthogonal (their dot products are zero), some remodeling indices and corresponding mode scores were significantly correlated. In particular, the wall thickness score was significantly correlated with LV size, with larger hearts having thinner walls, consistent with eccentric remodelling. Also, although the first two standard principal components correspond with size and sphericity respectively, other components do not correspond with any particular remodeling index.

 ) in the combined MESA and DETERMINE population. The linear correlation coefficient between the size score and EDV, sphericity score and LV sphericity index, wall thickness score and LV wall thickness, conicity sore and LV conicity index were 0.93, −0.87, 0.75 and −0.63 respectively (Table 1). The linear correlation coefficients among the clinical indices (Table 2), correlation coefficients among the mode scores (Table 3) and correlation coefficients between clinical indices and scores of the first four PCA modes of the original dataset (standard PCA in Table 4) were also calculated as a reference. It can be seen that, although the shape modes are orthogonal (their dot products are zero), some remodeling indices and corresponding mode scores were significantly correlated. In particular, the wall thickness score was significantly correlated with LV size, with larger hearts having thinner walls, consistent with eccentric remodelling. Also, although the first two standard principal components correspond with size and sphericity respectively, other components do not correspond with any particular remodeling index.
Fig. 1.
Plot of the clinical modes
Table 1.
Correlation coefficients between the clinical indices and the clinical modes scores
Size score | Sphericity score | Conicity score | Wall thickness score | |
|---|---|---|---|---|
EDV | 0.93* | 0.03 | −0.03 | −0.66* |
Sphericity index | −0.06* | −0.87* | −0.05* | −0.04 |
Conicity index | −0.07* | 0.29* | 0.75* | 0.08* |
Wall thickness | 0.37* | 0.11* | −0.08* | −0.63* |
Table 2.
Correlation coefficients between the clinical indices
EDV | Sphericity index | Conicity index | Wall thickness | |
|---|---|---|---|---|
EDV | 1.00 | 0.22* | −0.15* | 0.14* |
Sphericity index | 1.00 | −0.22* | −0.15* | |
Conicity index | 1.00 | −0.03 | ||
Wall thickness | 1.00 |
Table 3.


Correlation coefficients between the clinical mode scores
Stay updated, free articles. Join our Telegram channel

Full access? Get Clinical Tree


