LEARNING OBJECTIVES
1. Recognize the air bronchogram sign on a chest radiograph and computed tomographic (CT) scan and that the sign indicates a lung parenchymal process, including nonobstructive atelectasis, as distinguished from pleural or mediastinal processes.
2. Recognize the air crescent sign on a chest radiograph and CT scan as a sign of a cavity within the lung, often caused by fungal infection.
3. Recognize the continuous diaphragm sign on a chest radiograph and that the sign represents pneumomediastinum.
4. Recognize the CT angiogram sign on a CT scan, and state the mechanism of how the sign is produced (e.g., enhancing pulmonary vessels against a background of low-attenuation material in the lung).
5. Recognize the deep sulcus sign on a supine chest radiograph and that the sign represents a pneumothorax.
6. Recognize the fallen lung sign on a chest radiograph and CT scan and that the sign represents a fractured bronchus.
7. Recognize the flat waist sign on a chest radiograph and that the sign represents lower lobe collapse.
8. Recognize the finger-in-glove sign on a chest radiograph and CT scan and that the sign represents bronchial impaction, which is seen in allergic bronchopulmonary aspergillosis.
9. Recognize the S sign of Golden on a chest radiograph and that the sign represents lobar collapse, potentially caused by an obstructing endobronchial carcinoma in an adult.
10. Recognize the halo sign on a CT scan and that the sign suggests the diagnosis of invasive pulmonary aspergillosis in a leukemic patient.
11. Recognize the Hampton hump sign on a chest radiograph and CT scan and that the sign represents hemorrhagic edema or pulmonary infarction as a result of pulmonary embolism.
12. Recognize the luftsichel sign on a chest radiograph and that the sign is associated with upper lobe collapse, potentially caused by an obstructing endobronchial carcinoma in an adult.
13. Recognize air around the pulmonary artery on frontal and lateral chest radiographs and CT scan as the ring around the artery sign and that the sign represents pneumomediastinum.
14. Recognize loss of the contour of the heart or diaphragm as the silhouette sign, and localize a lung parenchymal process by knowing that a process involving the medial segment of the right middle lobe obscures the right heart border, lingular processes obscure the left heart border, and basilar segmental lower lobe processes obscure the diaphragm.
15. Recognize the split pleura sign on a CT scan as a sign of empyema or other exudative pleural effusion.
16. Recognize the Westermark sign on a chest radiograph and CT scan as a sign of focal oligemia that is potentially caused by pulmonary embolism.
17. Recognize the honeycomb pattern on a chest radiograph and CT scan as a sign of pulmonary fibrosis.
18. Recognize the pattern of septal thickening on a chest radiograph and CT scan as representing thickening of the interlobular septae (Kerley lines) and suggesting the diagnosis of pulmonary edema with smooth septal thickening and lymphangitic carcinomatosis with beaded septal thickening.
19. Recognize a cystic pattern on a chest radiograph and CT scan as suggesting the diagnosis of lymphangioleiomyomatosis in a female patient and Langerhans cell histiocytosis when nodules and an upper lung distribution are seen in a cigarette smoker.
20. Recognize a nodular pattern on a CT scan; classify the nodules as perilymphatic, random, centrilobular, or bronchovascular in distribution; and list an appropriate differential diagnosis for each.
21. Recognize a mosaic pattern of lung attenuation on a CT scan, which suggests an infiltrative process, small airway disease, or pulmonary vascular disease, depending on the caliber of pulmonary vessels, presence of air trapping on expiration, other associated CT findings, and clinical history.
22. Recognize the tree-in-bud pattern on a CT scan, and list an appropriate differential diagnosis, indicating infection and aspiration as the most common causes.
A sign in chest radiology refers to a radiographic and/or CT scan finding that implies a specific pathologic process. Understanding the meaning of a sign indicates comprehension of an important concept related to the radiologic findings. Knowing the name of the sign is not as important as recognizing and understanding the meaning of the radiologic findings, but it will help in communicating with clinicians and radiologists who use the “sign” terminology. A CT “pattern” refers to a nonspecific radiologic finding or collection of findings suggesting one or more specific disease processes. The material that follows is not an all-inclusive list but represents a collection of the more common and useful signs and patterns of focal and diffuse lung disease.
SIGNS
Air Bronchogram Sign
This sign refers to a branching, linear, tubular lucency representing a bronchus or bronchiole passing through airless lung parenchyma (Fig. 2.1). This sign does not differentiate nonobstructive atelectasis from other abnormal parenchymal opacities such as pneumonia. An air bronchogram indicates that the underlying opacity must be parenchymal rather than pleural or mediastinal in location. Although cancers tend to be solid masses, air bronchograms are a characteristic feature of lymphoma and adenocarcinoma in situ (formerly bronchioloalveolar carcinoma, also referred to as BAC).
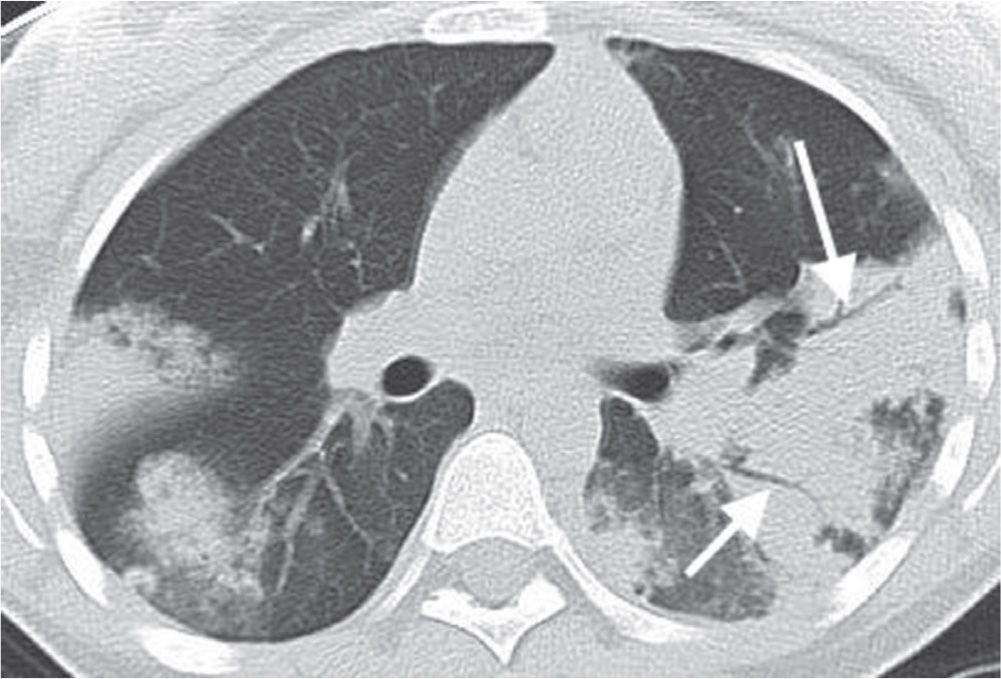
FIG. 2.1 • Air bronchogram sign. CT of a patient with acute eosinophilic pneumonia shows bilateral subpleural areas of airspace opacity with air bronchograms (arrows). Air bronchograms can also be seen with other causes of airspace disease, including infectious pneumonia, hemorrhage, edema, adenocarcinoma in situ (formerly BAC), lymphoma, lipoid pneumonia, “alveolar” sarcoidosis, and alveolar proteinosis, and can also be seen in atelectasis not caused by central obstruction. The presence of the sign indicates that the process is parenchymal in location rather than mediastinal or pleural.
Air Crescent Sign
A mass growing within a preexisting cavity, or an area of pneumonia that undergoes necrosis and cavitates, may form a peripheral crescent of air between the intracavitary mass and the cavity wall, resulting in the air crescent sign (Figs. 2.2 and 2.3). Intracavitary masses are most often caused by mycetomas. In immunocompromised patients with invasive aspergillosis, the appearance of the air crescent sign, representing necrosis and cavitation, indicates recovery of the immune system and white blood cell response to the infection.
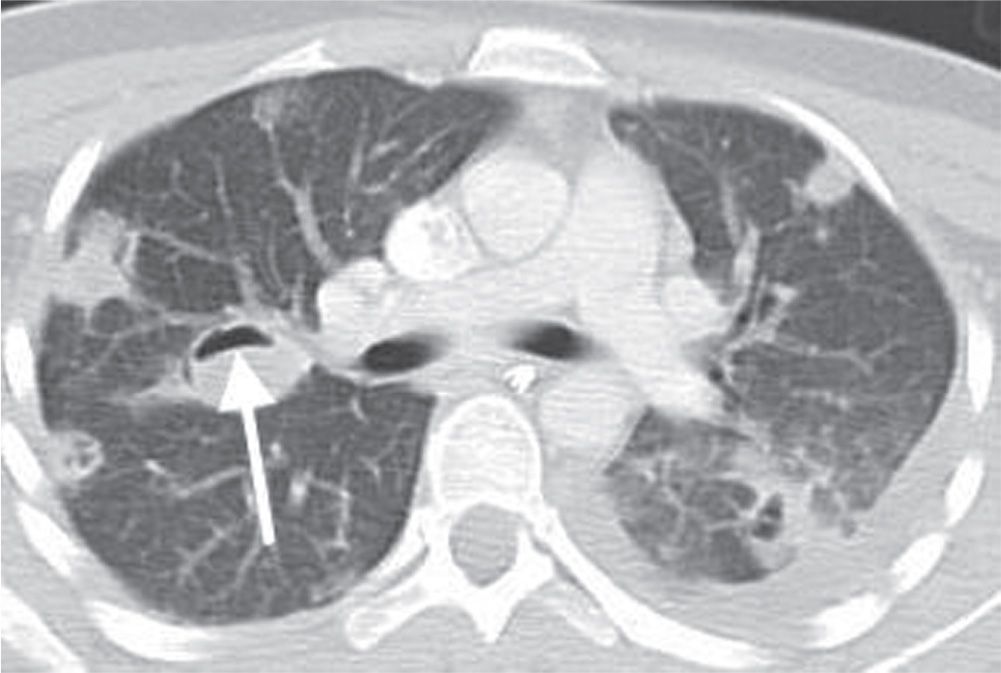
FIG. 2.2 • Air crescent sign. CT of the chest shows bilateral pulmonary nodules in a predominantly subpleural distribution resulting from septic emboli. Some of the nodules are cavitary. A resulting crescent of air (arrow) is contained within and outlined by the thin cavity wall.
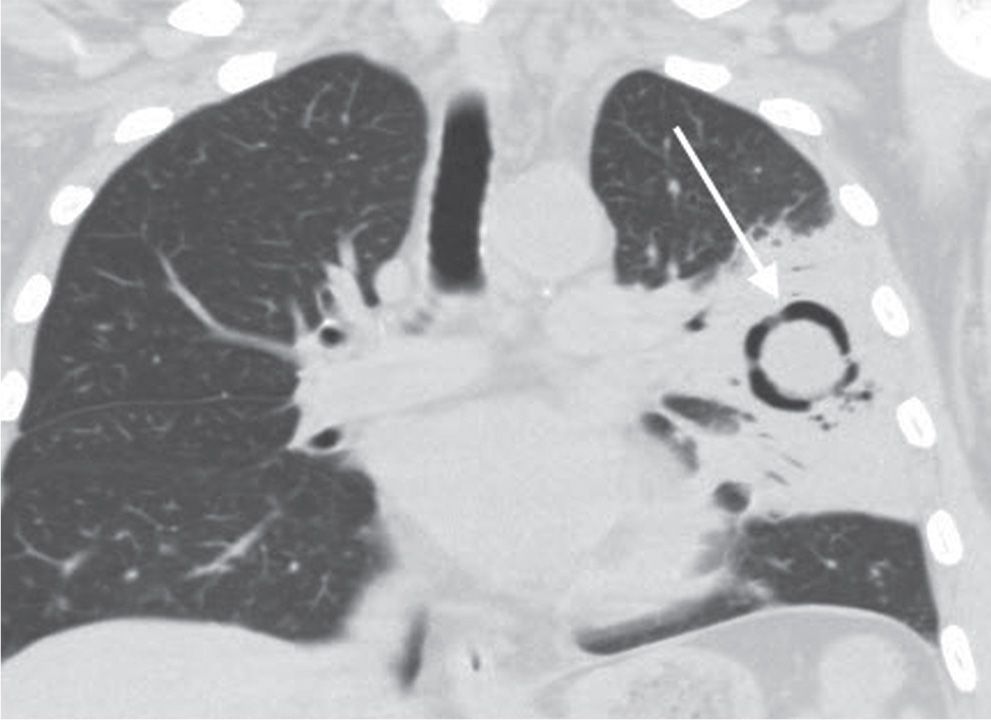
FIG. 2.3 • Air crescent sign. Coronal CT shows a ring of lucency (arrow) within an area of consolidation in this patient with invasive pulmonary aspergillosis.
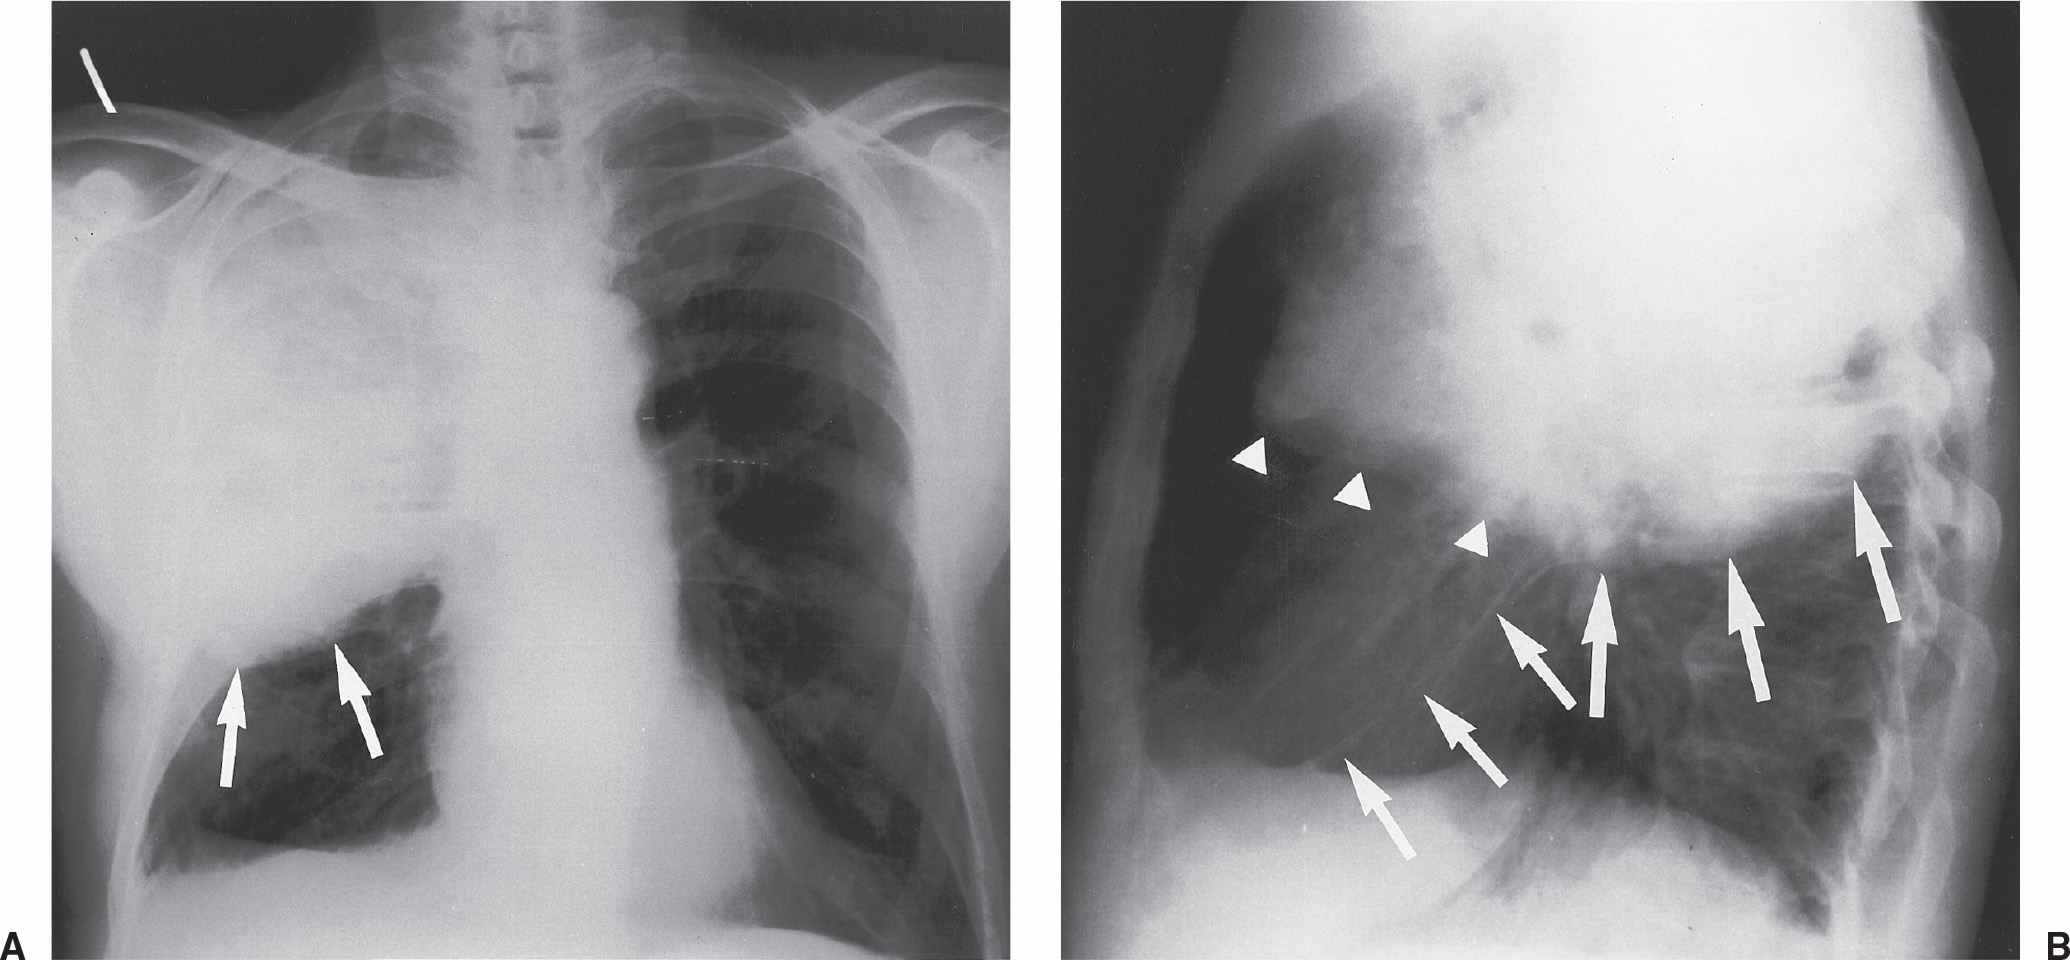
FIG. 2.4 • Bulging fissure sign. A: PA chest radiograph shows dense opacification of the right upper lobe resulting from Klebsiella pneumonia. The inflammatory process is extensive and results in expansion of the lobe and bulging of the fissure inferiorly (arrows). B: Lateral view shows bulging of the superior portion of the major fissure inferiorly (larger arrows). The right upper lobe is outlined by the superior portion of the major fissure and the minor fissure (arrowheads). The middle lobe is outlined by the inferior portion of the major fissure (smaller arrows) and the minor fissure.
Bulging Fissure Sign
Historically, the bulging fissure sign was seen as a result of pneumonia caused by Klebsiella pneumoniae involving the right upper lobe (Fig. 2.4). Also called Friedländer pneumonia, the disease is often confined to one lobe, with consolidation spreading rapidly, causing lobar expansion and bulging of the adjacent fissure inferiorly (1). Other infections and lung neoplasms can also be associated with this sign. Because of timely antibiotic treatment, pneumonia rarely progresses to this state.
Comet Tail Sign
The comet tail sign refers to distorted curving of bronchi and vessels toward a region of rounded atelectasis (2) (see Fig. 3.34). The atelectatic lung abuts an area of pleural thickening, often associated with asbestos-related pleural disease. Rounded atelectasis is most often found in the posterior aspect of the lower lobes and may demonstrate contrast enhancement and contain air bronchograms.
Continuous Diaphragm Sign
This sign is seen as a continuous lucency outlining the base of the heart, representing pneumomediastinum (Fig. 2.5). Air in the mediastinum tracks extrapleurally, between the heart and diaphragm (3). Pneumopericardium can have a similar appearance, but will show air circumferentially outlining the heart.
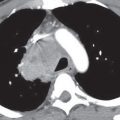
CT Angiogram Sign
This sign refers to the identification of vessels within an airless portion of lung on contrast-enhanced CT (Fig. 2.6). The vessels are prominently seen against a background of low-attenuation material (4,5). This sign has been associated with adenocarcinoma in situ (formerly BAC) and lymphoma, but it can also be seen with other processes, including many infectious pneumonias.
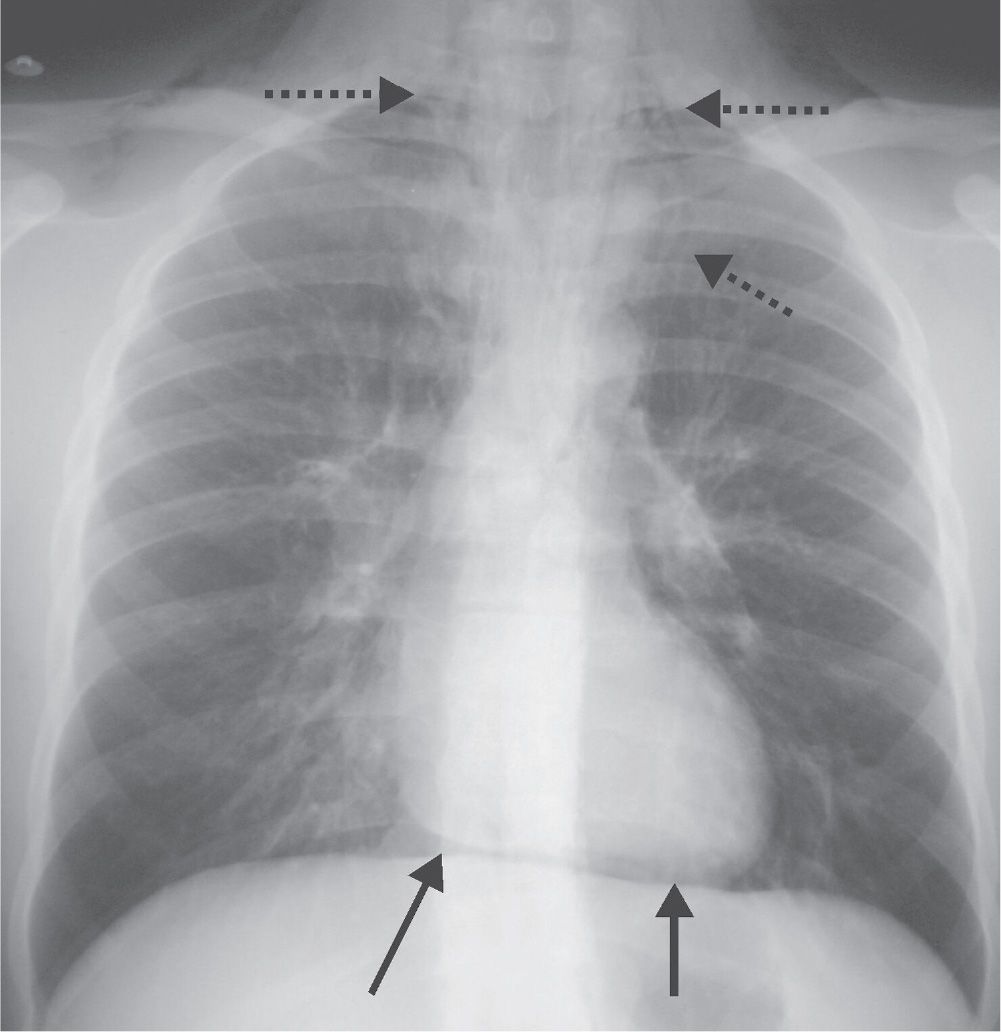
FIG. 2.5 • Continuous diaphragm sign. In this patient with pneumomediastinum, a continuous lucency is seen between the heart and the diaphragm (solid arrows). Air in the mediastinum is also seen tracking into the neck bilaterally (dashed arrows).
Deep Sulcus Sign
This sign refers to a deep, sometimes fingerlike collection of intrapleural air (pneumothorax) in the costophrenic sulcus as seen on the supine chest radiograph (6). In the supine patient, air rises to the nondependent anteromedial basilar pleural space and may not cause displacement of the apical or lateral visceral pleural line, as seen on upright chest radiographs (Fig. 2.7). When present, this sign may represent a pneumothorax that is much larger than initially expected.
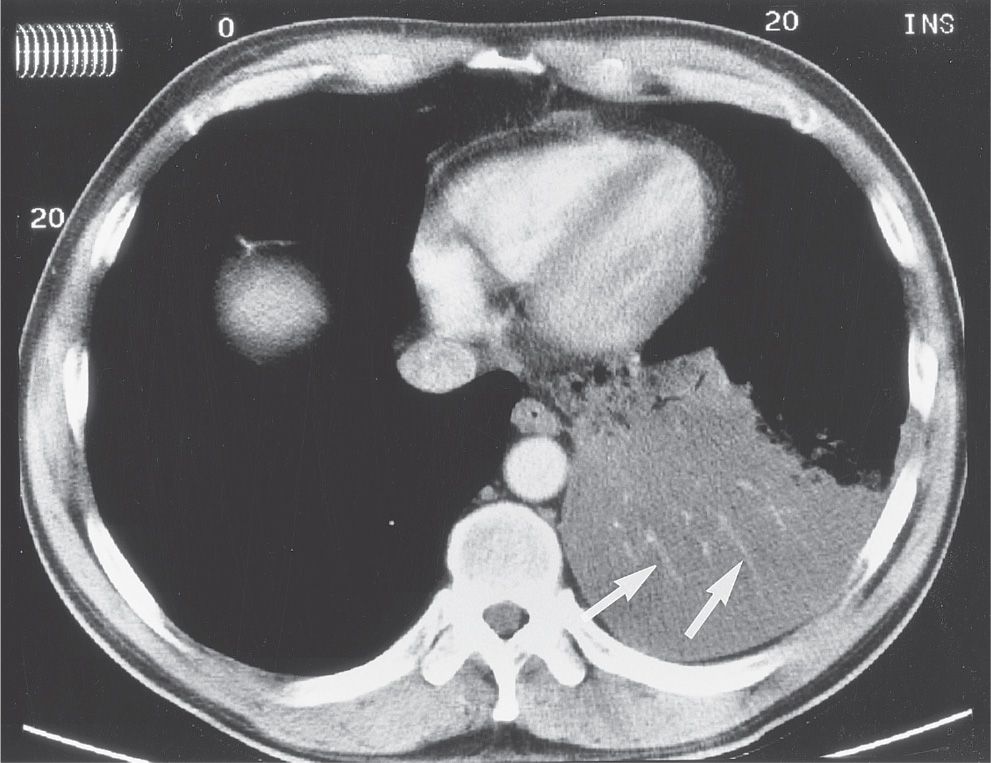
FIG. 2.6 • CT angiogram sign. CT with intravenous contrast shows opacification of the left lower lobe from adenocarcinoma in situ (formerly BAC). The pulmonary vessels (arrows) are seen prominently against a background of low-attenuation mucus within the tumor. Other processes producing low-attenuation material within the lung can also produce this sign, including lymphoma, lipoid pneumonia, and bacterial pneumonia.
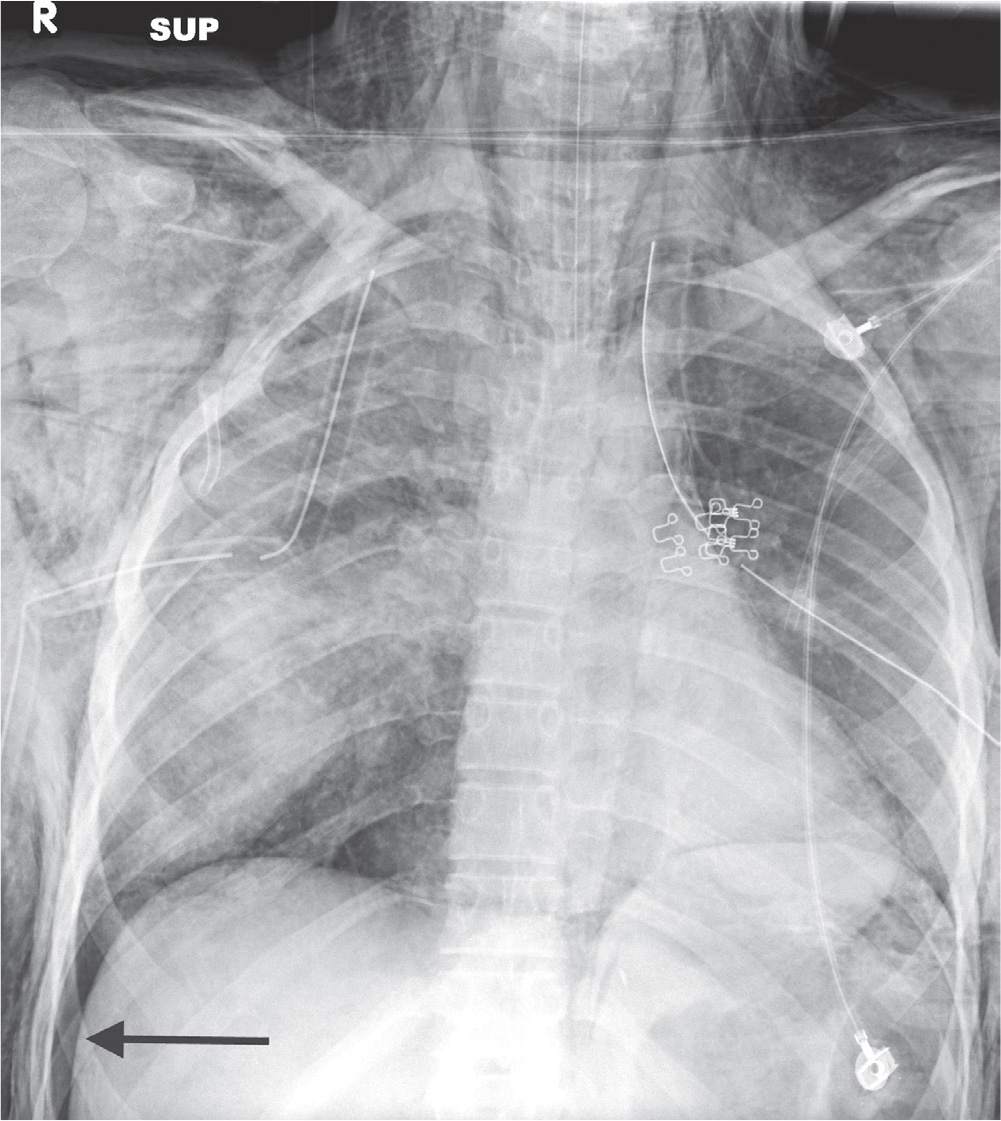
FIG. 2.7 • Deep sulcus sign. Anteroposterior (AP) supine chest radiograph of a patient involved in a motor vehicle crash shows a right basilar pneumothorax (arrow), which expands the costophrenic sulcus creating a tonguelike extension of air that continues inferiorly along the right lateral chest wall. Note bilateral lung contusions, pneumomediastinum, and bilateral subcutaneous emphysema.
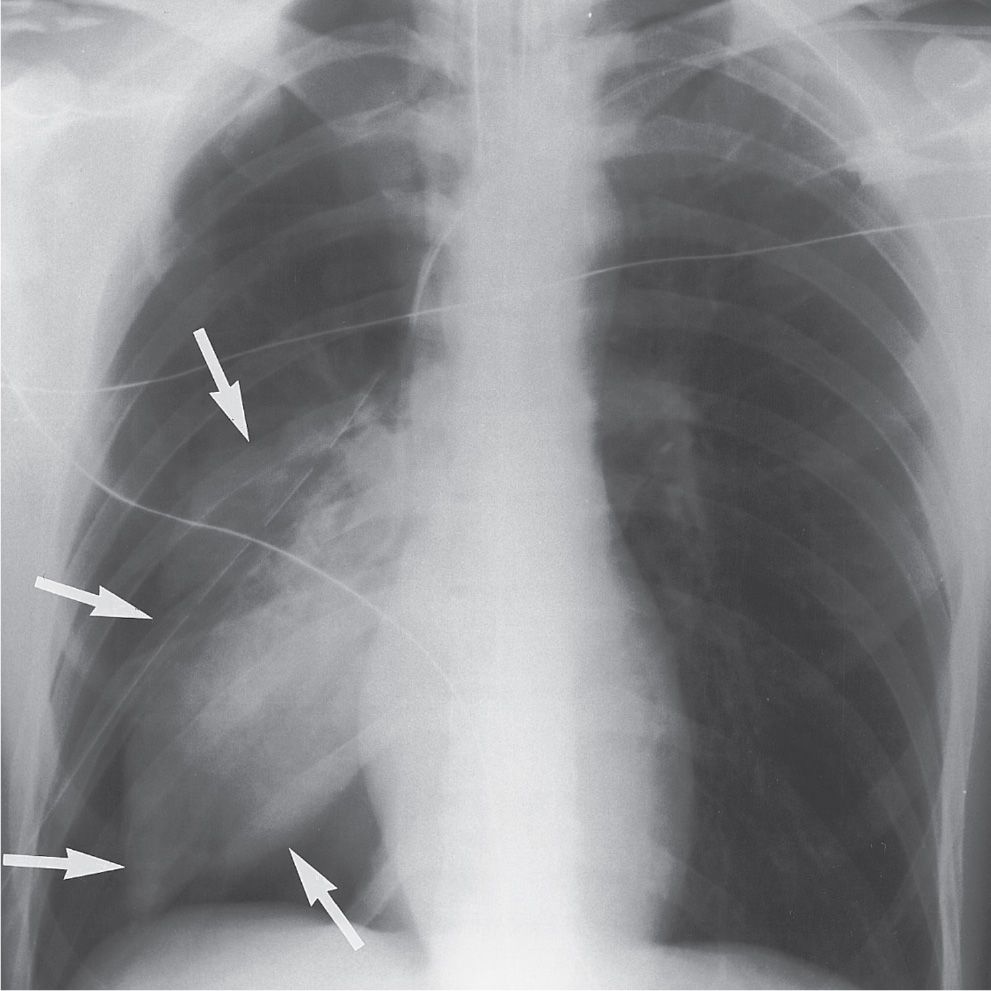
FIG. 2.8 • Fallen lung sign. AP supine chest radiograph of a man involved in a motor vehicle crash. There is a large pneumothorax on the right, which persists with adequate chest tube placement, as a result of a fractured right mainstem bronchus. The lung has collapsed inferiorly and laterally (arrows), instead of toward the hilum, because it is hanging from a fractured pedicle (bronchus).
Fallen Lung Sign
This sign refers to the appearance of a collapsed lung occurring with a fractured bronchus and large pneumothorax (7). The bronchial fracture results in the collapsed lung “falling” away from the hilum, either inferiorly and laterally in an upright patient (Fig. 2.8) or posteriorly, as seen on CT in a supine patient. A typical pneumothorax, not associated with a bronchial tear, causes a lung to collapse inward toward the hilum.
Flat Waist Sign
This sign refers to flattening of the contours of the aortic knob and adjacent main pulmonary artery (Fig. 2.9). It is seen with collapse of the left lower lobe and is caused by leftward displacement and rotation of the heart (8).
Finger-in-Glove Sign
In allergic bronchopulmonary aspergillosis, a clinical disorder secondary to Aspergillus hypersensitivity, the bronchi become impacted with mucus, cellular debris, eosinophils, and fungal hyphae. The impacted bronchi appear radiographically as opacities with distinctive shapes (Fig. 2.10), variously described as “gloved finger,” “Y,” “V,” “inverted V,” “toothpaste,” and so forth (9). Other entities associated with this sign include asthma, cystic fibrosis, obstructing airway neoplasms (Fig. 2.11), and bronchial atresia.
Golden S Sign
When the right upper lobe bronchus is obstructed by an endobronchial mass, causing collapse of the right upper lobe, the minor fissure is elevated peripherally but not centrally where it drapes around the mass (Fig. 2.12). The fissure’s concavity toward the lung peripherally and convexity toward the lung centrally creates the shape of an S or a reverse S (10). This sign is important because it signifies the presence of a central obstructing mass that, in an adult, may represent bronchogenic carcinoma.
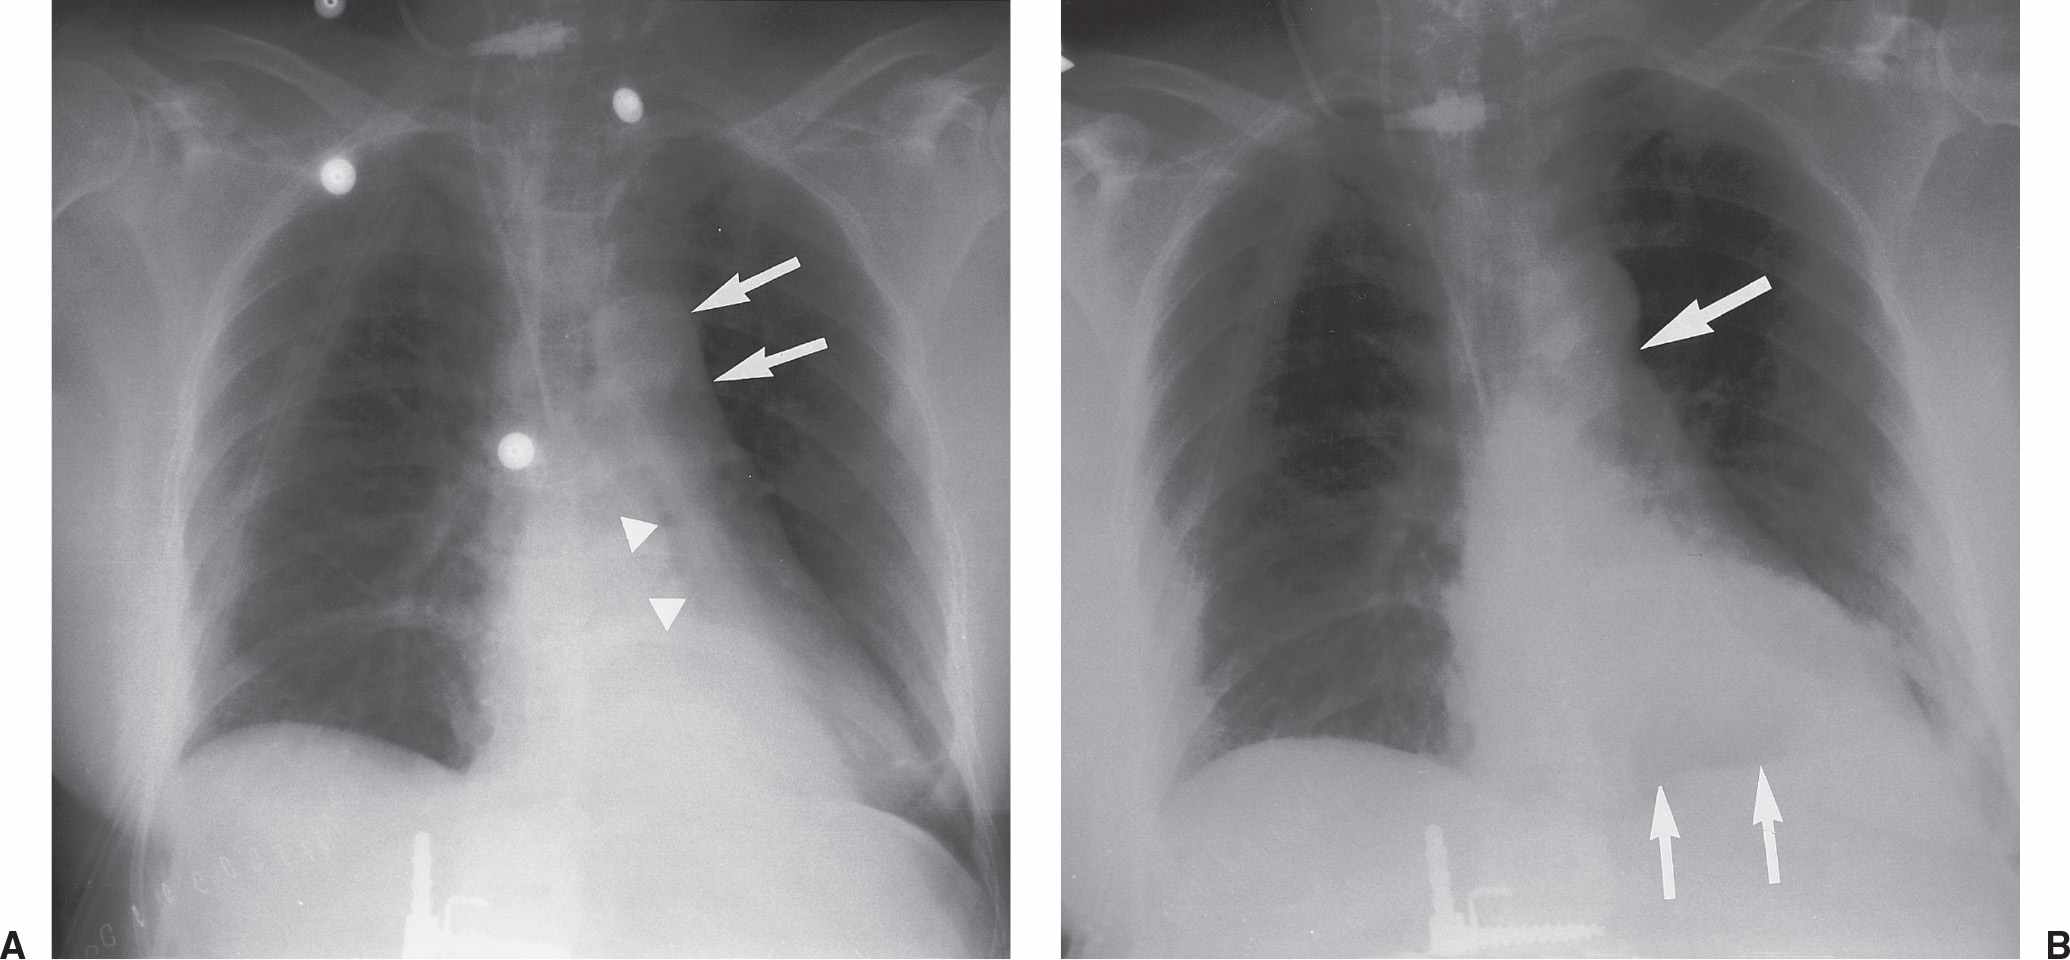
FIG. 2.9 • Flat waist sign. A: Frontal chest radiograph shows left lower lobe opacification from left lower lobe collapse. Note the loss of the medial contour of the left hemidiaphragm, which is known as the silhouette sign. The left lower lobe bronchus has a more vertical course than normal (arrowheads). Leftward displacement and rotation of the heart in left lower lobe collapse results in flattening of the contours of the aortic knob and adjacent main pulmonary artery (arrows), termed the flat waist sign. B: Frontal chest radiograph obtained 1 day later shows partial reexpansion of the left lower lobe. The medial left hemidiaphragm is now visible (smaller arrows). There is a notch between the aorta and the pulmonary artery (larger arrow) and no flat waist sign.
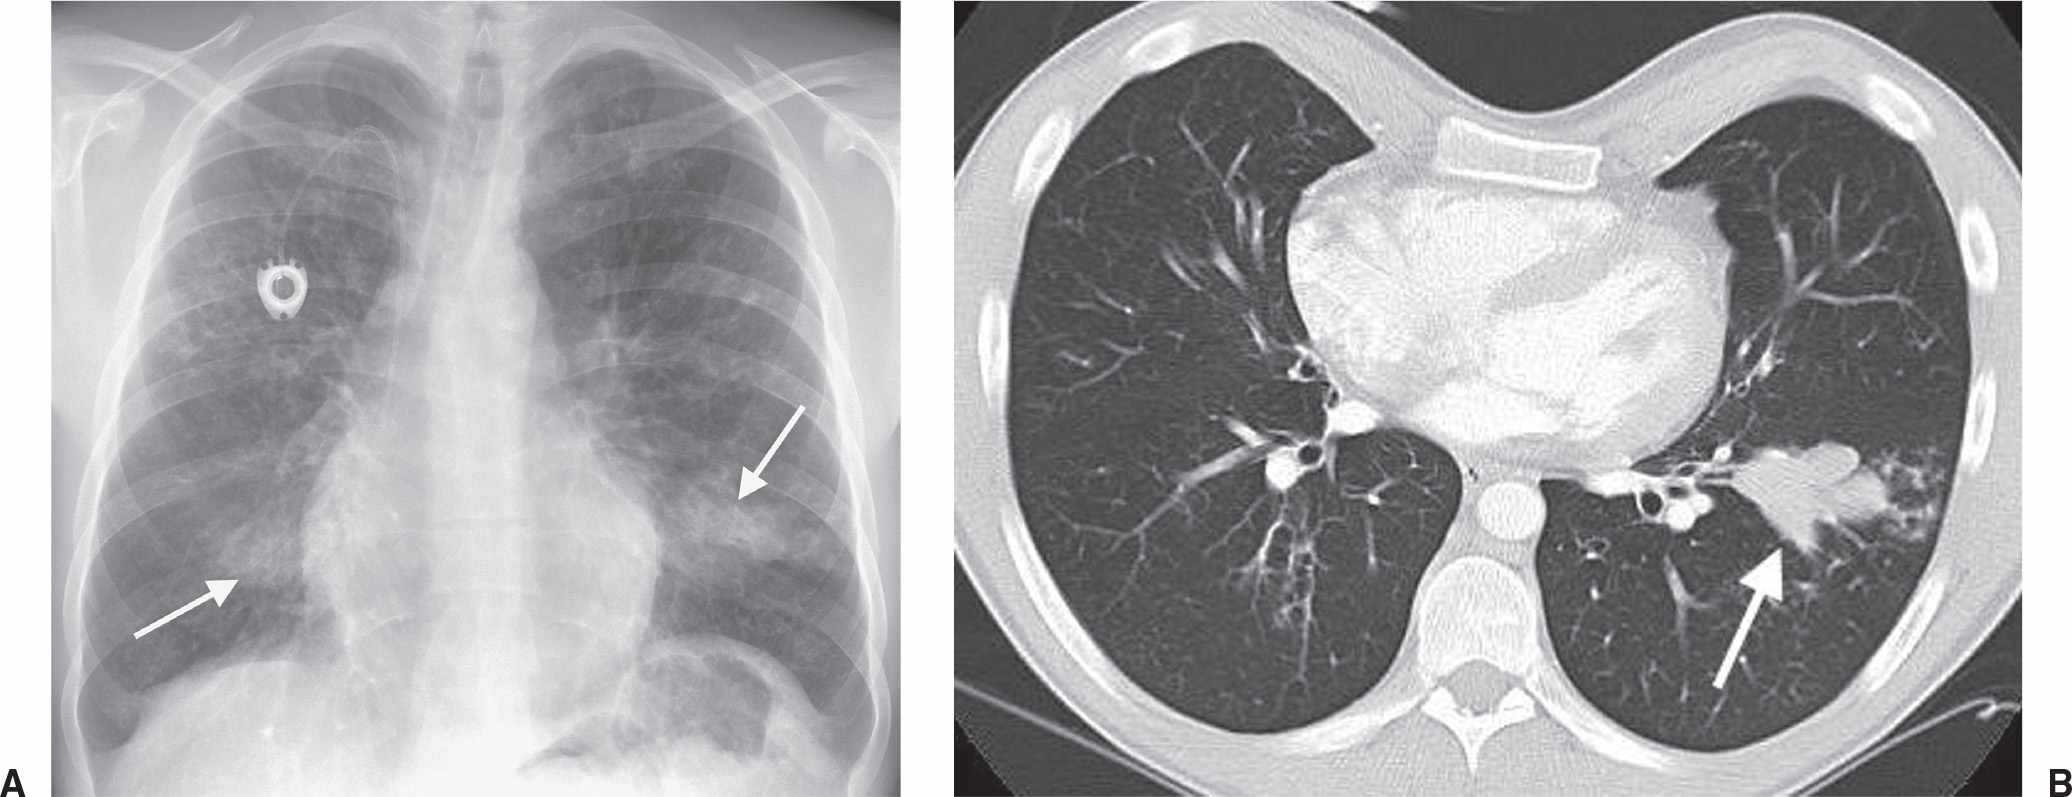
FIG. 2.10 • Finger-in-glove sign. A: PA chest radiograph of a patient with cystic fibrosis and allergic bronchopulmonary aspergillosis. Bronchi impacted and distended with mucus, cellular debris, eosinophils, and fungal hyphae produce tubular or masslike opacities, as seen in both lower lobes (arrows). Also shown is diffuse bronchiectasis related to cystic fibrosis. B: CT scan of the same patient shows dilated and impacted central bronchi in the left lower lobe (arrow).
Halo Sign
This sign refers to ground-glass attenuation on CT scanning that surrounds, or forms a halo around, a denser nodule or area of consolidation (Fig. 2.13). Although most hemorrhagic pulmonary nodules produce this sign (11), when seen in patients with acute leukemia, the halo sign suggests early invasive pulmonary aspergillosis (12).
Hampton Hump Sign
Pulmonary infarction secondary to pulmonary embolism produces an abnormal area of opacification on the chest radiograph, which is always in contact with the pleural surface (Fig. 2.14). The opacification may assume a variety of shapes. When the central margin is rounded, a “hump” is produced, as described by Hampton and Castleman (13).
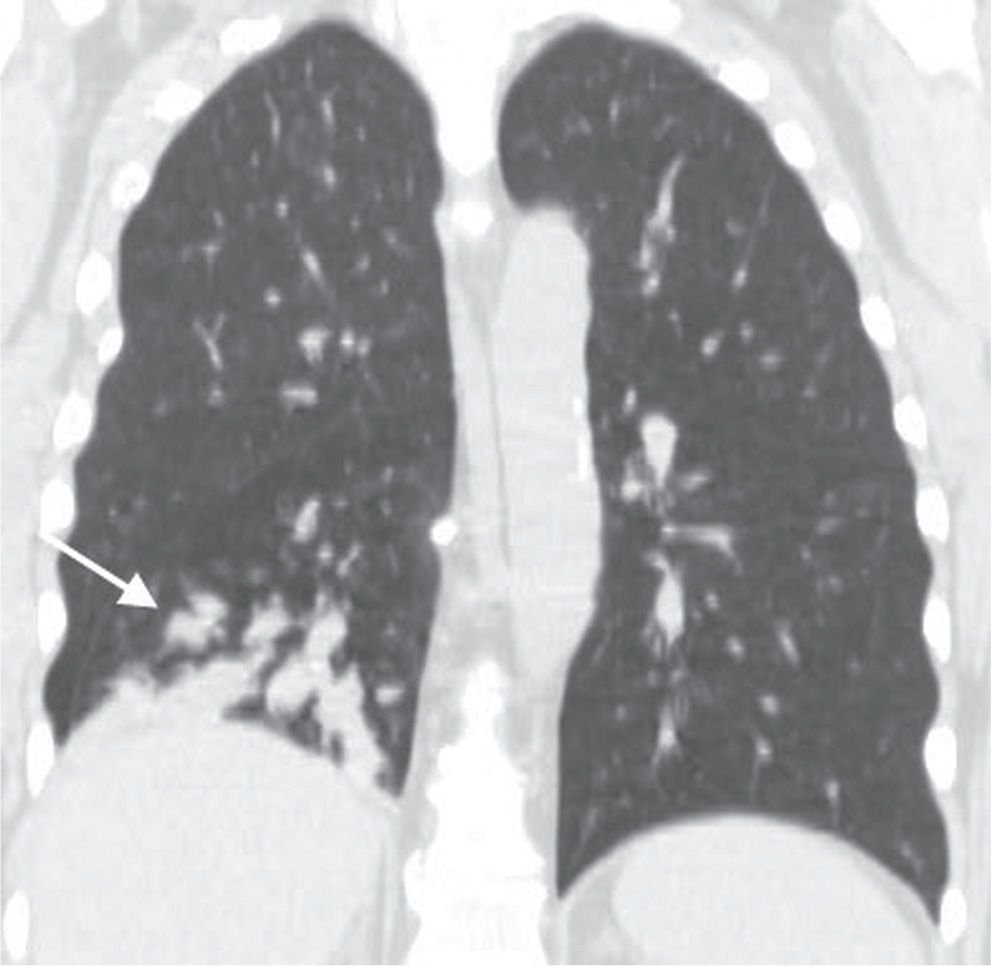
FIG. 2.11 • Finger-in-glove sign. Coronal CT of a patient with an obstructing central neoplasm shows opaque tubular opacities in the right lower lobe (arrow).
Hilum Overlay Sign
Originally described by Benjamin Felson (14), the hilum overlay sign refers to the evaluation of densities projecting over the hila on posteroanterior (PA) chest radiographs. If the opacity does not obscure the underlying hilar vessels, then it can be assumed that the mass is anterior or posterior to the centrally located vascular structures and the intervening aerated lung enables clear visualization of the pulmonary vessels (Fig. 2.15). Conversely, when the mass is inseparable from the hilar vessels, it is assumed that the structures are immediately adjacent to one another.
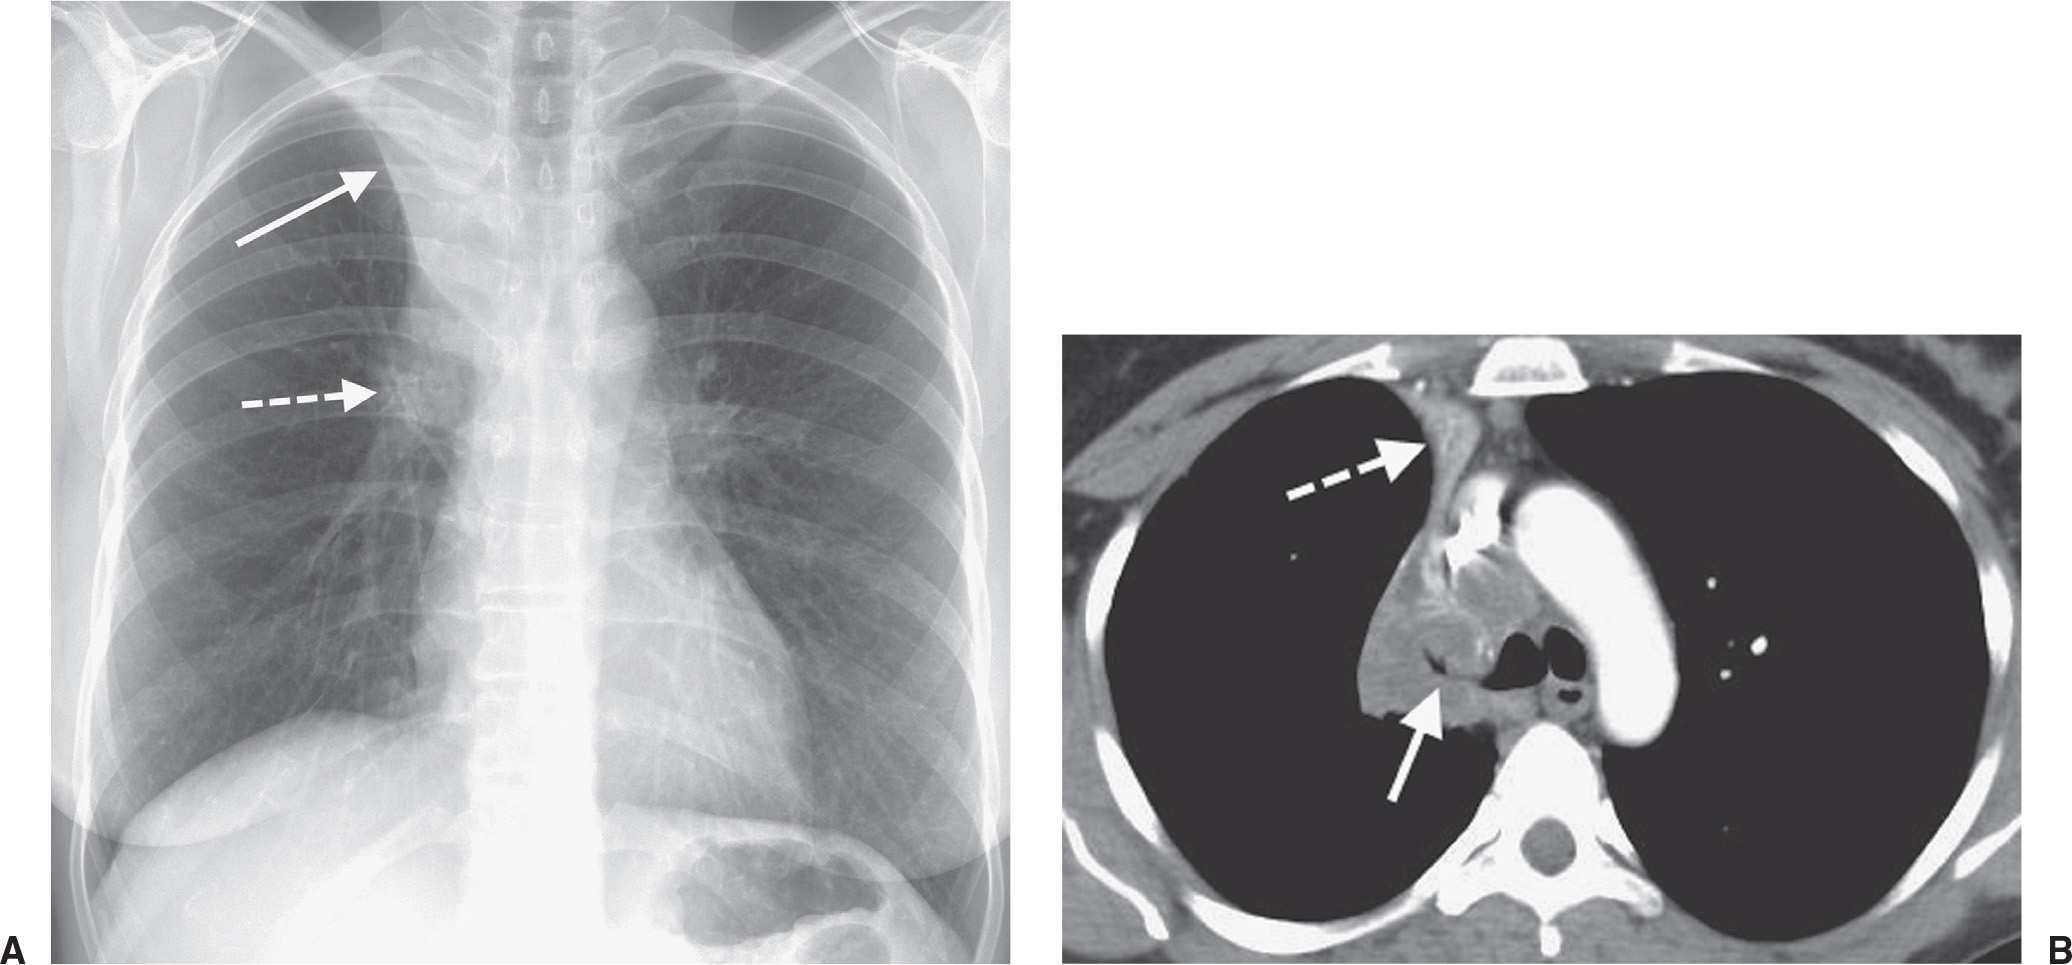
FIG. 2.12 • Golden S sign. A: PA chest radiograph of a man with right upper lobe bronchogenic carcinoma. The endobronchial tumor causes collapse of the right upper lobe and upward displacement of the minor fissure (solid arrow). The tumor mass produces a convex margin toward the lung at the right hilum (dashed arrow). The contour of the displaced fissure and central mass creates a reverse S shape. Note the elevation of the right hemidiaphragm, another sign of right upper lobe volume loss. B: CT of the chest shows tumor encasing and occluding the right upper lobe bronchus (solid arrow) and collapse of the right upper lobe, with superior and medial displacement of the minor fissure (dashed arrow).
Juxtaphrenic Peak Sign
This sign refers to a small triangular shadow that obscures the dome of the diaphragm (Fig. 2.16), secondary to upper lobe atelectasis (15). The shadow is caused by traction on the lower end of the major fissure, the inferior accessory fissure, or the inferior pulmonary ligament.
Knuckle Sign
In the setting of massive acute pulmonary embolism, the right or left pulmonary artery may be enlarged by the presence of intraluminal clot. This along with the abrupt tapering of the occluded pulmonary artery distally creates the “knuckle sign” (Fig. 2.17) (16).
Luftsichel Sign
In left upper lobe collapse, the superior segment of the left lower lobe, which is positioned between the aortic arch and the collapsed left upper lobe, is hyperinflated. This aerated segment of left lower lobe is hyperlucent and shaped like a sickle, where it outlines the aortic arch on the frontal chest radiograph (Fig. 2.18). This periaortic lucency has been termed the luftsichel sign, derived from the German words luft (air) and sichel (sickle) (17). Although this sign can also be seen on the right, it is more common on the left because of the difference in anatomy and the presence of a minor fissure on the right. This sign and associated findings of upper lobe collapse signify the probable diagnosis of bronchogenic carcinoma in an adult.
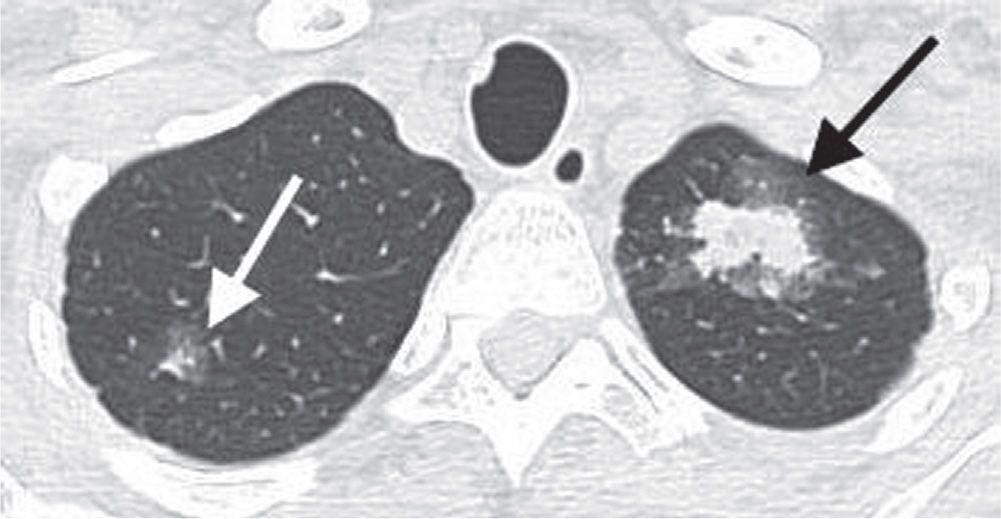
FIG. 2.13 • Halo sign. CT shows nodular consolidation associated with a halo of GGO in both apices (arrows) resulting from invasive pulmonary aspergillosis. This halo represents hemorrhage and, when seen in leukemic patients, is highly suggestive of the diagnosis of invasive pulmonary aspergillosis.
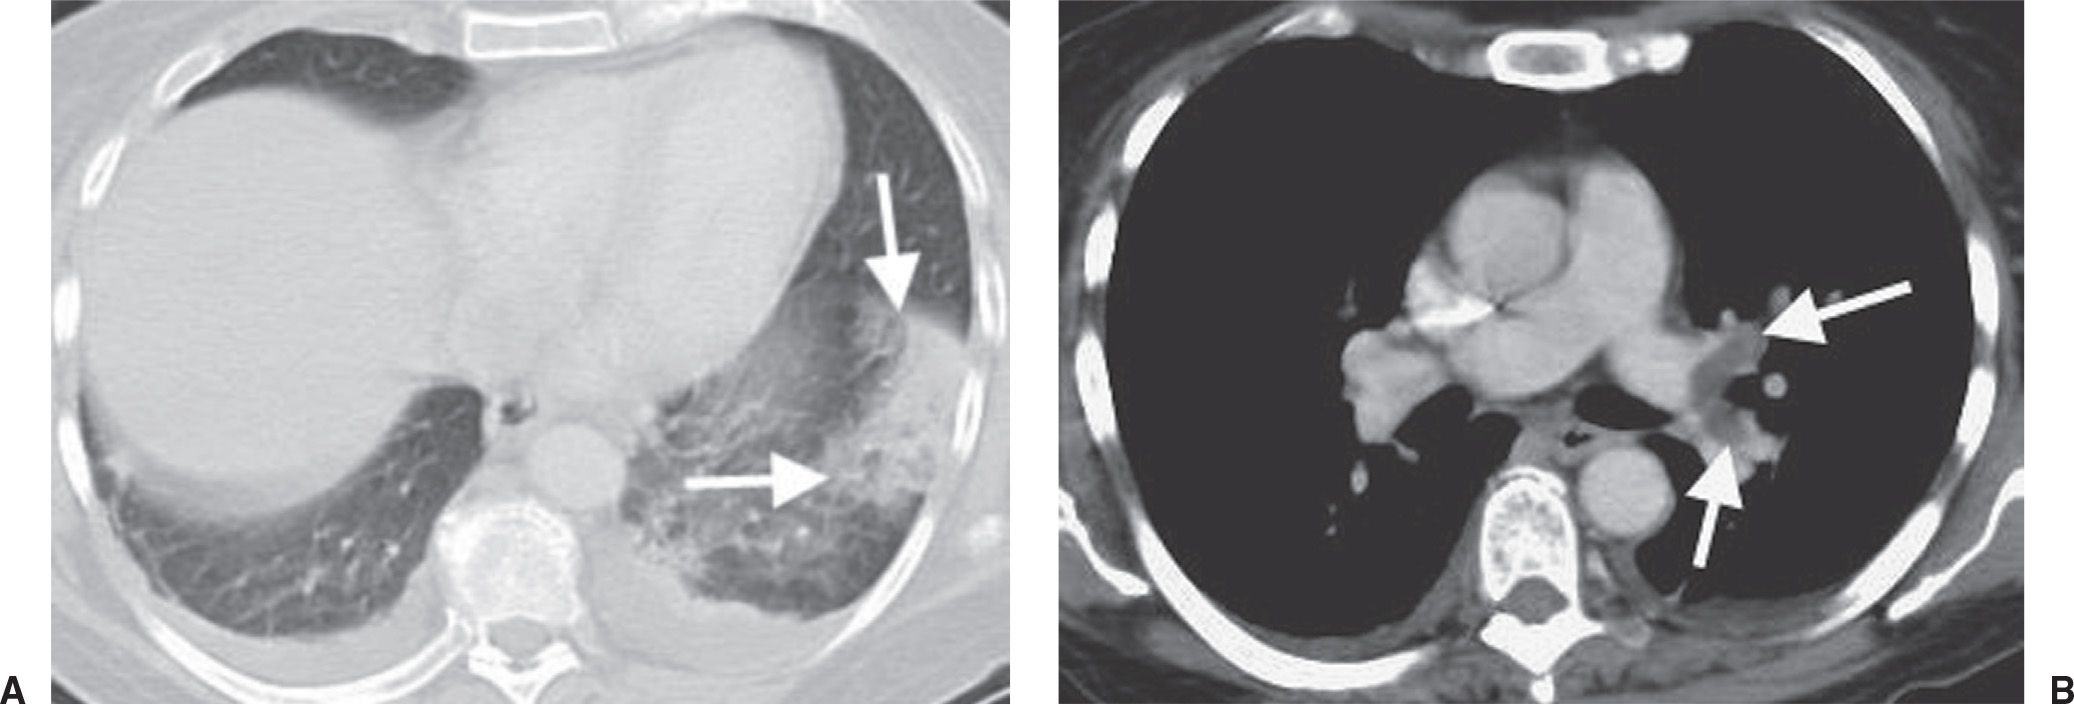
FIG. 2.14 • Hampton hump sign. A: CT with lung windowing shows a focal subpleural area of consolidation in the left lower lobe (arrows). This hump-shaped area of opacification represents pulmonary infarction secondary to pulmonary embolism. There are also small bilateral pleural effusions, which are commonly seen with acute pulmonary emboli. B: CT with mediastinal windowing shows low-attenuation filling defect, which represents a saddle embolus (arrows) bridging the lingular and left lower lobe pulmonary arteries.
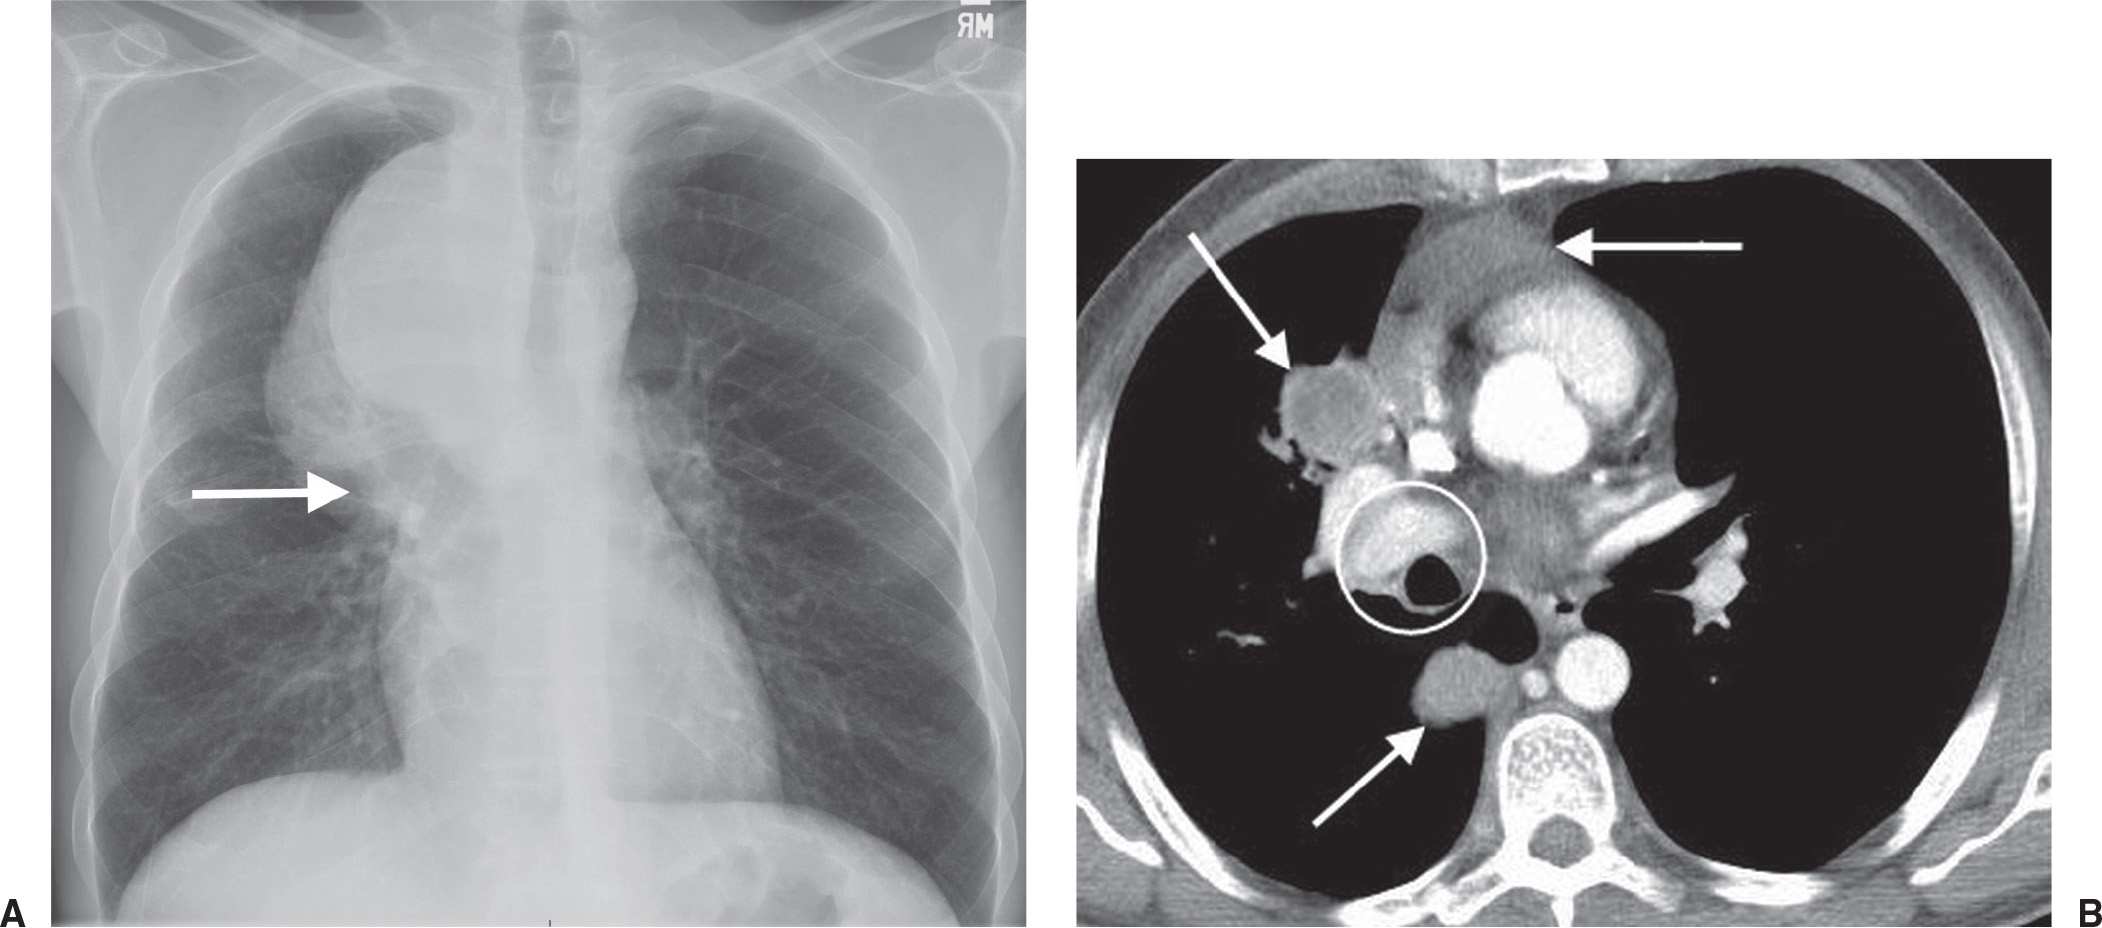
FIG. 2.15 • Hilum overlay sign. A: PA chest radiograph of a 47-year-old man with shortness of breath and a poorly differentiated non-small-cell lung cancer shows a mass partially projected over the right hilum. The right hilar vascular structures (arrow) remain visible. B: CT scan at the origin of the right hilum (circle) shows the mass (arrows) to be anterior and posterior to the right hilum.
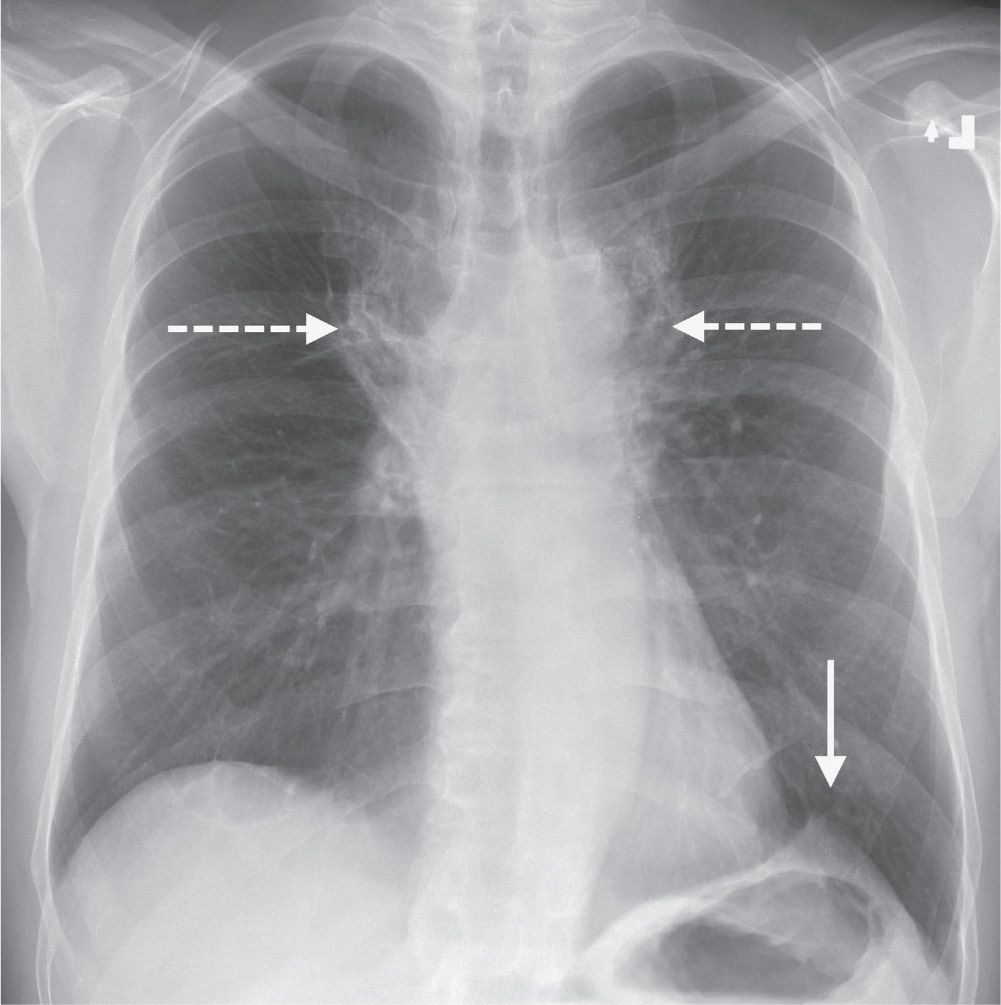
FIG. 2.16 • Juxtaphrenic peak sign. PA chest radiograph of a man treated with mediastinal radiation shows paramediastinal radiation fibrosis (dashed arrows) and upward retraction of both hila. There is tenting of the left hemidiaphragm (solid arrow), indicating a loss of left upper lobe volume, seen as the juxtaphrenic peak sign.
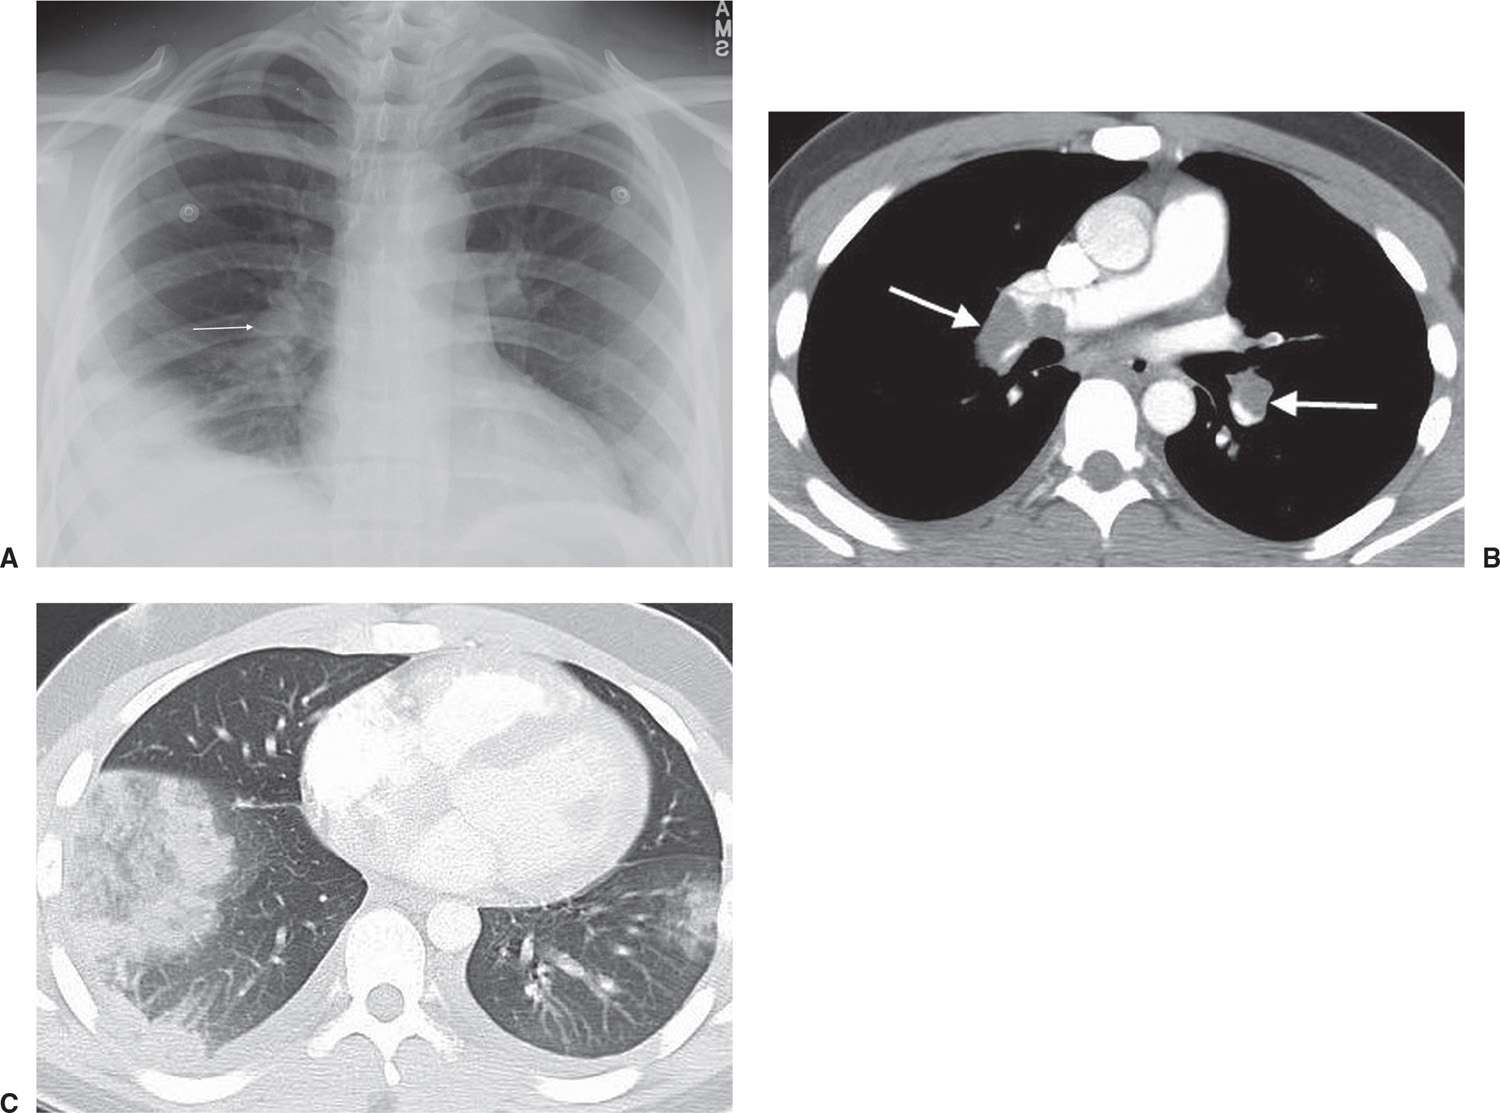
FIG. 2.17 • Knuckle sign. A: PA chest radiograph shows an enlarged right pulmonary artery (arrow) and abnormal opacity in the right lower lobe. B: CT scan shows low-density thrombus in the right and left pulmonary arteries (arrows). C: CT with lung windowing shows pleural-based, dense GGO in the lower lobes, right greater than left, representing hemorrhagic edema related to acute pulmonary emboli.
Melting Ice Cube Sign
This sign refers to the peripheral resolution of a pulmonary infarct on a chest radiograph or CT scan, akin to that of the outside of an ice cube melting (Fig. 2.19). This is distinguished from the pattern of resolving pneumonia, where the opacification resolves in a patchy fashion, both centrally and peripherally (18).
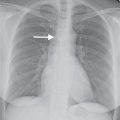
Ring Around the Artery Sign
This sign refers to a well-defined lucency encircling either pulmonary artery (Fig. 2.20), as seen on frontal and lateral chest radiographs, representing pneumomediastinum (19).
Scimitar Sign
In patients with pulmonary venolobar syndrome and partial anomalous pulmonary venous return to the infradiaphragmatic inferior vena cava, a curved shadow resembling a Turkish sword, or scimitar, extends inferiorly toward the diaphragm along the right side of the heart (20) (see Figs. 16.6 and 16.7).
Signet Ring Sign
When a normal-sized pulmonary artery abuts a dilated bronchus, the appearance resembles that of a signet ring in cross section (21) (Fig. 2.21).
Silhouette Sign
Felson and Felson (22) popularized the term silhouette sign to indicate an obliteration of the borders of the heart, other mediastinal structures, or diaphragm by an adjacent opacity of similar density. An intrathoracic lesion not anatomically contiguous with a border of one of these structures will not obliterate that border. Parenchymal processes involving the medial segment of the right middle lobe obliterate the right heart border (Figs. 2.22 and 2.23). If the lingula is involved, the left heart border is obliterated (Fig. 2.24). Lower lobe processes involving one or more basilar segments result in obliteration of all or a part of the border of the diaphragm.
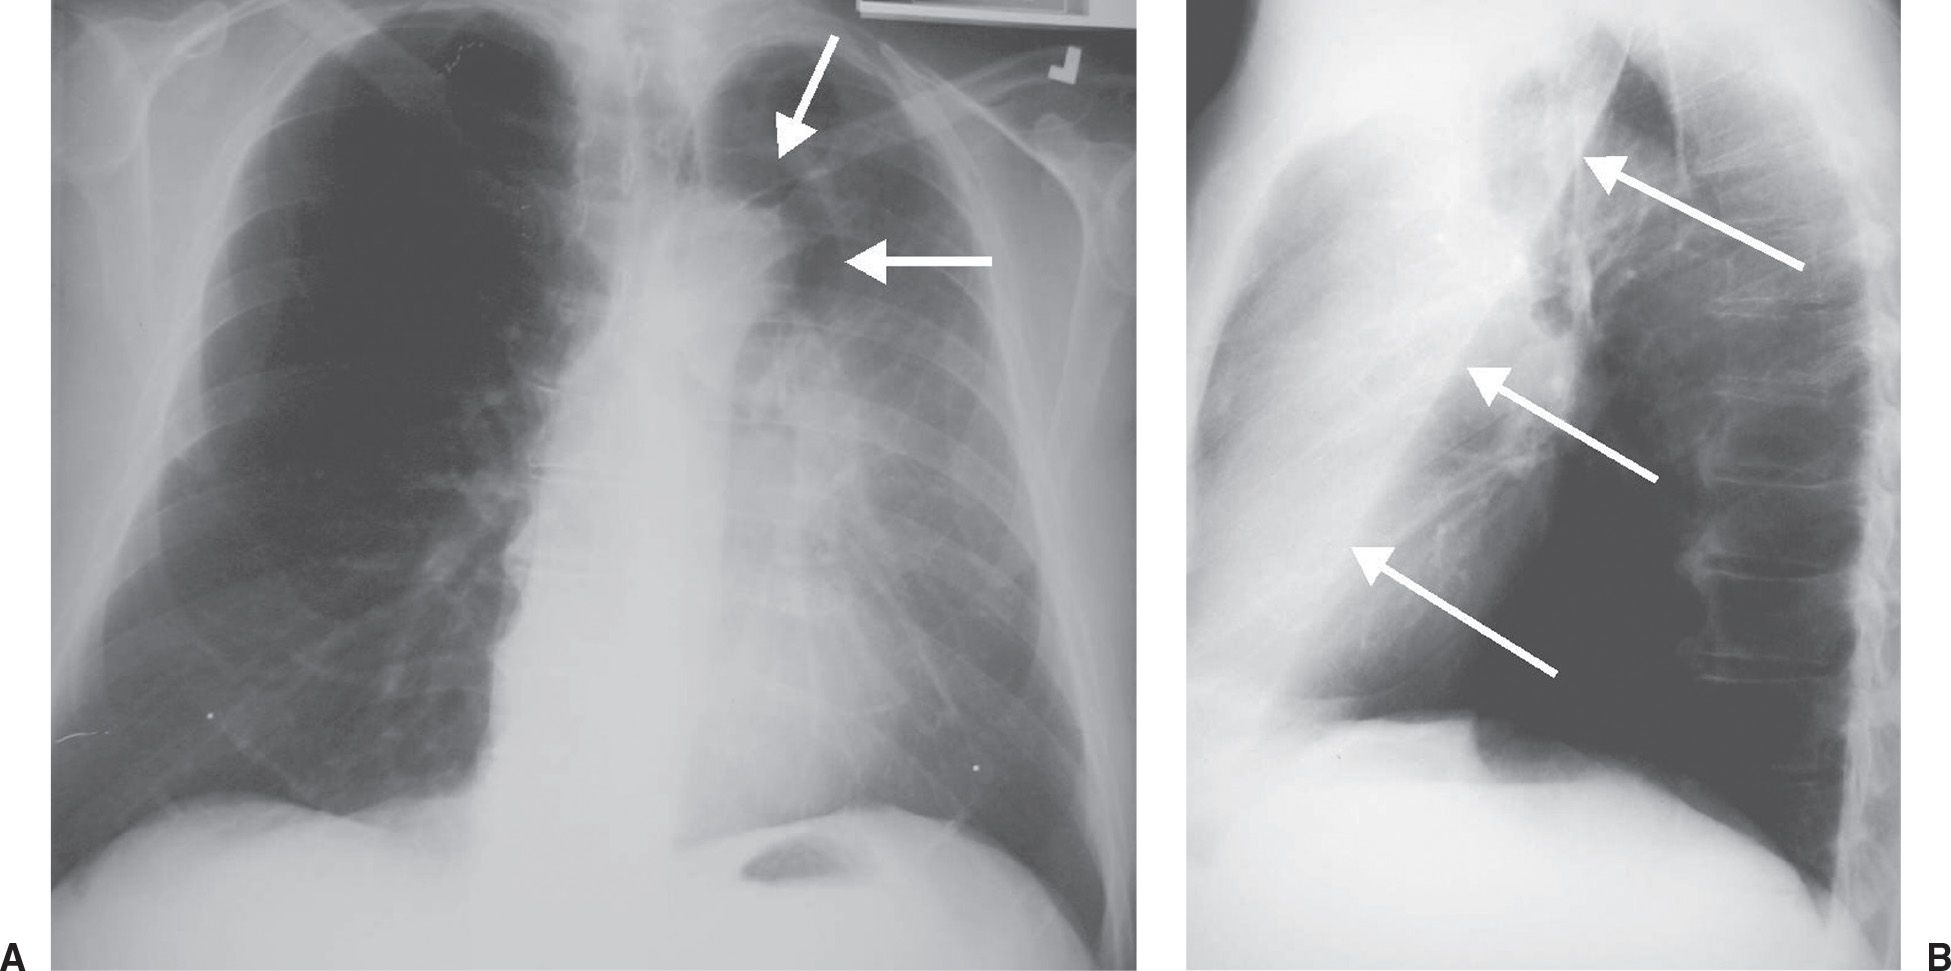
FIG. 2.18 • Luftsichel sign. A: PA chest radiograph shows a crescentic lucency adjacent to the aortic arch (arrows), representing hyperaeration of the superior segment of the left lower lobe, which is positioned between the aortic arch medially and the collapsed left upper lobe laterally. There is hazy opacification of the left lung (sparing the apex and costophrenic angle), elevation of the left hemidiaphragm, and partial obscuration of the left heart border (the silhouette sign), indicating a loss of left upper lobe volume. B: Lateral view shows anterior displacement of the major fissure (arrows). The superior extent of the displaced fissure indicates extension of the superior segment of the lower lobe to the lung apex. The luftsichel sign is just one sign of upper lobe collapse. The associated signs of volume loss make the diagnosis obvious. In an adult, left upper lobe collapse is highly suggestive of an obstructing bronchogenic carcinoma.
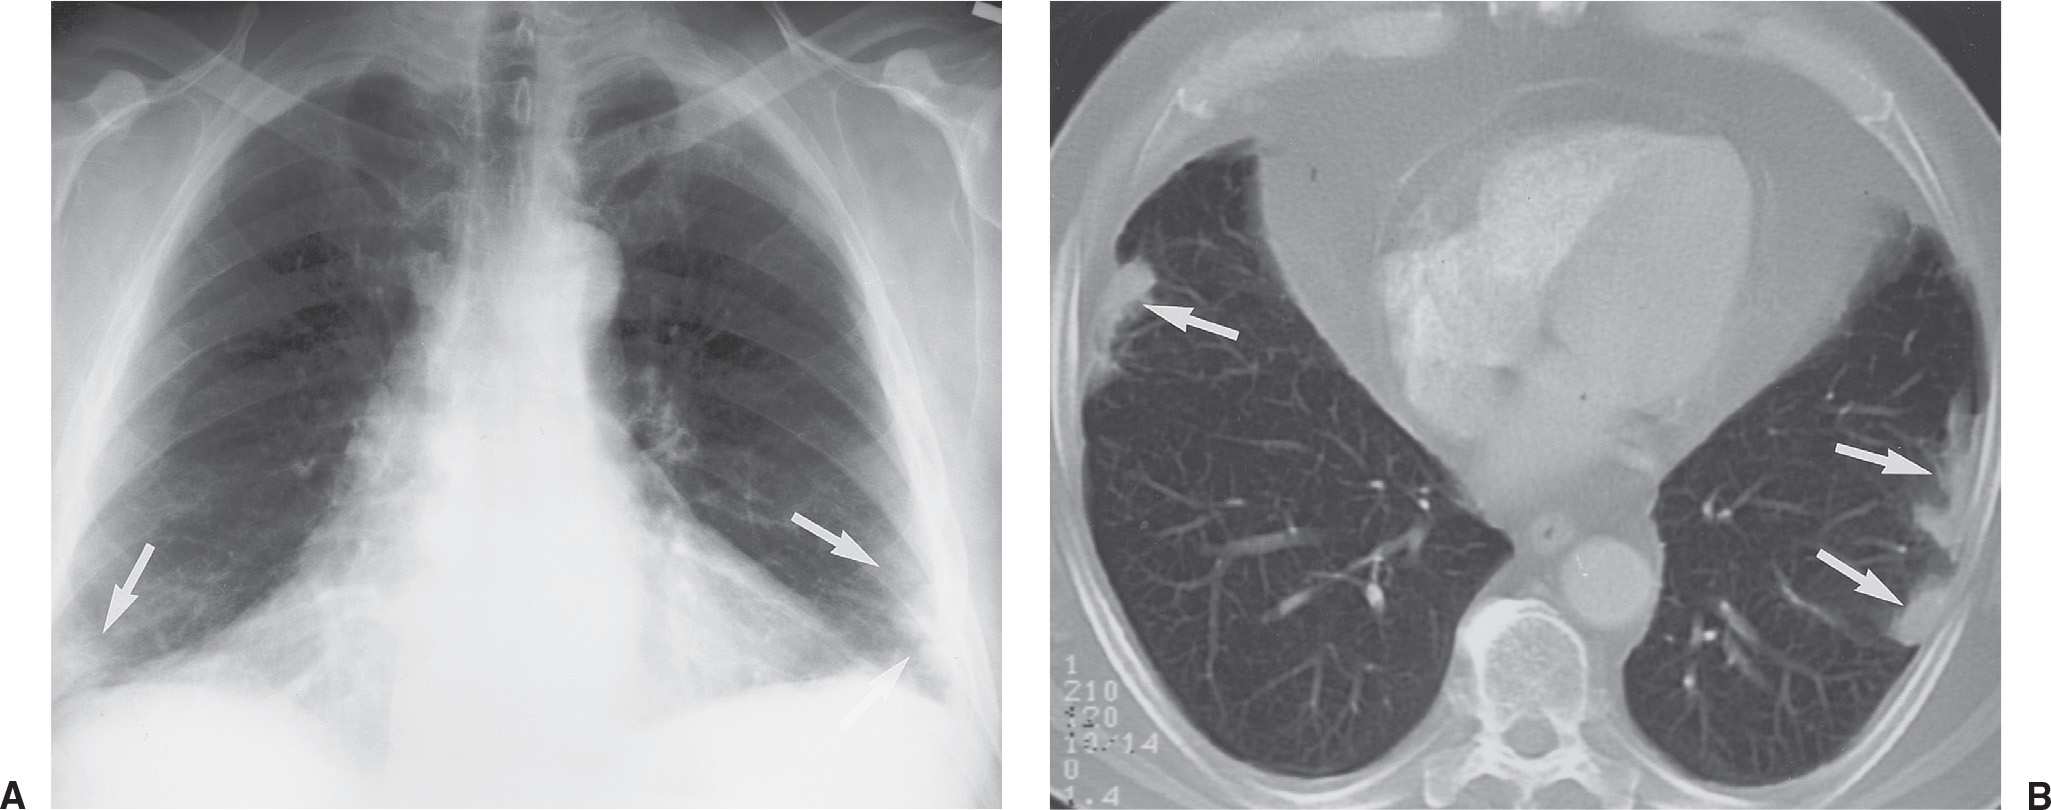
FIG. 2.19 • Melting ice cube sign. A: PA chest radiograph of a 69-year-old man with a 6-week history of cough, pleuritic chest pain, and hemoptysis shows bilateral, subpleural airspace opacities at the costophrenic angles (arrows), representing parenchymal infarcts. B: CT scan obtained 2 weeks later shows bilateral peripheral opacities (arrows), an appearance typical of resolving pulmonary infarcts. Note that the opacities are not wedge-shaped or rounded, as expected with acute infarcts. Infarcts resolve from the periphery inward, like a melting ice cube.
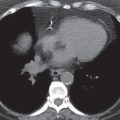
Split Pleura Sign
Normally, the thin visceral and parietal pleura cannot be distinguished as two separate structures on CT scanning. With an exudative pleural effusion, such as empyema (Figs. 2.25 and 2.26), the fluid separates or “splits” the thickened and enhancing pleural layers (23).
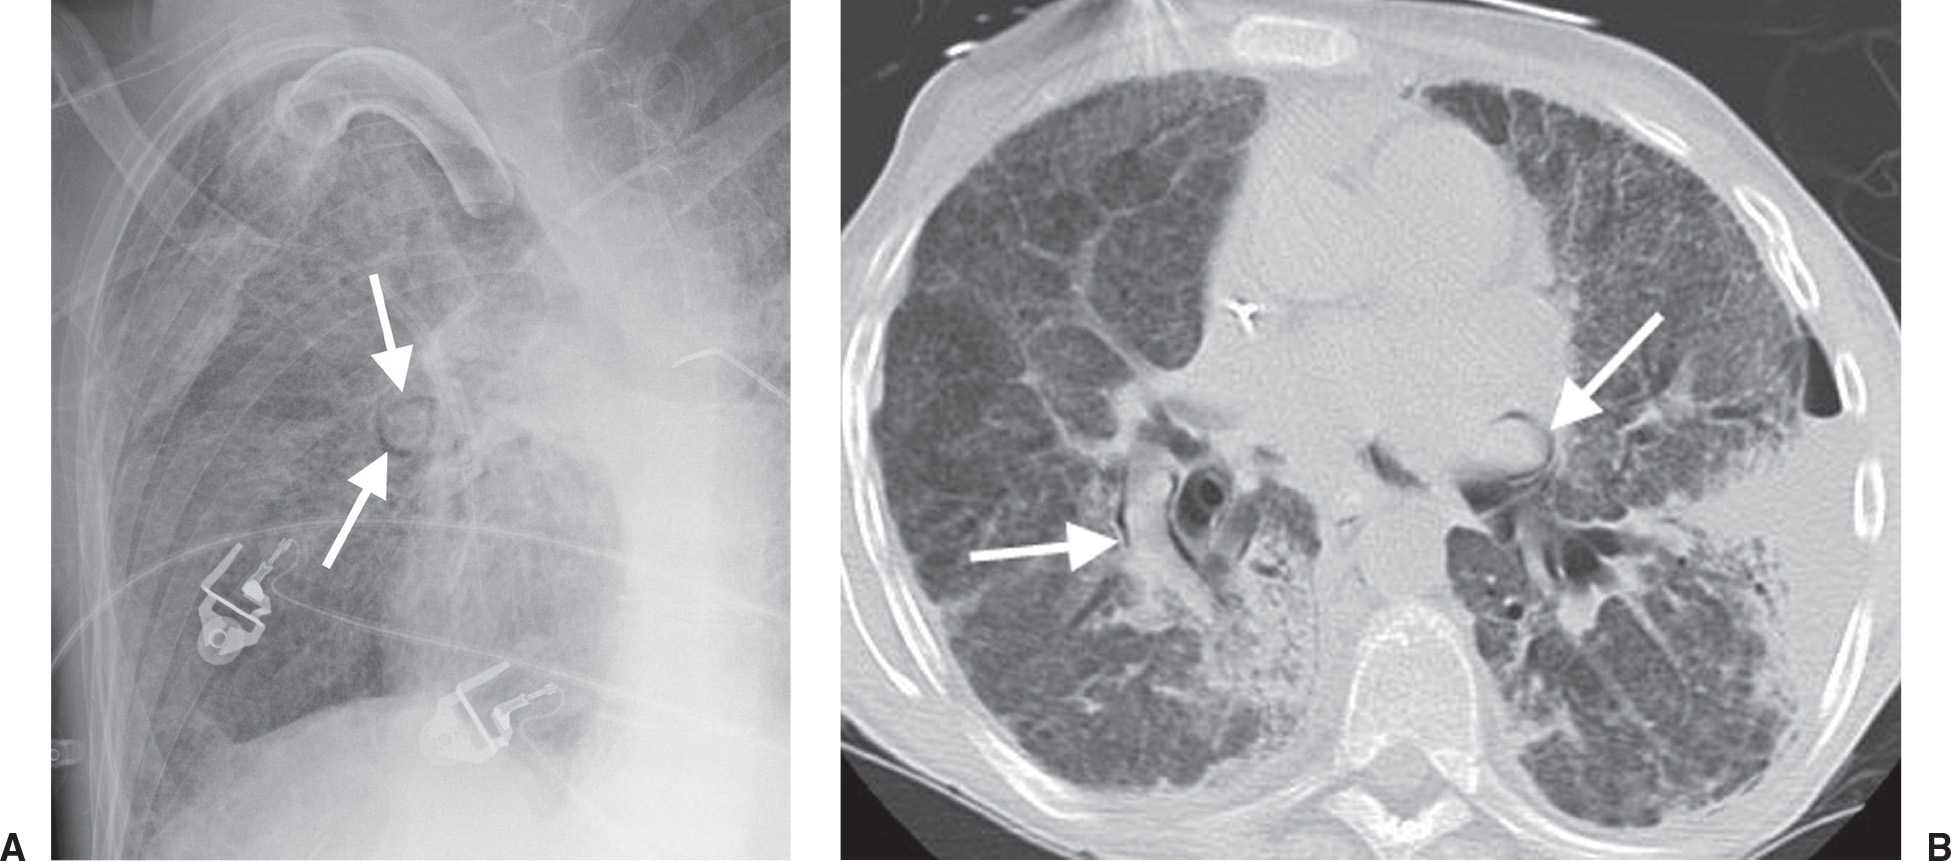
FIG. 2.20 • Ring around the artery sign. A: PA chest radiograph of a patient with acute respiratory distress syndrome shows a ring of lucency around the right pulmonary artery (arrows), signifying pneumomediastinum. B: CT confirms air surrounding both pulmonary arteries (arrows).
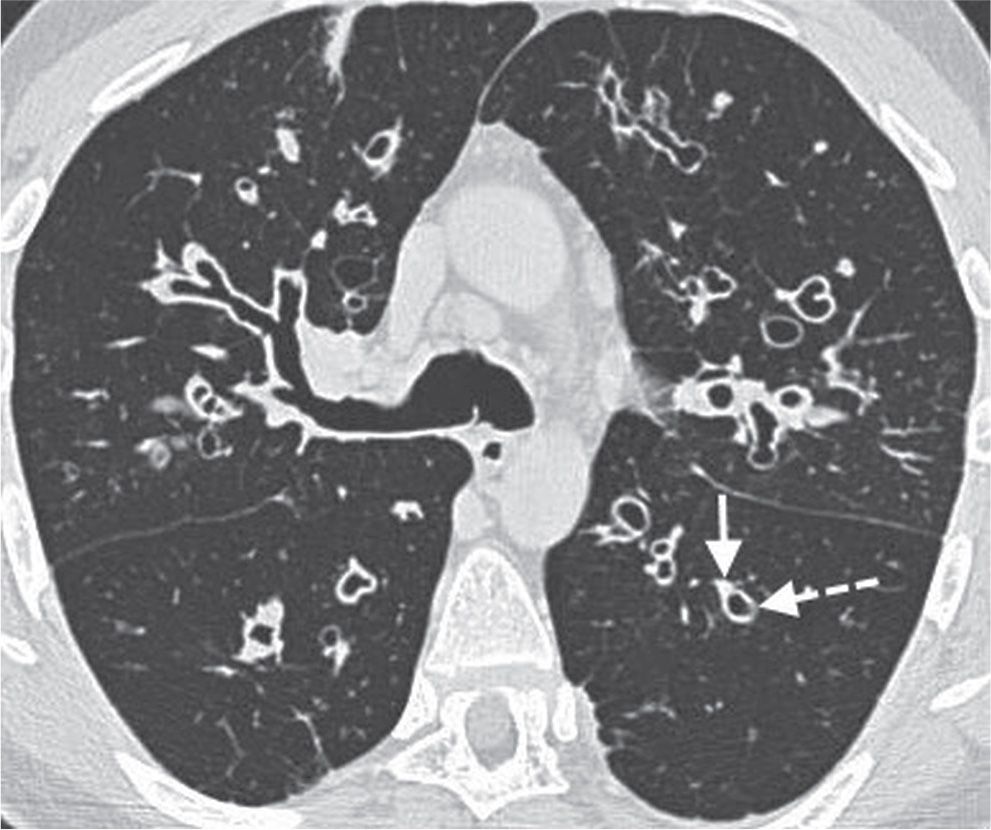
FIG. 2.21 • Signet ring sign. CT scan shows diffuse bronchiectasis in the middle lobe, lingula, and both lower lobes. The normal-sized pulmonary artery (solid arrow) and abutting dilated airway (dashed arrow) resemble a signet ring.
Westermark Sign
This sign refers to oligemia of the lung beyond an occluded vessel in a patient with pulmonary embolism (Fig. 2.27) (24).
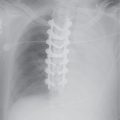
Spine Sign
Lower lobe pneumonia may be poorly visualized on a PA chest radiograph. In such cases, the lateral view is often helpful when it shows the spine sign, which is an interruption in the progressive increase in lucency of the vertebral bodies from superior to inferior (Fig. 2.28) (25).
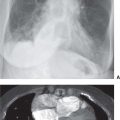
Water Bottle Sign
Large pericardial effusions can produce globular enlargement of the cardiomediastinal silhouette with an increase in its transverse diameter but not in its height. The superior mediastinal borders appear straightened, resulting in a cardiomediastinal silhouette that has the morphology of a water bottle (26).
PATTERNS
The following patterns are not always isolated findings on chest radiographs or CT scans. They commonly occur in combination with other patterns and findings and may or may not represent the predominant imaging feature.
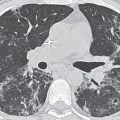
Honeycomb Pattern
Honeycombing is characterized by the presence of cystic airspaces with thick, clearly definable fibrous walls lined by bronchiolar epithelium. It results from the destruction of alveoli and loss of acinar architecture and is associated with pulmonary fibrosis. The cysts are typically layered along the pleural surface, helping to distinguish them from the nonlayered subpleural lucencies seen with paraseptal emphysema.
Honeycombing produces a characteristic appearance on CT that allows a confident diagnosis of lung fibrosis (Figs. 2.29 and 2.30) (27). On CT, the cystic spaces usually average 1 cm in diameter, although they can range from several millimeters to several centimeters in size. They have clearly definable walls that are 1 to 3 mm thick, they are air-filled, and they appear lucent in comparison with normal lung parenchyma. Honeycombing is usually associated with other findings of lung fibrosis, such as architectural distortion, intralobular interstitial thickening, traction bronchiectasis, and irregular linear opacities. Honeycombing on CT usually represents idiopathic pulmonary fibrosis, collagen vascular disease, asbestosis, chronic hypersensitivity pneumonitis, or drug-related fibrosis (Table 2.1).
Septal Thickening
An interlobular septum marginates part of a secondary pulmonary lobule and contains pulmonary veins and lymphatics. These septa measure approximately 0.1 mm in thickness and are occasionally seen on normal thin-section CT scans. Abnormal thickening of interlobular septa is caused by fibrosis, edema, or infiltration by cells or other material. Within the peripheral lung, thickened septa 1 to 2 cm in length may outline part or all of a secondary pulmonary lobule, perpendicular to the pleural surface. They represent the CT counterpart of Kerley B lines seen on chest radiographs.
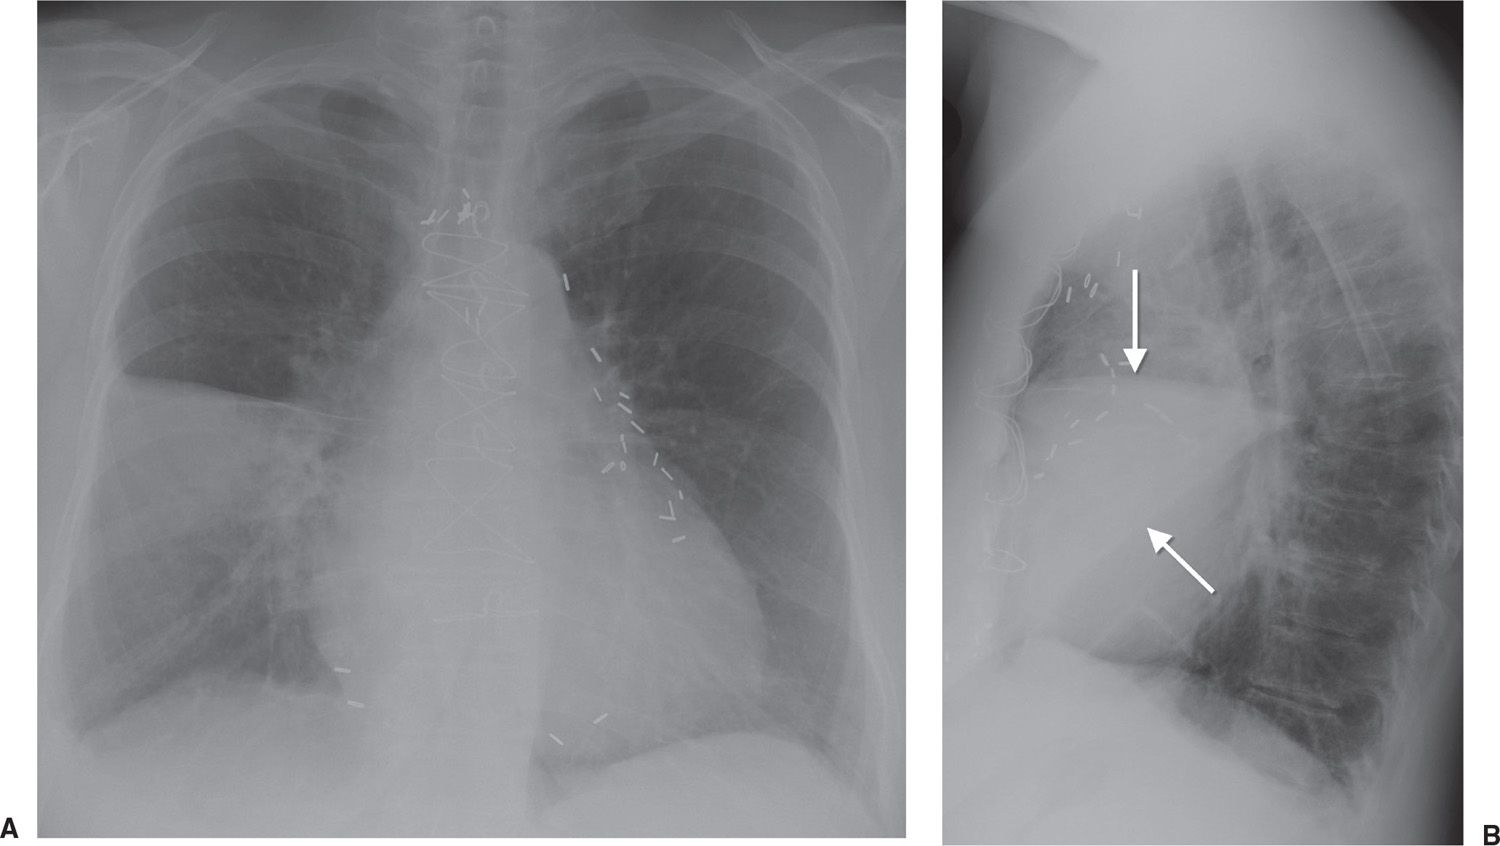
FIG. 2.22 • Silhouette sign. A: PA chest radiograph of a patient with pneumococcal pneumonia shows abnormal opacification of the right lower lung, which partially obscures the right heart border (the silhouette sign), indicating a process involving the right middle lobe. B: Lateral view shows a triangular opacity over the heart (arrows), confirming a right middle lobe process.
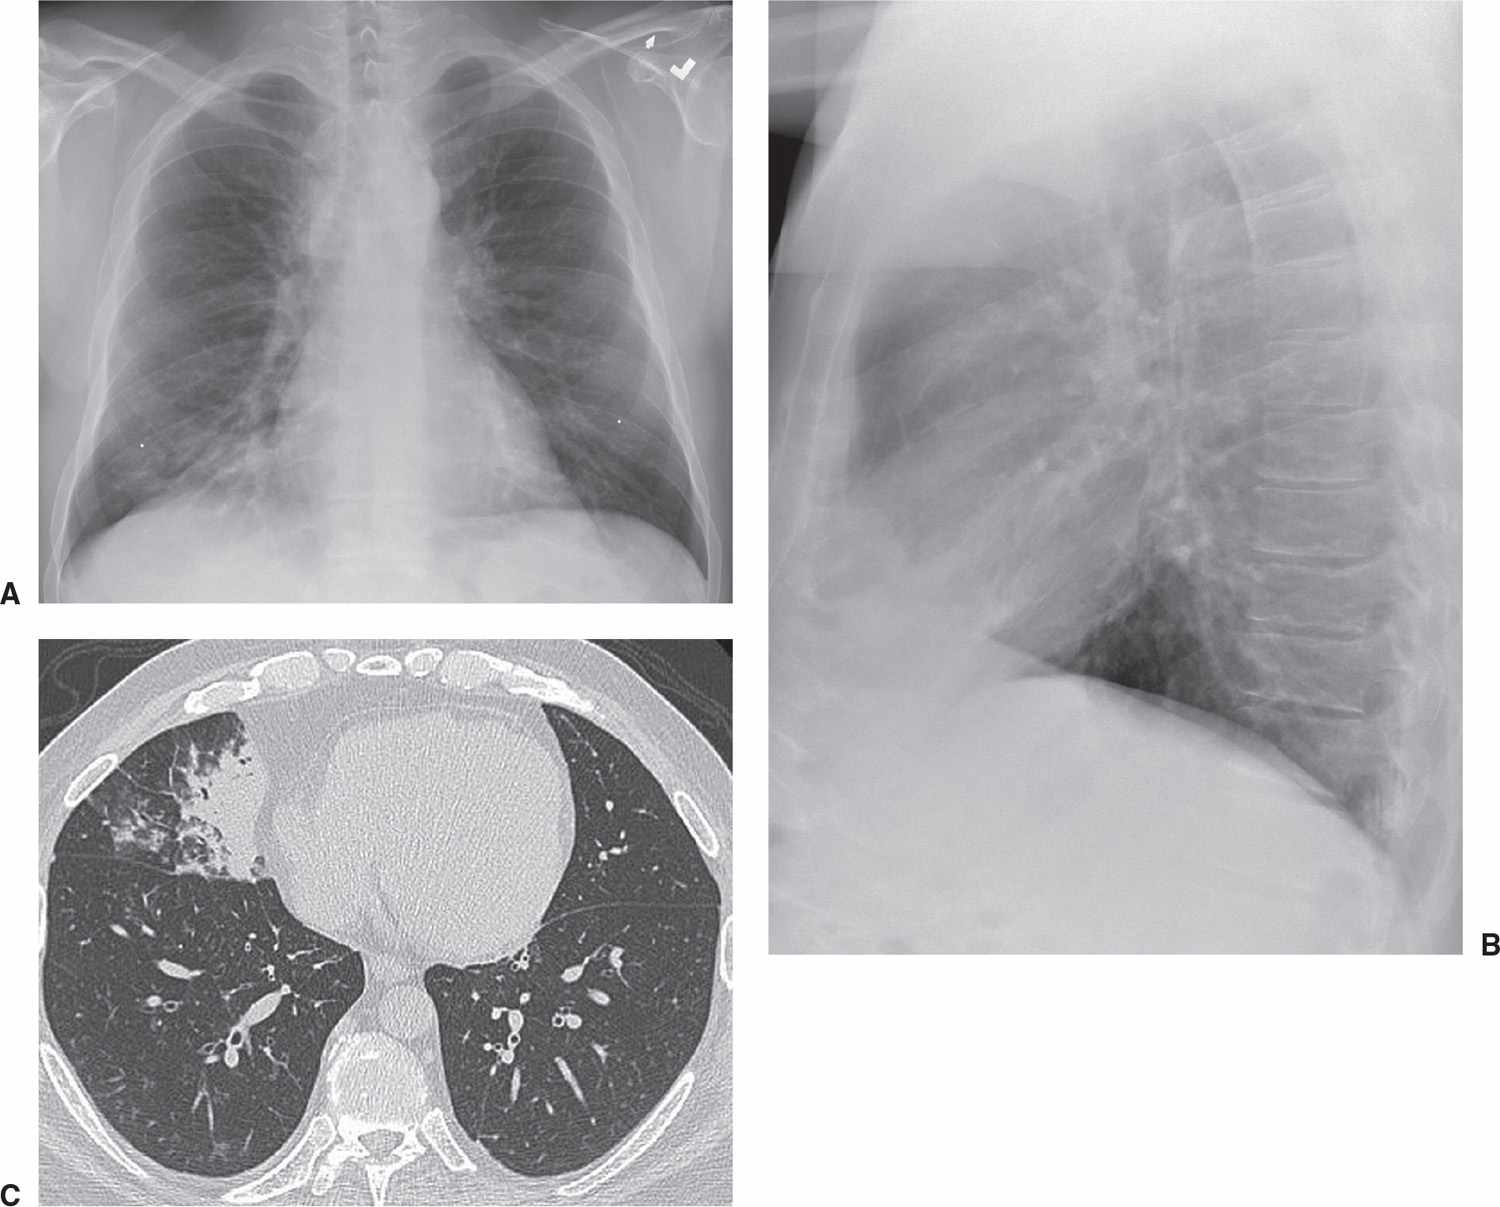
FIG. 2.23 • Silhouette sign. A: PA chest radiograph shows opacity partially obscuring the right heart border. B: Lateral view shows the opacity overlying the heart. C: CT scan confirms the opacity to be within the right middle lobe, abutting the fat surrounding the lower right heart.
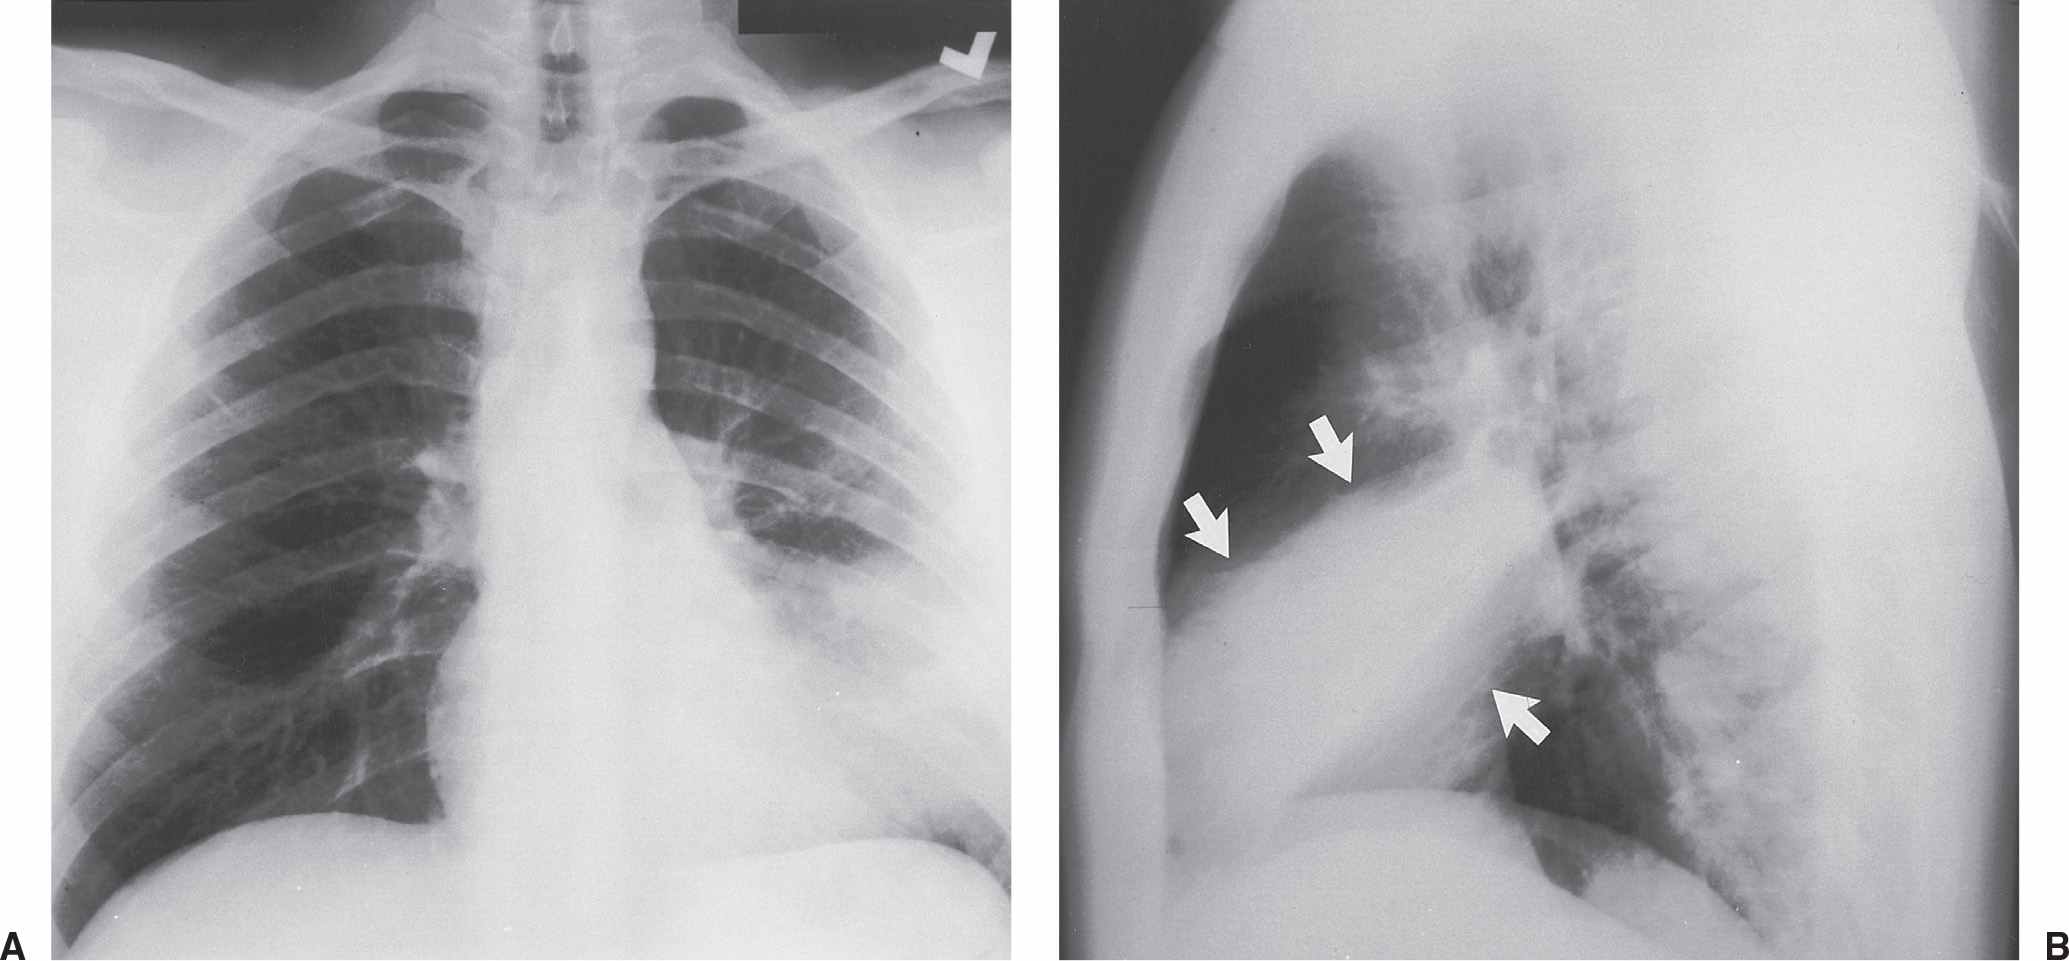
FIG. 2.24 • Silhouette sign. A: PA chest radiograph of a patient with pneumonia shows opacification of the left lower lung partially obscuring the left heart border (silhouette sign), indicating a lingular process. Note that the left hemidiaphragm is not obscured, as would be seen with a process involving any of the basilar segments of the lower lobe. B: Lateral view shows an opacity over the heart (arrows), confirming the lingular location of the pneumonia.
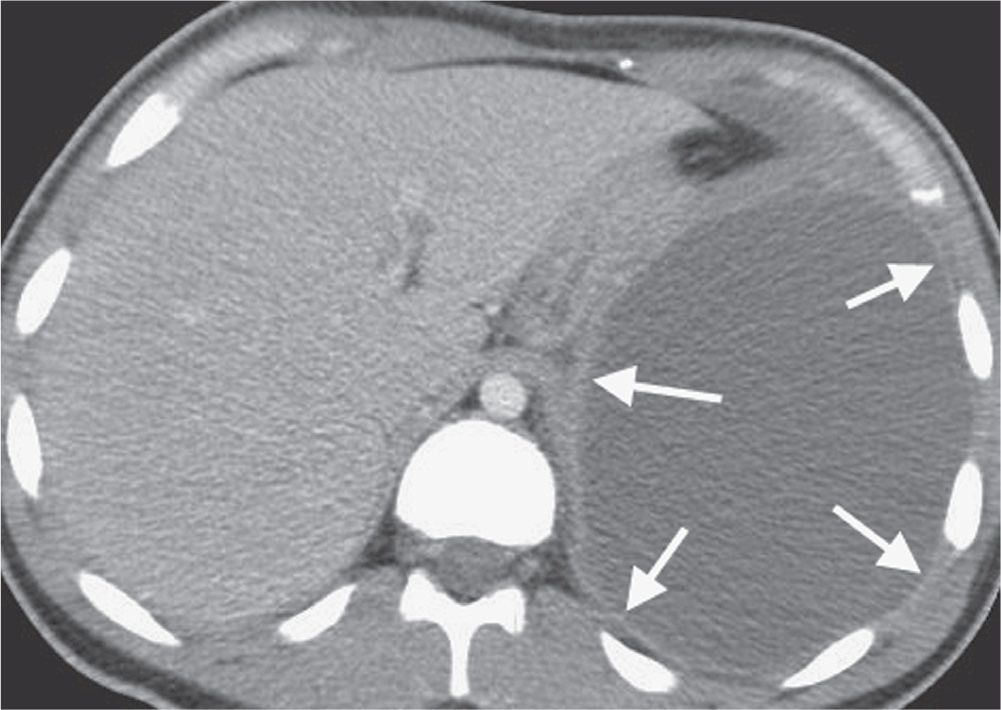
FIG. 2.25 • Split pleura sign. CT with intravenous contrast shows intrapleural fluid (empyema) with associated thickening, contrast enhancement, and separation of the visceral and parietal pleura (arrows).
Interlobular septal thickening can be smooth (Figs. 2.31 and 2.32) or nodular (28) (see Table 2.1). Smooth thickening is seen in patients with pulmonary edema or hemorrhage, lymphangitic spread of carcinoma, lymphoma, leukemia, interstitial infiltration associated with amyloidosis, and some pneumonias. Nodular or “beaded” thickening occurs in lymphangitic spread of carcinoma (Fig. 2.33) or lymphoma, sarcoidosis, silicosis or coal worker’s pneumoconiosis, lymphoid interstitial pneumonia, and amyloidosis.
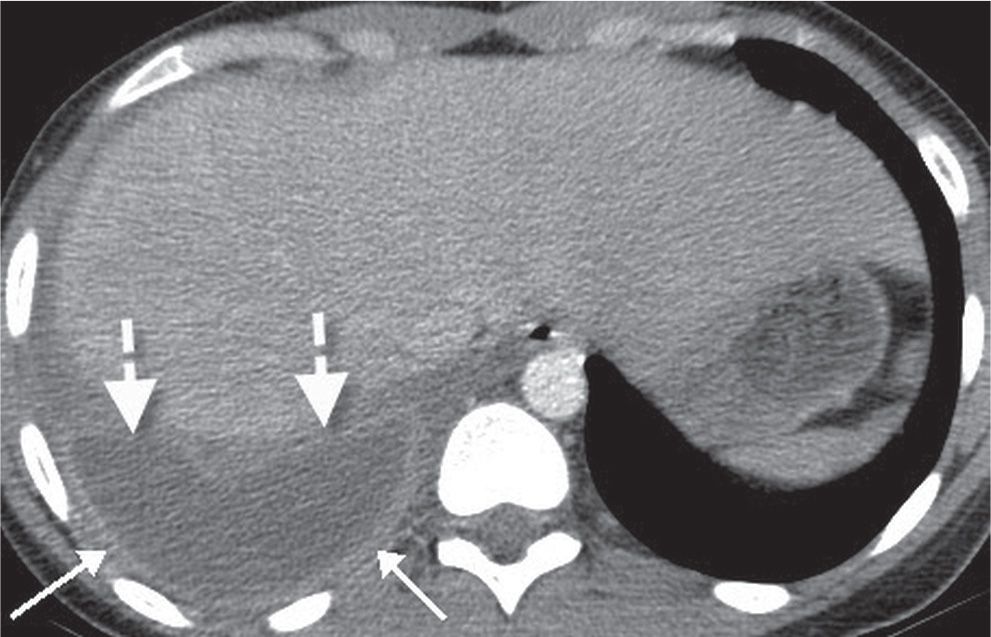
FIG. 2.26 • Split pleura sign. CT with intravenous contrast shows an empyema with associated thickening, contrast enhancement, and separation of the visceral (dashed arrows) and parietal (solid arrows) pleura.
Cystic Pattern
The term “cyst” is nonspecific and refers to a thin-walled (usually less than 3 mm thick), well-defined, well-circumscribed, air- or fluid-containing lesion, 1 cm or more in diameter, that has an epithelial or fibrous wall. A cystic pattern results from a heterogeneous group of diseases that have in common the presence of focal, multifocal, or diffuse parenchymal lucencies and lung destruction (see Table 2.1). Pulmonary Langerhans cell histiocytosis, lymphangioleiomyomatosis, sarcoidosis, lymphoid interstitial pneumonia (Fig. 2.34), collagen vascular diseases, Pneumocystis pneumonia (Fig. 2.35), and honeycombing can manifest a cystic pattern on CT. Although they do not represent true cystic disease, centrilobular emphysema and cystic bronchiectasis mimic cystic disease on chest CT scans.
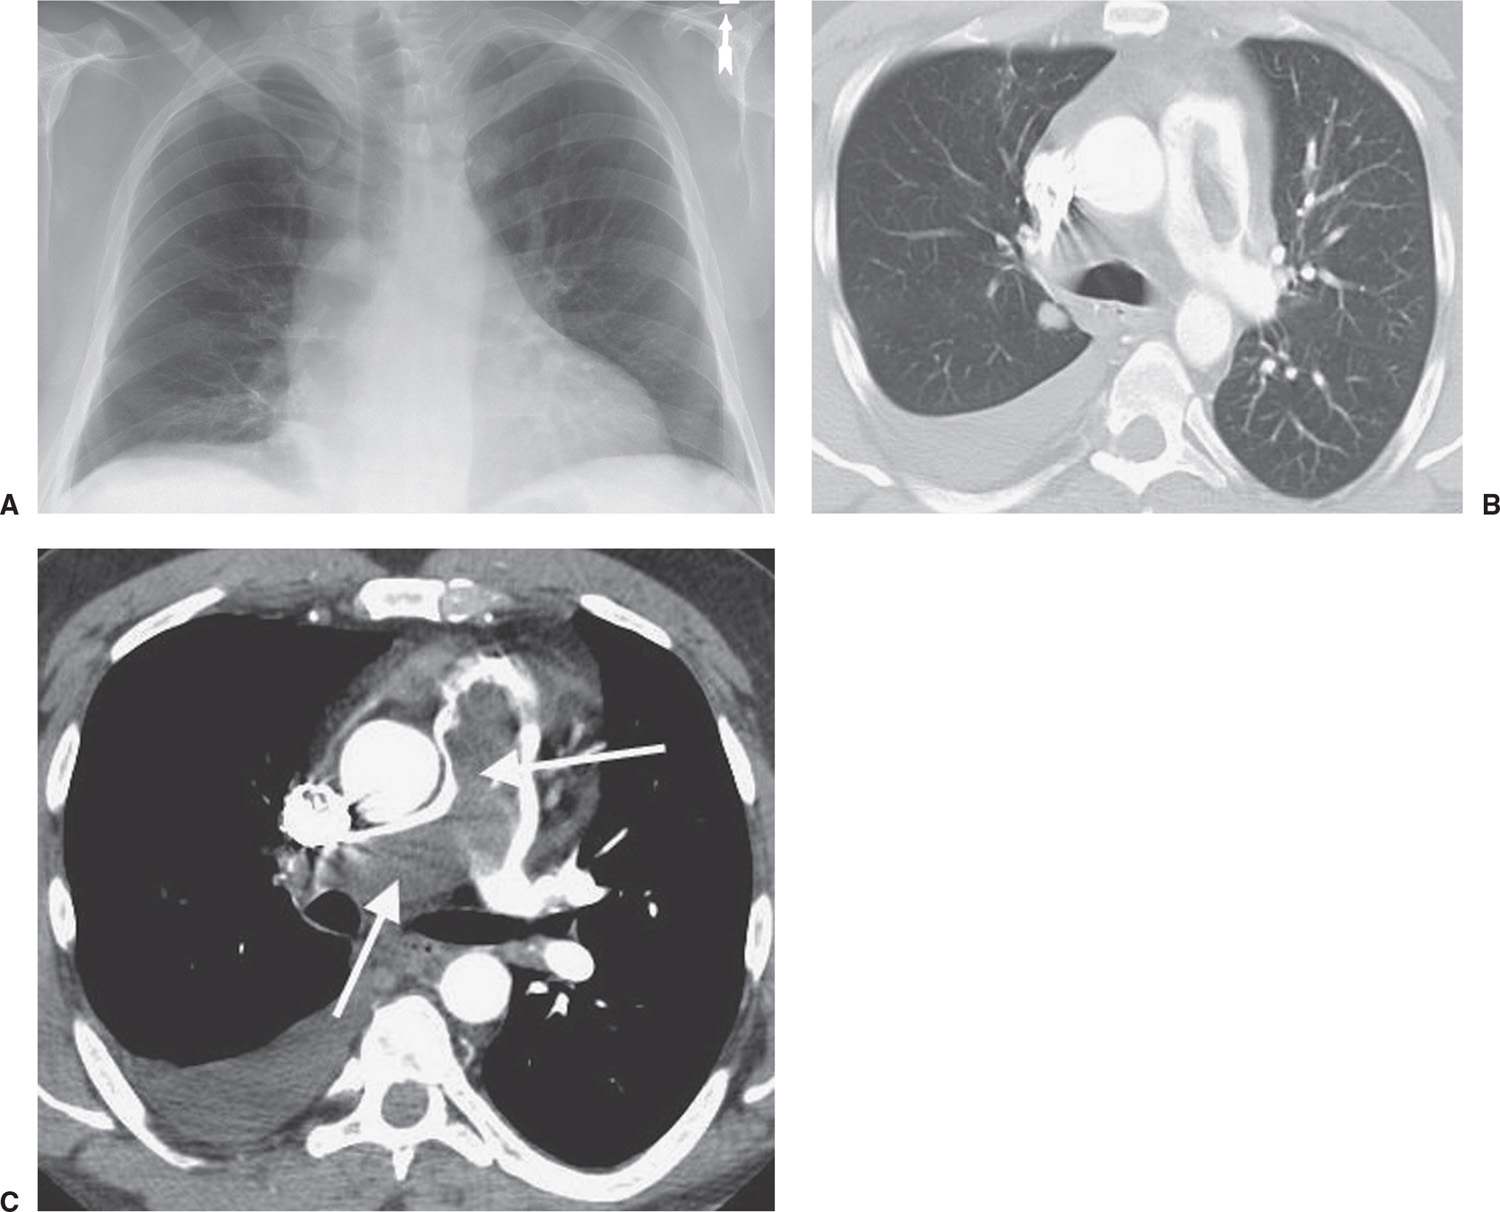
FIG. 2.27 • Westermark sign. A: PA chest radiograph shows oligemia of the right lung, the so-called Westermark sign. Note how the vessels on the right are diminutive compared with those on the left. As a result, the right hemithorax appears hyperlucent. B: CT with lung windowing better shows the diminution of vessels on the right compared with the left. There is also a right pleural effusion. C: CT with mediastinal windowing shows thrombus expanding and filling the main and right pulmonary arteries (arrows).
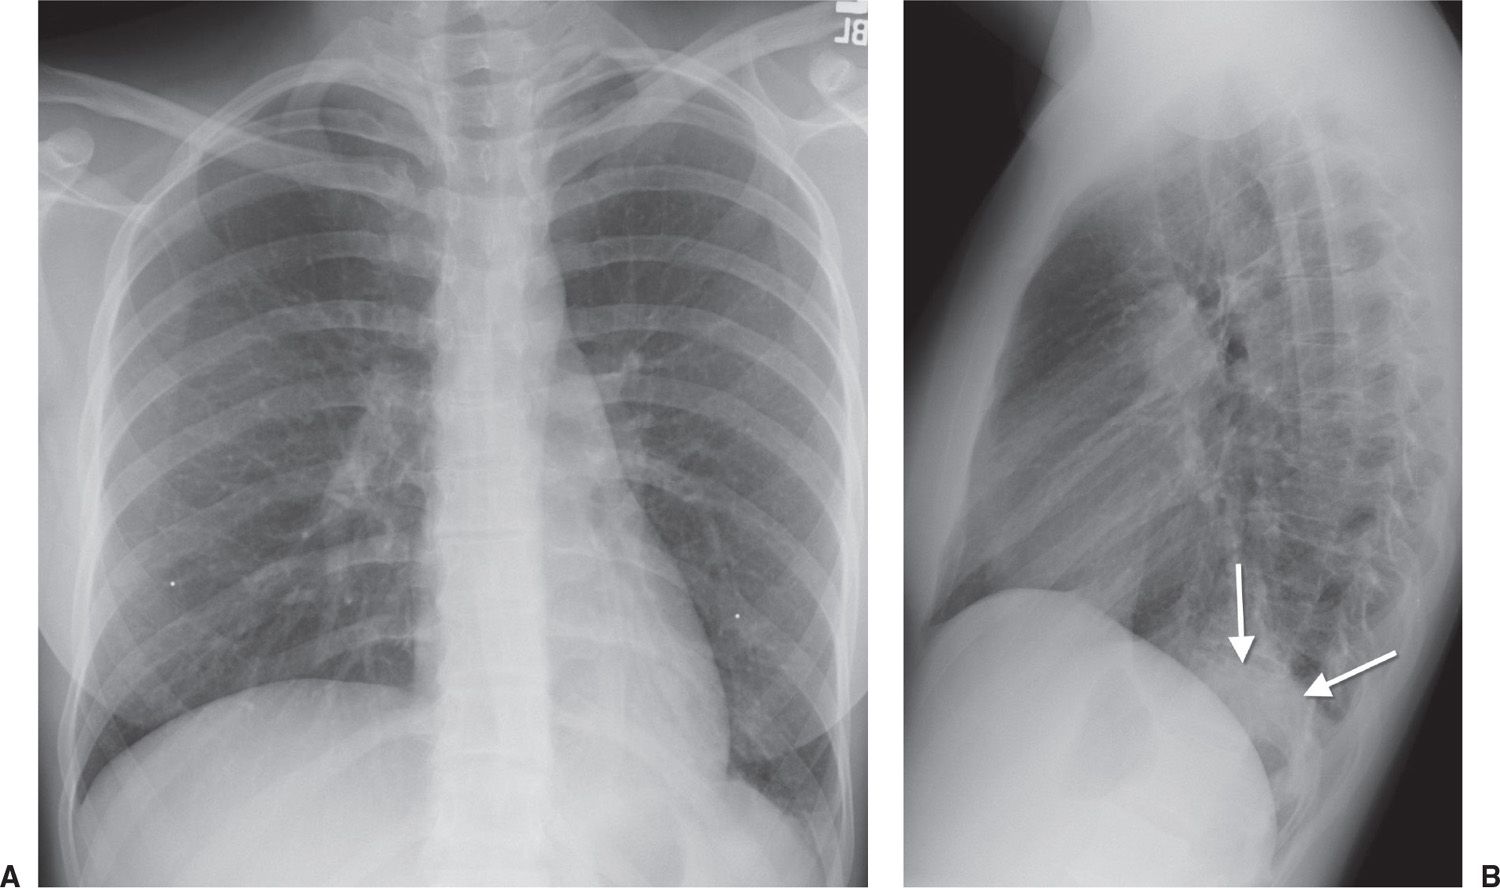
FIG. 2.28 • Spine sign. A: PA chest radiograph of a patient with left lower lobe pneumonia shows abnormal opacity obscuring the left hemidiaphragm (silhouette sign). B: Lateral view shows this opacity projected over the lower spine (arrows). Normally, the spine becomes progressively more lucent from the top to the bottom on the lateral view.
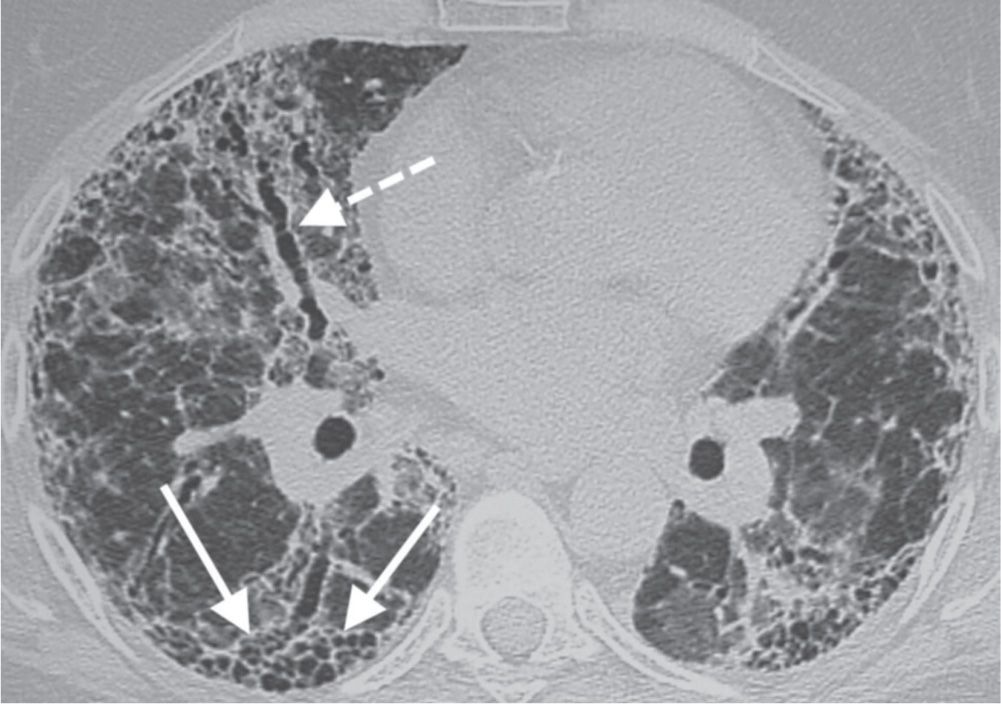
FIG. 2.29 • Honeycomb pattern. CT shows layers of subpleural cysts (solid arrows) representing the honeycomb pattern of pulmonary fibrosis. Also shown is traction bronchiectasis (dashed arrow), another sign of pulmonary fibrosis.
Table 2.1 DIFFERENTIAL DIAGNOSIS OF PATTERNS OF DISEASE ON CT OF THE LUNGS
Related posts:
Stay updated, free articles. Join our Telegram channel

Full access? Get Clinical Tree


