Size and Function of the Right Ventricle


  • Cardiac magnetic resonance (CMR) allows imaging of the entire RV without interference of ribs or lungs.


  • Because of high image quality and wide field-of-view, CMR imaging is the method of choice to assess the complex geometry and function of the RV.


  • RV hypertrophy that results from increased loading conditions is accurately determined by CMR.


  • CMR may support the diagnosis of ARVC/D by detecting RV dilatation and focal functional abnormalities of the RV wall.


  • CMR techniques may help to characterize abnormal tissue composition of hypertrophic RV myocardium.


KEY POINTS


Case 1


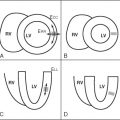
This first section shows images of a healthy patient to demonstrate normal right ventricular anatomy ( Figure 5-1 ).


Figure 5-1


For legend, see opposite page. A, Transverse planes obtained with a bright-blood technique (steady-state free precession pulse sequence, SSFP). Panel A shows the right atrium (RA), right ventricle (RV), left atrium (LA), left ventricle (LV), and the descending aorta (Ao). The tricuspid valve (TV) has an insertion point displaced toward the apex compared with the mitral valve. Similar view for Panel B, with slight caudal displacement. The coronary sinus (CS) and the incoming vena cava inferior (VCI) are clearly visible. The following characteristics differentiate the RV from the LV: more pronounced trabeculae, the presence of a moderator band (*), and the more apical insertion of the tricuspid valve. B, Sagittal views of the right heart. Panel A, bi-caval view of the right atrium (RA) with inflow of both vena cava superior (VCS) and vena cava inferior (VCI). *: valve of inferior vena cava (Eustachii). **: crista terminalis. Panel B shows the right ventricle (RV), the right ventricular outflow tract (OT), and the pulmonary trunk (PA). The very thin structure of the pulmonary valve is barely seen at the transition of OT and PA. LV, left ventricle. C, Coronal views of the heart from posterior (A) to anterior (C). Panel A shows the vena cava superior (VCS) entering the right atrium (RA). On panel B, the inflow tract (IF) of the RV is depicted. The more anterior view (panel C) visualizes both the inflow and outflow tract of the RV. Compared with the LV, inflow and outflow tract of the RV are at a much wider angle. As a result, the tricuspid and pulmonary valve s do not share a common anatomical plane. CA, conus arteriosus; *, supraventricular crest. D, View of the RVOT at end-diastole, planned on the four-chamber view (see cutline). This view allows the depiction of both the inflow and outflow tract of the right ventricle. *, supraventricular crest; CA, conus arteriosus; TV, tricuspid valve; VCS, vena cava superior; Ao, Aorta; RA, right atrium; IF, inflow of the RV.


Anatomy of the Right Ventricle


Comments


The geometry of the right ventricle (RV) is more complex than of the left ventricle (LV). The LV can be compared with an elliptic cone with two valves (mitral and aortic valves) sharing the same anatomic plane. The RV cavity is wrapped around the left ventricle and can be divided into a posteroinferior inflow portion, containing the tricuspid valve, and an anterosuperior outflow portion, from which the pulmonary trunk originates. Because of this complex geometry, CMR has become the imaging technique of choice to precisely evaluate patients with congenital or acquired disease of the right ventricle.


Case 2


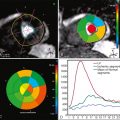
This is a demonstration of Simpson or disk-area method for calculation of right ventricular end-systolic and end-diastolic volumes, and ejection fraction ( Figure 5-2 ).


Figure 5-2


A , Nine end-diastolic and nine end-systolic short-axis images of the heart obtained with a bright-blood cine technique (SSFP), and planned perpendicular to the LV long axis of a four-chamber view (see panel B). Tracings of the endocardial contours are shown, used to calculate the RV volumes. The first and second basal end-systolic slices are not included in the calculation since these slices contain the right atrium and not the right ventricle, because of systolic long axis shortening and the anterior displacement of the tricuspid valve compared with the mitral valve. B, Four-chamber view at end-diastole (left) end-systole (right) with cutlines of short axis images from Figure 5-2, A . At end-diastole, the most basal short axis slice cuts through the mitral valve annulus and the right atrium. At end-systole, the first basal slice cuts through left and right atrium, whereas the second slice cuts through the mitral annulus and the right atrium. These differences, because of long axis shortening of the heart, must be accounted for when tracing the RV contours.


Assessment of Right Ventricular Volumes and Function


Comments


Today, CMR is considered the gold standard for assessment of right ventricular volumes, mass, and function, for clinical as well as research purposes. It has been shown to have a good interstudy reproducibility of functional RV parameters in healthy subjects, and in patients with heart failure or hypertrophy. However, the reproducibility of the RV measurements is lower than for the LV.


Case 3


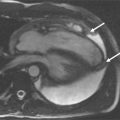
A 77-year-old man presented for exertional dyspnea and atrial fibrillation for 5 months. A transthoracic echocardiogram showed a hypertrophic left ventricle with poor systolic and diastolic function. CMR was performed to retrieve the cause of the hypertrophy ( Figure 5-3 ).


Figure 5-3


A , Four-chamber view using a bright-blood technique showing biventricular concentric hypertrophy and left atrial dilation. B , The same view after intravenous administration of a gadolinium-based contrast agent using the technique of delayed enhancement imaging. There is uptake of the contrast agent in predominantly subendocardial regions with amyloid deposition, causing a typical pattern of diffuse hyperenhancement. Both the left and the right ventricle are affected. Characteristically, the hyperenhancement is best seen after 3 to 5 minutes after contrast administration and “nulling” of normal myocardium is difficult to achieve. C , A short axis view using the same contrast enhancement technique shows significant involvement of the right ventricular myocardium in the disease process, leading to hypertrophy.


Right Ventricular Hypertrophy Resulting from Cardiac Amyloidosis


Comments


Amyloidosis results from the deposition in tissues of fibrils formed from various proteins. Involvement of the heart is frequent, leads to restrictive cardiomyopathy, and progressive heart failure, and may finally lead to death. CMR imaging has been shown to correlate well with histologic findings, with areas of late contrast enhancement demonstrating the amyloid infiltration. When compared with endomyocardial biopsy, contrast-enhanced CMR has a sensitivity of 80% and a specificity of 94% for diagnosing cardiac amyloidosis. The distribution pattern of enhanced areas is highly variable and the extent of hyperenhancement correlates with ventricular dysfunction.


Case 4


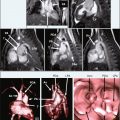
Follow-up examination 5 years after the initial diagnosis of idiopathic pulmonary hypertension ( Figure 5-4 ).


Figure 5-4


A , Bright-blood four-chamber view demonstrating pronounced hypertrophy and dilation of the right ventricle. The right to left end-diastolic diameter ratio is greater than 1, with compression of the left ventricular cavity. There is a marked dilation of the right atrium with bowing of the interatrial septum toward the left atrium because of right atrial pressure overload. Tricuspid regurgitation is apparent as a signal void into the right atrium, originating from the coaptation point of the tricuspid valve leaflets. Pericardial effusion surrounds the right atrium, right ventricle, and part of the left ventricle (*) s. B , End-diastolic (A) and end-systolic (B) short axis views demonstrating the flattening and bulging of the interventricular septum toward the left ventricle ( arrow ). The diastolic and systolic occurrence of septal bowing in this patient indicates both volume and pressure overload of the right ventricle. Volume overload may occur because of a left to right shunt or significant tricuspid or pulmonary regurgitation. C, Basal short-axis view (A) and sagittal view (B) showing the right ventricular outflow tract of another patient with pulmonary hypertension. There is a marked dilation of the right ventricle and of the pulmonary artery (PA, 60 mm diameter) leading to pulmonary valve regurgitation. The regurgitant jet is seen as a signal void originating from the coaptation point of the pulmonary valve leaflets (arrow).


Right Ventricular Hypertrophy Resulting from Pressure Overload


Comments


Severe pulmonary hypertension caused by diseases of the lung parenchyma and/or pulmonary vasculature can lead to cor pulmonale. Right ventricular hypertrophy develops to maintain a sufficient output against high pulmonary vascular impedance. Further elevation of the pulmonary pressure leads to dilation and systolic dysfunction of the right ventricle. CMR allows the exact determination of right ventricular mass, volume, and function in patients in whom echocardiographic diagnosis may be difficult because of poor image quality in the setting of chronic obstructive pulmonary disease. Moreover, the RV shape and position in the chest can make the calculation of RV volumes and ejection fraction by echocardiography unreliable.


Feb 1, 2019 | Posted by in MAGNETIC RESONANCE IMAGING | Comments Off on Size and Function of the Right Ventricle

Full access? Get Clinical Tree

Get Clinical Tree app for offline access