Anatomy, embryology, pathophysiology
- ◼
Adenocarcinoma: inactivation of multiple antioncogenes, as well as issues with deoxyribonucleic acid mismatch repair ( BRCA2 ). Smoking, diet high in meat and solvent exposure are risk factors.
- ◼
Neuroendocrine tumors: multiple chromosomal losses. Associated with Von-Hippel Lindau syndrome and multiple endocrine neoplasia.
- ◼
Pancreatic lymphoma: usually non-Hodgkin lymphoma.
- ◼
Acinar cell carcinoma: mutations in adenomatous polyposis coli beta-catenin gene and loss of chromosome 11.
Techniques
Computed tomography
- ◼
Detects and characterizes the lesion based on the enhancement pattern on dynamic imaging.
- ◼
Pancreatic adenocarcinomas are hypodense on pancreatic phase whereas neuroendocrine tumors are hyperdense.
- ◼
Venous phase imaging allows for evaluation of vascular invasion and metastases, including regional lymph nodes, hepatic and omental metastases.
- ◼
Used as primary imaging tool for staging of pancreatic cancer at most institutions.
Magnetic resonance imaging
- ◼
Problem solving tool.
- ◼
Good for detection of small tumors and metastases.
- ◼
Used as primary imaging tool for local staging at some institutions.
- ◼
Magnetic resonance (MR) angiography can be used to assess vascular involvement.
- ◼
MR cholangiopancreatography (MRCP) can be used to visualize the effect of the tumor on the biliary tree.
- ◼
Secretin enhanced MRCP can improve assessment of ductal stenosis and help differentiate benign from malignant strictures.
Ultrasonography
- ◼
Operator dependent with limitations based on bowel gas and patient body habitus.
- ◼
Endoscopic ultrasound usually performed by gastroenterologists. Provides high resolution images of pancreas and allows biopsy (fine needle aspiration) of lesions.
Nuclear medicine
- ◼
Positron emission tomography (PET)/computed tomography (CT).
- ◼
Normal pancreas should not have significant fluorodeoxyglucose (FDG) uptake.
- ◼
Focal uptake is abnormal and could represent a primary malignancy.
- ◼
Specific disease processes
Pancreatic adenocarcinoma
- ◼
90% of malignant pancreatic tumors.
- ◼
Fifth leading cause of death in Western countries.
- ◼
Five-year survival of 4%.
- ◼
Males more than females between seventh and eighth decade.
- ◼
Presentation: painless jaundice (75% of patients), new onset diabetes (10%), vague abdominal pain, weight loss.
- ◼
Tumors at head are more common (two-thirds) ( Figs. 13.1–13.3 ) and have better prognosis. Smaller at presentation with average size of 3 cm.

Fig. 13.1
Locally invasive pancreatic adenocarcinoma arising from the uncinate process on axial (A) and coronal (B) multidetector computed tomography images, manifesting as a hypodense mass ( thin arrow ), which circumscribes the superior mesenteric artery ( thick arrow ) for more than 180 degrees and invades the duodenum ( curved arrow , B), rendering the tumor inoperable.
(From Sahani DV, Samir AE. Abdominal Imaging, ed 2. Philadelphia: Elsevier; 2017.)

Fig. 13.2
Adenocarcinoma of the pancreas shown on coronal (A) and curved reconstructed (B) multidetector computed tomography images. Note a poorly enhancing mass ( thin arrow ) that obstructs the main pancreatic duct ( thick arrow ) and infiltrates the duodenum ( curved arrow ).
(From Sahani DV, Samir AE. Abdominal Imaging , ed 2. Philadelphia: Elsevier; 2017.)

Fig. 13.3
Pancreatic adenocarcinoma. (A) The in-phase (T1-weighted) image in a patient with pancreatic adenocarcinoma in the pancreatic head ( arrow ) shows relative hypointensity compared with normal parenchyma ( arrowhead ). (B) The T2-weighted image exemplifies the usual hypointensity ( arrow ) with little contrast between normal tissue and neoplasm. (C) The enhanced image bears the highest tissue contrast between the lesion ( arrow ) and normal pancreatic tissue ( arrowhead ).
(From Roth C, Deshmukh S. Fundamentals of Body MRI, ed 2. Philadelphia: Elsevier; 2016.)
- ◼
Tumors in body (5%–15%) or tail (10%–15%) may present with back pain. Worse prognosis. Larger at prognosis with average size of 5 cm ( Fig. 13.4 ).

Fig. 13.4
Pancreatic adenocarcinoma—arterial phase imaging. Infiltrative mass enlarges the body of the pancreas ( arrows ), which can be seen in the in-phase T1-weighted (A) and the precontrast fat-suppressed T1-weighted gradient recalled-echo (D) images in contrast to the normal pancreatic parenchyma in the head of the pancreas. This mass demonstrates mildly increased signal intensity in T2-weighted (B) images, which is pronounced in fat-suppressed T2-weighted (C) images. In addition, distal gland atrophy and duct dilatation ( arrowheads ) can be seen in the T2-weighted (B) and fat-suppressed T2-weighted (C) images. Furthermore, this mass demonstrates decreased enhancement, compared with the normal pancreas, and is most pronounced in early arterial phase fat-suppressed T1-weighted gradient recalled-echo (E) imaging, with gradual enhancement in delayed phase, fat-suppressed T1-weighted gradient recalled-echo imaging (F) related to desmoplastic content.
(From Roth C, Deshmukh S. Fundamentals of Body MRI , ed 2. Philadelphia: Elsevier; 2016.)
- ◼
May be focal masses or may be infiltrative.
- ◼
Cystic changes may happen because of necrosis or ductal obstruction.
- ◼
Incites extensive desmoplastic reaction leading to main pancreatic ductal (MPD) obstruction ( Fig. 13.5 ), pancreatitis, and/or parenchymal atrophy.

Fig. 13.5
Pancreatic adenocarcinoma in two different patients on multidetector computed tomography pancreatogram (A) and three dimensional magnetic resonance cholangiopancreatography (MRCP) (B) as a small and barely visible lesion ( thin arrow ) causing abrupt narrowing of the main pancreatic duct and upstream dilatation ( thick arrow ). The main pancreatic duct dilatation is better evaluated on MRCP images.
(From Sahani DV, Samir AE. Abdominal Imaging , ed 2. Philadelphia: Elsevier; 2017.)
- ◼
Mode of spread: local ( Fig. 13.6 ), retroperitoneum, peritoneal lymph nodes ( Fig. 13.7 ), and liver.

Fig. 13.6
Axial (A) and coronal maximum intensity projection (B) multidetector computed tomography images show an advanced adenocarcinoma ( thin arrow ) infiltrating the superior mesenteric artery ( SMA, thick arrow ) that appears as the “tear drop” sign. Lymph node metastases are present ( curved arrow ).
(From Sahani DV, Samir AE. Abdominal Imaging , ed 2. Philadelphia: Elsevier; 2017.)

Fig. 13.7
Advanced pancreatic adenocarcinoma seen on T2-weighted (A) and pancreatic phase (B), portovenous phase (C), and late phase (D) contrast-enhanced T1-weighted magnetic resonance images as a heterogeneously hyperintense infiltrating lesion ( thin arrow ) on T2-weighted imaging and showing poor, heterogeneous, progressive contrast enhancement over time. Peritoneal metastases coexist ( long thin arrow , D), and necrotic lymph node metastases ( curved arrow , D) are also noted.
(From Sahani DV, Samir AE. Abdominal Imaging , ed 2. Philadelphia: Elsevier; 2017.)
- ◼
Mass conspicuity higher in pancreatic phase. Appears as low density mass compared with surrounding parenchyma but may be isoattenuating in 10% of cases.
- ◼
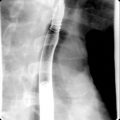
Indirect evidence: ductal dilation ( Fig. 13.8 ), parenchymal atrophy, double duct sign (common bile duct and MPD dilation) ( Fig. 13.9 ).

Fig. 13.8
Multidetector computed tomography–pancreatogram image showing abrupt obstruction of the main pancreatic duct with upstream dilatation ( thick arrow ) secondary to a small tumor ( thin arrow ).
(From Sahani DV, Samir AE. Abdominal Imaging , ed 2. Philadelphia: Elsevier; 2017.)

Fig. 13.9
Infiltrating pancreatic adenocarcinoma ( thin arrow ) causing obstruction and upstream dilatation of both the main pancreatic duct and the common bile duct ( thick arrows ) and showing the “double duct” sign on coronal multidetector computed tomography (A), coronal steady state fast spin echo T2-weighted (B) magnetic resonance image, and three-dimensional magnetic resonance cholangiopancreatography (C).
(From Sahani DV, Samir AE. Abdominal Imaging , ed 2. Philadelphia: Elsevier; 2017.)
- ◼
Portal venous phase important for evaluation of metastases, visualization of tumor in respect to vasculature.
- ◼
Vessel encasement evaluation on CT is important prognostic factor in resection.
Less than 90 degrees, less than 3% infiltration; 90 to 180 degrees, 29% to 57% infiltration; more than 180 degrees, more than 80% infiltration.
- ◼
T1 hypointense, variable T2 signal (usually hypointense), enhances less than parenchyma but demonstrates progressive enhancement.
- ◼
MRCP can demonstrate ductal abnormalities, including stenosis, double duct sign, etc. Secretin MRCP better at characterization than MRCP.
- ◼
On ultrasound, pancreatic mass appears hypoechoic.
- ◼
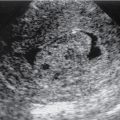
Endoscopic ultrasound is most accurate for detection of duodenal infiltration and lymph node staging ( Fig. 13.10 ).
- ◼