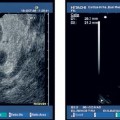
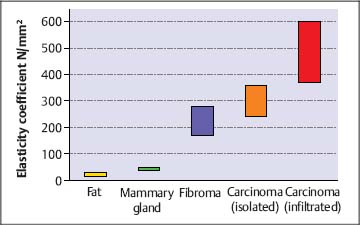
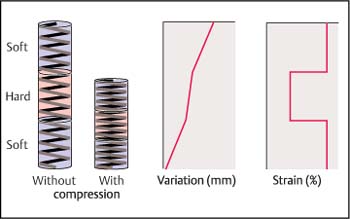
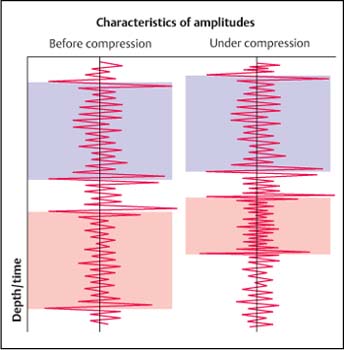
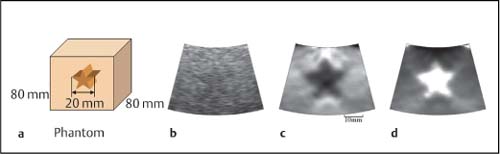
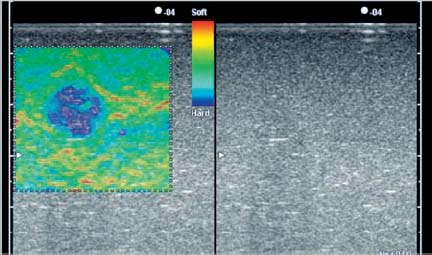
8 Sonoelastography: a New Ultrasound Modality for Assessing Tissue Elasticity It is well known that inflammatory conditions and tumors lead to an alteration of the normal tissue structure, causing hardening of the tissue and a change in its elasticity. The elasticity modulus is a measure of the stress that is applied to tissue structures relative to the strain or deformation produced. Figure 8.1 shows a graph of the elasticity coefficient for different breast tissues.1 Assessing and visualizing tissue elasticity provides the clinician with potentially important information that can be used in the diagnosis of tumors and inflammatory conditions. Various ultrasound techniques have been developed and experimentally evaluated in recent years for visualizing the elastic properties of tissue. Figure 8.2 demonstrates the different effects of compression on hard and soft tissue. Soft tissues are compressed more than hard tissue structures under the same pressure. This deformation can be detected from the ultrasound data and can be displayed. The sonoelastography modality described here uses standard ultrasound probes, and there is no requirement for additional equipment such as pressure or vibration measurement systems. The procedure is similar to that in conventional color Doppler examination. Measurements of tissue elasticity are acquired in real time and presented as a color overlay on the conventional B-mode image. Fig. 8.1 Coefficients of elasticity in various tissues in the breast (adapted from1). Conventional ultrasound images (B-mode images) are constructed from ultrasound signals that are reflected back from tissue boundaries within the body. The ultrasound signal is also attenuated by tissues to an extent that depends on the tissue density. The returning signals are reconstructed and displayed. Because tumors often have a similar echogenicity to that of the adjacent tissue, it can be very difficult or even impossible to delineate a tumor with conventional B-mode imaging. However, malignancies are often associated with a change in tissue hardness. Sonoelastography is an ultrasound technique that is capable of displaying tissue hardness to provide the clinician with important additional diagnostic information. The technique is especially useful in lesions that are not easily palpated—providing tissue differentiation by quantifying the tissue elasticity. A technique known as the extended combined autocorrelation method provides the mathematical basis for the sonoelastography method described below. The returning radiofrequency echo patterns are compared over time. If the transducer has not moved during a given time and no pressure is applied to the scanned tissues, the received echo patterns will be the same, provided there is no respiratory or cardiac motion. If gentle pressure is applied to the tissues, the radiofrequency echo patterns will change. If the distance between two reflectors remains the same, it is a “harder” tissue area. If this distance decreases, then it represents elastically deformable tissue (Fig. 8.3). The echo patterns in the adjacent tissue areas are also analyzed in order to detect possible lateral displacement of the compressed tissue area. Fig. 8.2 The elasticity characteristics of various tissues under compression, based on a spring-coil model. When the same pressure is applied, a soft (more elastic) spring coil is compressed to a greater extent than a hard spring. With the extended combined autocorrelation method, it is possible to acquire measurements in real time and display them simultaneously on various ultrasound systems from different manufacturers. Using this technology, large displacements can be analyzed very quickly and accurately in comparison with conventional autocorrelation methods. An accurate mathematical explanation of the sonoelastography mode based on the extended combined autocorrelation method is described by Yamakawa and Shiina.2 The strain field is calculated from the displacement, allowing conclusions to be drawn regarding the elasticity of the tissue area examined. Areas characterized as soft tissue appear as areas of high strain, whereas hard tissue structures appear as areas with lower elasticity. As sonoelastography developed, it became apparent that the procedure had to be integrated into a routine examination procedure using standard linear or curved transducers, as well as specialist transducers for endovaginal, endorectal, laparoscopic, and endoscopic applications. The method was also developed without any need for additional equipment (for example, to induce pressure or vibration in the tissues), providing a user-friendly system for routine clinical use. The tissue elasticity distribution is calculated using a three-dimensional tissue phantom together with a 3D finite element method (3 D-FEM). The finite element method (FEM) is a type of mathematical analysis that is used in engineering science to develop complex statistical components for calculating stress deformation and also complex flow fields and flow processing. Using this technique, complex geometrical structures are divided into small components (finite elements). The deformation of a structure such as a cube is well known, and the power that is introduced at the edge of the cube can be calculated. The calculation can be done first for each cube and then for the structure as a whole. In the sonoelastography mode described below, the finite element method is used inversely. The structure being examined is divided in up to 30 000 equal cubes. Before compression, it is assumed that the tissue elasticity (measured using the modulus of elasticity or Young’s modulus, E) is constant throughout. After compression, the resulting displacement is measured for each finite element (cube), and the deformation of the edges of the cube can be calculated and the strain evaluated. The FEM confirms the tissue elasticity of each individual cube. The iterative process depends on different variables (e.g., the power, velocity, duration, and surface distribution of the induced compression). This iterative process is repeated until predefined thresholds are reached. The exact mathematical process involved in calculating tissue elasticity is described by Nitta et al.3 and Yamakawa and Shiina.4 Fig. 8.3 Radiofrequency signals for an ultrasound vector before compression (left) and under compression (right). Compression in hard tissue areas is shown as blue and compression in soft tissue areas is red. The performance of real-time sonoelastography using the extended combined autocorrelation method and the 3 D finite element method have been investigated using phantoms and in vivo experiments. Figure 8.4a shows a phantom containing a gelatin cube that has been used to mimic a tumor. The stellate tumor contains a concentration of 30% gelatin, while the surrounding tissue has a concentration of 10%. The materials are made of polyethylene dust. Figure 8.4b shows the phantom in B-mode imaging. It is not possible to visualize the simulated tumor clearly, as its echogenicity is similar to that of the surrounding gelatin. Figures 8.4c and d show the same structure in sonoelastography mode, with the stellate structure clearly visible in the deformation image and elasticity image. To provide better visualization of tumors and to characterize them, the elastogram is displayed in color and provided as a transparent overlay on the conventional B-mode image. Hard tissue structures are displayed in blue, and soft structures are encoded in red (Fig. 8.5). Sonoelastography is a real-time method. E.g., using the Hitachi EUB-8500 system, the frame rate varies from 10 to 35 images per second, depending on the size of the area analyzed (the region of interest). Fig. 8.4a–d a A tissue elasticity phantom, with an inclusion mimicking a starshaped tumor. b The B-mode image of the stellate inclusion. The structure is very difficult to visualize. Bycontrast, the stellate inclusion is easily seen in the deformation image (c) and elasticity image (d). Fig. 8.5 A tissue elasticity image (left), with hard tissue areas shown in blue and soft tissue areas in red/green. The right side of the monitor image shows the corresponding B-mode display. In addition, quantification of the color display can be provided using several algorithms. At present, this is still performed “offline,” using digital video scans. Real-time quantification that accurately determines the elasticity values is currently being developed and will soon be incorporated into the system. Elastography is a widely discussed topic in the current literature.5–18 Sonoelastography in the Clinical Setting Conventional ultrasound endoscopes are used for sonoelastography of the mediastinal and peri-intestinal lymph nodes, pancreas, and anorectum. Electronic longitudinal ultrasound endoscopes or fiberoptic or electronic radial endoscopes can all be used. The advantage of using endoscopic ultrasound with elastography is that aspiration can be carried out immediately in any suspicious area. The gentle curvature on the surface of the longitudinal endoscope is particularly well adapted for applying uniform pressure on tissues. To perform sonoelastography, the ultrasound endoscope is positioned in the same way as for a conventional endosonography examination. The area to be evaluated is defined by a region of interest (ROI) in exactly the same way as in a color Doppler examination. For sonoelastography, little additional compression is required, as the pressure from the pulsation of the surrounding vessels is normally sufficient. A sensitive system setting is required. The ROI has to be sufficiently large, with the area of the lesion being no more than 50% of the size of the ROI, to allow the sonoelastography image to display the elasticity of the lesion relative to the surrounding tissues. Research aiming to allow accurate definition of elasticity is currently in progress. If the ROI is too small, the relative elasticity differences within the lesion are displayed and the hardness of the lesion relative to the normal surrounding tissue is not seen. Review of the Literature Endoscopicultrasound (EUS) elastographywasfirst described by Giovannini and co-workers in 2006, with very promising results for evaluating benign and malignant lymph nodes and pancreatic tumors.19 It was hypothesized that the diffuse and focal organ changes caused bylymphadenopathy might have specific elastographic qualities that would make it possible to establish the correct diagnosis noninvasively, or at least allow the disease to be classified as benign or malignant. It should be borne in mind that malignant lymph node infiltration often starts in a microscopic and circumscribed form, independently of the size of the lymph node that has been infiltrated. Some 20–50% of malignant lymph node infiltration (depending on the part of the gastrointestinal tract examined) is therefore observed in lymph nodes <5mm in size—which also means that it is difficult to detect the affected lymph nodes using EUS.20 The aim in a subsequent study was to test the feasibility of elastography-guided EUS of the mediastinum by comparing the elastographic patterns of lymph nodes with results from EUS-guided fine-needle aspiration biopsy (FNAB).21 The accuracy of EUS-guided FNAB exceeds 90% for mediastinal masses (see Chapter 9). False-positive results are rarely reported, and the risk of false-negative findings related to malignant disease—i.e., the probability of missing a malignancy in lymph nodes found to be benign at the histologic examination—has been shown to be low. Fifty consecutive patients undergoing EUS-guided FNAB of at least one mediastinal (paraesophageal) lymph node were included in the study. The indication for EUS-guided FNAB was based on computed-tomographic assessment of enlarged mediastinal lymph nodes. The lymph nodes were selected for FNA following the recognized B-mode criteria for malignancy (round, echo-poor, >10mm, sharp border), and each lymph node was recorded in the protocol. Each of the targeted lymph nodes was also examined elastographically.
Related posts:
![]()
Stay updated, free articles. Join our Telegram channel

Full access? Get Clinical Tree


Radiology Key
Fastest Radiology Insight Engine
 EUS Evaluation of Lymph Nodes