Outline
Fetal Cardiovascular Physiology, 372
Ultrasound Equipment, 372
First and Early Second Trimester Fetal Cardiac Evaluation, 372
Second Trimester Fetal Cardiac Evaluation, 378
3D and 4D Fetal Cardiac Evaluation, 396
Acquisition of Volume Datasets With 4D Sonography and STIC, 396
Display Modalities in 4D Sonography and STIC, 397
Rendering Techniques in 4D Sonography and STIC, 400
Accuracy and Reproducibility of 4D Sonography in the Prenatal Diagnosis of Congenital Heart Disease, 400
First and Early Second Trimester 4D Fetal Echocardiography, 401
Fetal Cardiovascular Disease, 401
Overview, 401
Congenital Heart Lesions, 402
Cardiac Masses and Tumors, 437
Fetal Cardiac Arrhythmias, 440
Pericardial Effusions, 444
Fetal Heart Failure/Impaired Cardiovascular Performance, 444
Extracardiac Masses, 445
Summary of Key Points
- •
Prenatal diagnosis of congenital heart disease (CHD) can reduce morbidity and mortality rates by means of delivery and intervention planning.
- •
With the proper technology and skill, some forms of fetal cardiac disease can be detected using first trimester and early second trimester sonography.
- •
The addition of outflow tracts to the four-chamber view in the standard midtrimester screening examination greatly improves the detection of fetal cardiac disease and is recommended.
- •
Use of standard scan planes and systematic assessment of the fetal cardiovascular system is useful in evaluating for cardiac disease.
- •
Ventricular septal defects (VSDs) are the most common CHD, and their size and location determine the clinical course and management.
- •
Conotruncal defects may be difficult to differentiate and are associated with widely variable outcomes, so accurate diagnosis is important. For these lesions, the key to diagnosis is determining the source of pulmonary blood flow.
- •
There are varying patterns of left-sided heart hypoplasia. In evolving hypoplastic left heart syndrome (HLHS) due to aortic stenosis, the four-chamber view may initially appear normal in early gestation; the key to early detection is to assess for left-sided heart growth as pregnancy advances and for the development of left ventricular dysfunction and endocardial fibroelastosis.
- •
Fetal heart failure is a common pathway for both primary and secondary cardiovascular disorders. Careful assessment of signs of cardiac failure can help determine prognosis and possible need for intervention.
A major purpose of fetal sonographic evaluation is detection of cardiovascular disease to optimize counseling and care of the fetus. This noninvasive approach has been used to evaluate the fetal heart since the 1970s, and in the current era, with advances in imaging technology, up to 95% of major CHD can be prenatally detected by detailed fetal echocardiography. However, in population studies, the rate of prenatal diagnosis of major congenital heart lesions by screening methodology is much lower and highly variable by practice and region. This lower rate is likely due to a combination of factors, including limitations in access to prenatal care, equipment, and experience of the sonographer or medical care provider; time constraints; and certain patient factors, such as poor acoustic windows.
A large portion of fetal cardiovascular disease is composed of CHD. CHD is associated with significant morbidity and mortality risks; in fact, CHD is the primary contributor to birth defect–related infant fatality, accounting for nearly one quarter of infant deaths from birth defects. Approximately 18 per 10,000 live births have critical congenital heart defects, defined as defects requiring surgery or catheter intervention in the first year of life. Outcomes are highly variable by lesion and coexisting conditions. For example, isolated VSD has nearly 100% infant survival rate, HLHS has 70% to 80% infant survival rate, but HLHS with Turner syndrome has less than 10% survival rate. Fetal cardiovascular disease also consists of fetal arrhythmia, cardiac dysfunction and high output heart failure, pericardial effusions, and cardiac and extracardiac thoracic masses.
Prenatal diagnosis of CHD or arrhythmia allows for many potential benefits for the family and fetus. These benefits include emotional preparation for the parents, fetal therapy when indicated, and parental choice of the hospital that will provide postnatal care and intervention. Parents can plan delivery at an institution with considerable expertise and experience to provide the best postnatal care for the infant. Prenatal diagnosis, by conferring these benefits to families, is associated with improved presurgical status of the infant with CHD, as well as lower morbidity and mortality rates in infants with complex CHD. Prenatal detection of CHD also allows time for families to accept and understand the diagnosis prior to the birth of the infant. Although prenatal diagnosis has been shown to increase stress during pregnancy, families overwhelmingly state they would prefer to have this knowledge sooner than to learn of CHD after birth.
In this chapter, we review normal fetal cardiovascular anatomy and physiology, recommended approaches for prenatal cardiac screening and detailed evaluation, ultrasound findings associated with common types of CHD, and specific imaging tools for common fetal heart diseases.
Fetal Cardiovascular Physiology
Our fundamental understanding of the human fetal circulation and changes attributable to CHD was originally extrapolated from early work with fetal lambs. The introduction of fetal ultrasound imaging and more recently the use of fetal cardiac magnetic resonance imaging (MRI) have refined our understanding of fetal cardiac physiology. Unlike the postnatal heart, in which blood flow is in series, the right and left fetal ventricular outputs are parallel circuits ( Fig. 13-1A ). Starting from the placenta, maternal oxygenated blood courses through the umbilical vein and enters the inferior vena cava via the ductus venosus (DV). This oxygenated blood accounts for approximately 50% of blood returning to the right atrium (RA) ( Fig. 13-2 ). Oxygenated blood enters the RA, but instead of predominantly then flowing to the right ventricle (RV), oxygen-rich blood is directed across the fetal foramen ovale to the left atrium (LA) by the eustachian valve. Most fetal left-sided blood flow is provided in this manner (~63% per MRI estimates ). Blood then courses from the LA across the mitral valve to the left ventricle (LV) and is ejected across the aortic valve into the ascending aorta. Blood flow is then directed to the brain and upper extremities (73% of aortic outflow) while the rest is ejected to the inferior portion of the fetal body (28% of aortic output, 11% of combined cardiac output [CCO]) and joins blood from the ductus arteriosus (72% of pulmonary output, 41% of CCO) in the descending aorta.
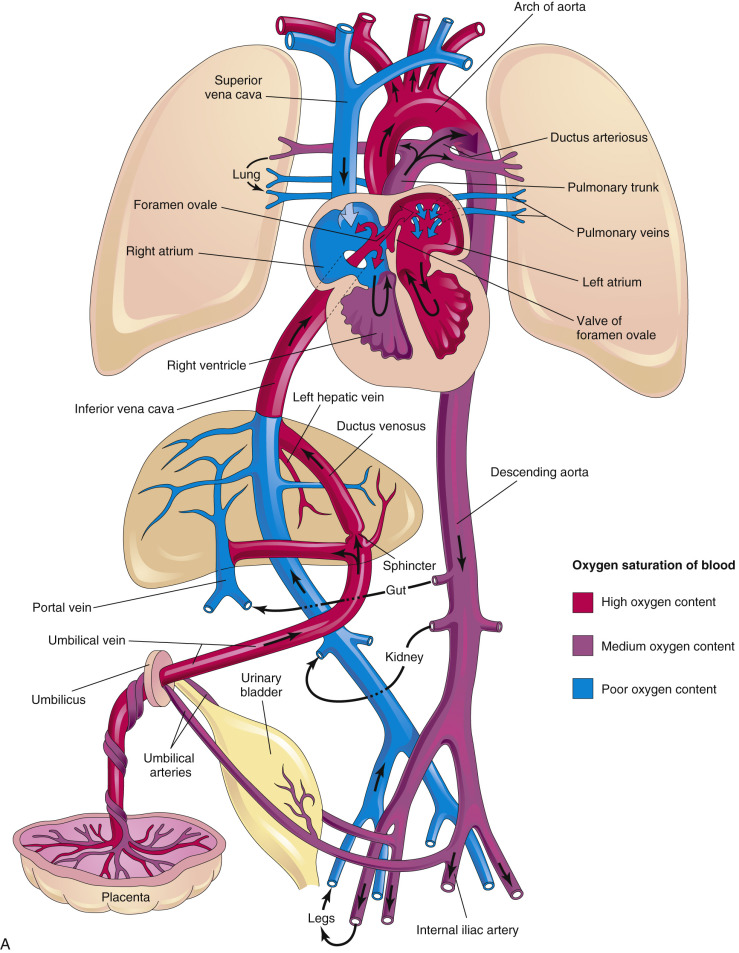

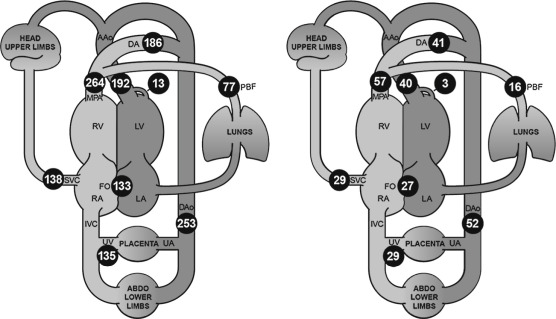
Some of the blood that was delivered to the head, arms, and lower extremity organs and muscles eventually returns deoxygenated to the heart via the superior vena cava and inferior vena cava (52% of CCO), while some is returned to the placenta via the umbilical artery (approximately 29% of CCO). Deoxygenated blood with lower glucose levels returning through the fetal systemic veins courses through the RA, RV, and across the pulmonary valve into the pulmonary artery, and primarily traverses the ductus arteriosus into the descending aorta. A small proportion of blood in fetal life is directed into the branch pulmonary arteries into the lungs (approximately 28% of pulmonary flow, 16% of CCO) and returns to the LA via the pulmonary veins. Three percent of cardiac output supplies the coronary artery system. This normal fetal circulation essentially allows the most oxygen-rich, glucose-rich blood to reach the fetal brain, and may be significantly altered when CHD is present.
At the time of birth, when placental blood flow ceases, oxygen-rich umbilical venous blood is no longer directed into the fetal heart (see Fig. 13-1B ). However, at the same time, the newborn infant has started to breathe, and much of the blood flow from the pulmonary artery that was directed across the ductus arteriosus in fetal life is now redirected to the pulmonary arteries to perfuse the newly expanded lungs. This blood becomes oxygenated and returns to the LA via the pulmonary veins. During this transition, the ductus arteriosus closes and in most infants the foramen ovale also closes. Blood flow to the left side of the heart transitions from being supplied via the foramen ovale to being supplied by the pulmonary veins. Failure of the foramen ovale or the ductus arteriosus to close results in patency of these structures; these defects are considered CHD (patent foramen ovale [PFO] and patent ductus arteriosus [PDA]).
Ultrasound Equipment
Contemporary two-dimensional (2D) ultrasound systems for fetal cardiac screening provide gray-scale and Doppler ultrasound capabilities. Broadband ultrasound transducers are designed to minimize ergonomic stress with a small scanning footprint that can be angled or maneuvered between fetal ribs for satisfactory views of the heart. Higher frequency transducers provide greater resolution, but at the expense of decreased penetration. Harmonic imaging, speckle reduction, and write priority for balancing color Doppler with gray-scale ultrasound images are commonly available. Optimal cardiac studies will be achieved while using high frame rates because temporal resolution should adequately capture movement of anatomic structures throughout the cardiac cycle. Digital video clips are recommended to document fetal cardiac findings.
First and Early Second Trimester Fetal Cardiac Evaluation
Our ability to identify heart defects in the prenatal period is limited by the following factors: (1) early or late gestational age; (2) structural complexity of the fetal heart, particularly in the abnormal heart; (3) the extensive training required to become proficient in, and maintain expertise in, fetal cardiac sonography; (4) frequent fetal and maternal motion; (5) maternal obesity; (6) limited or excessive amniotic fluid volume; (7) fetal position; and (8) maternal abdominal scar tissue. Limitations are especially present in early pregnancy, when small fetal structures are most difficult to image.
Cardiac Examination
The American Institute of Ultrasound in Medicine (AIUM) recommends routine documentation for the presence or absence of cardiac activity with a 2D video clip or M-mode imaging when a standard viability first trimester ultrasound examination is performed. However, additional cardiac evaluation may be performed when indicated, as discussed later.
High-frequency, high-resolution transvaginal and transabdominal probes, with improvements in magnification imaging and signal processing, have increased the visualization of the fetal heart during the first and early second trimesters of pregnancy. The standard fetal cardiac screening 2D views (details in next section) typically performed in second and third trimester cardiac screening can also be performed in the first trimester and early second trimester, usually no earlier than 11 weeks’ gestation. Visualization of these sonographic planes can be facilitated by using color Doppler imaging.
Early gestation views in the four-chamber plane are depicted in Figure 13-3A . Color flow mapping helps in the evaluation of the four-chamber view to delineate the flow into both ventricles and gives an approximate estimation of the ventricular size ( Fig. 13-3B ).
 weeks of gestation. B, Four-chamber view with high definition color Doppler in a fetus at
  weeks of gestation. Note that color Doppler allows for a better delineation of the interventricular septum. IVS, interventricular septum; LA, left atrium; LV, left ventricle; RA, right atrium; RV, right ventricle.
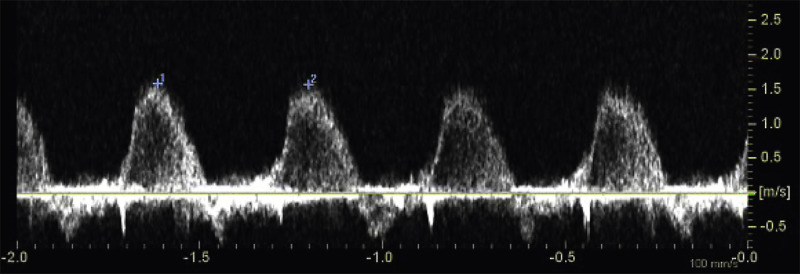
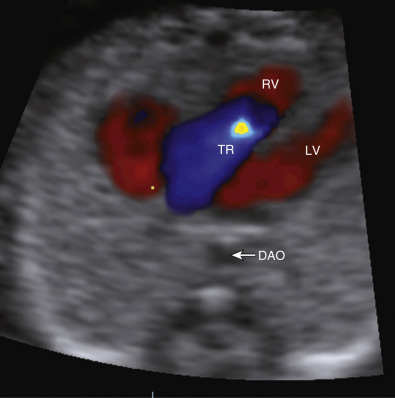
 Early gestation imaging in the left ventricular outflow tract (LVOT) view can be performed and may be better visualized with color Doppler early in pregnancy ( Fig. 13-4 ). In the three-vessel and trachea (3VT) view ( Fig. 13-5A ), color flow mapping is useful in delineating the great arteries and the confluence of the ductus arteriosus and the aortic arch (V sign) ( Fig. 13-5B ). Color and spectral Doppler evaluation can also help in the identification of valvar regurgitation. For the spectral Doppler evaluation of tricuspid regurgitation, a sample gate of 2 mm to 3 mm is recommended, which should be positioned above the tricuspid valve in an apical four-chamber view with an angle of insonation of less than 20 degrees. The diagnosis of tricuspid regurgitation can be made with the demonstration of a spectral Doppler waveform that involves at least half of systole and a velocity of more than 80 cm/second ( Fig. 13-6 ). In cases of severe tricuspid regurgitation such as in Ebstein anomaly this can be visualized by color Doppler in the first trimester of pregnancy ( Fig. 13-7 ).
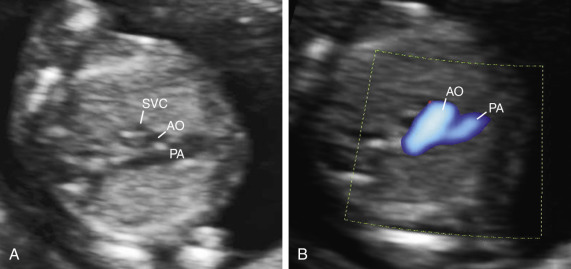
 weeks of gestation. DAO, descending aorta; LV, left ventricle; RV, right ventricle; TR, tricuspid regurgitation.
 If normality of situs and cardiac connections, atrioventricular (AV) connections, right- and left-sided symmetry, and ventriculoarterial connections can confidently be demonstrated, most major structural malformations can be excluded. However, septal defects and developmental lesions may be overlooked; thus, there is a need for follow-up in the second trimester of pregnancy. The additional use of color flow mapping to assess intracardiac flow velocities will enhance detection of valvar lesions, such as aortic and pulmonary stenosis, which may progress to critical stenosis during the third trimester. Methods have been described to optimize prenatal detection of CHD using adjunctive evaluation of the fetus in early pregnancy, including assessment of nuchal translucency (NT), fetal Doppler waveforms, aberrant right subclavian artery, and cardiac axis.
Mounting evidence supports the association of increased NT between 11 and 14 weeks of gestation and an increased risk for CHDs in both high-risk and low-risk populations. Among fetuses with increased NT measurements, the higher the NT measurement, the higher the prevalence of CHDs. However, increased NT measurement is only modestly predictive of CHD. In a large meta-analysis involving more than 58,000 fetuses, the detection rate of an increased NT measurement was only 31%, for a false positive rate of 1%. Thus, other approaches had been used to evaluate the risk for CDH in the first trimester of pregnancy, including a combination of increased NT measurement, tricuspid regurgitation, and abnormal spectral flow waveforms in the DV ( Fig. 13-8 ).
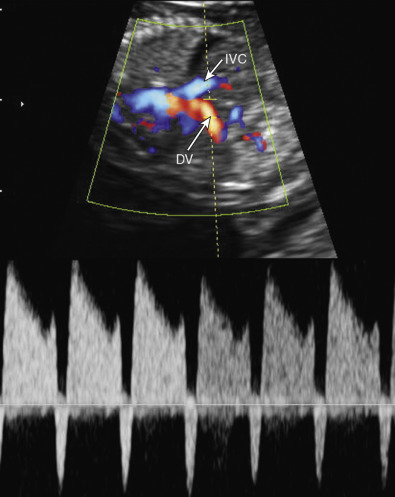
Abnormal DV waveforms, including negative/reversed a wave and increased pulsatility index for the veins (PIV), have been associated with structural cardiac abnormalities in euploid first trimester fetuses. The sensitivity and specificity of abnormal DV waveforms in the identification of CHDs are 80% and 83% in fetuses with increased NT, whereas the respective values in fetuses regardless of their NT measurement are 50% and 93%.
Other findings during the first trimester scan associated with CHD include abnormal cardiac axis ( Fig. 13-9 ) and aberrant subclavian artery. Sinkovskaya and associates measured the cardiac axis on the four-chamber view in a prospective study between 11 and 14 weeks’ gestation. The authors reported that the mean value for the cardiac axis in fetuses without cardiac anomalies was 47 degrees with limits of normality between 35 degrees and 60 degrees. An abnormal axis was seen in four of the six cases with CHD (of which three showed a structurally abnormal four-chamber view): one with HLHS, two with atrioventricular septal defects (AVSDs, one unbalanced, one associated with isomerism), and one with tetralogy of Fallot (TOF). The authors concluded that this approach may help to identify pregnancies at risk of CHD. Of note, women with a body mass index (BMI) of 30 or higher were excluded from the study, and nearly one in five cases required a combined transabdominal and transvaginal approach. Thus, for CHD screening purposes, this strategy may be applicable only in facilities with availability and expertise in transvaginal sonography.
Effectiveness of Early Gestation Cardiovascular Evaluation
A study using transvaginal sonography reported that the success rate of visualization of the four-chamber view, LVOT view, pulmonary trunk with three-vessel view (3VV) and crossover of the great arteries increased with gestational age, from 20% in week 11 to 92% in week 13. In a study among women undergoing chorionic villus sampling between 11 and 13 weeks of gestation, the authors reported a 93.1% accuracy in the identification of CHDs using a high-frequency linear transducer. In another study in high-risk women, using a combination of transabdominal and transvaginal sonography, the authors reported a 70% sensitivity and a 98% specificity in the identification of CHDs before 16 weeks’ gestation. In a large low-risk population, the authors reported that in 29 of the 39 cases of CHDs the heart defect was suspected in the first trimester. Of note, in the latter study all examinations were performed using transabdominal sonography; however, in 7.3% of the cases a transvaginal scan was also required.
In a more recent study, Zidere and coworkers performed a comparison of fetal echocardiography findings at less than 15 weeks of gestation in 1200 patients and a follow-up scan at least 6 weeks later. The authors reported a high degree of accuracy in the identification of CHD by early fetal echocardiography (sensitivity 84.8%, 95% confidence interval [CI] 75.0-91.9; specificity 95.3%, 95% CI 93.9-96.4). Discordance between the two scans was found in 85 patients. In 50 of them, there was mild tricuspid regurgitation ( n = 44), mild mitral regurgitation ( n = 3), or both ( n = 3) at the early scan and no abnormal findings at the second scan. In three cases, CHD was suspected at the first scan but was not confirmed at the second scan (false positive diagnoses), and in four cases, less complex CHD than originally suspected at the first scan was found at the second scan. In 29 fetuses, an abnormality was found at the second scan that had not been detected at, or that had changed in severity since, the early study. The discordance was considered significant in 15 of the 29 cases. The authors suggested that in 10 cases of the latter group the significant differences between the early and later scans represented true progression of findings between the early and later scans, rather than missed or incorrect diagnoses. The authors concluded that early fetal echocardiography between 12 and 14 completed weeks’ gestation is highly specific for the detection of CHD. However, the identification of every case of TOF and mild AV canal variants presents particular diagnostic challenges in early fetal echocardiography. Changes in severity appear to occur particularly in obstructive lesions at the aortic and pulmonary valves and in the aortic arch, and there are limitations on accuracy with more subtle malformations. In an accompanying editorial the author cautioned that in the study of Zidere and coworkers, if fetuses with resolving mild functional abnormality are removed from the denominator, 7/81 (9%) had a false positive diagnosis of CHD. A further 15/81 (18.5%) had important discordant findings at the second trimester scan, with 10/15 thought to be due to progression of disease that led to an alteration in counseling. Thus, even in expert hands, over 27% of important fetal structural CHD were missed or the parents were counseled inappropriately for the eventual outcome. The author proposed that concerns about the quality of information that can be obtained from the early human heart in euploid fetuses should make us pause to reconsider echocardiography in the first trimester and perhaps defer it until later in pregnancy.
Second Trimester Fetal Cardiac Evaluation
Rationale and Effectiveness
Given that CHD is the most common birth defect, one of the major goals of the standard second trimester ultrasound examination is to evaluate for cardiac disease. Of highest priority is the identification of fetuses at risk for ductal dependency and hypoxemia after birth ( Table 13-1 ). The examination is typically performed at 18 to 22 weeks’ gestation. Of note, a prospective randomized study of second trimester fetal cardiac screening suggests that unselected pregnant women are less likely to require an additional scan at 20 to 22 weeks’ gestation than at 18 weeks’ gestation.
| Lesion | Prevalence * | Hypoxemia | Ductus Arteriosus Dependent |
|---|---|---|---|
| Outflow Tract Defects | |||
| Tetralogy of Fallot | 6.1 | Most | Uncommon |
| D-transposition of the great arteries | 4.0 | All | Uncomon |
| Double-outlet right ventricle | 1.7 | Some | Some |
| Truncus arteriosus | 1.0 | All | None |
| TAPVC | 1.2 | All | None |
| Ebstein anomaly | 0.6 | Some | Some |
| Right Obstructive Defects | |||
| Tricuspid atresia | 0.5 | All | Some |
| Pulmonary atresia, intact septum | 0.8 | All | All |
| Pulmonary stenosis, atresia | 6.3 | Some | Some |
| Left Obstructive Defects | |||
| Hypoplastic left heart | 3.3 | All | All |
| Coarctation of the aorta | 4.7 | Some | Some |
| Aortic arch atresia or hypoplasia | 1.0 | Some | All |
| Aortic valve stenosis (critical) | 1.6 | Uncommon | Some |
| Other major heart defects | 12.4 | Some | Some |
* Per 10,000 livebirths. Data are derived from the Metropolitan Atlanta Congenital Defects Program.
Earlier practice guidelines for fetal cardiac screening encouraged visualization of the four-chamber view or “basic scan” with inclusion of the cardiac outflow tracts as part of an “extended basic scan” only if technically feasible. However, additional assessment of both ventricular outflow tracts can improve the cardiac anomaly detection rate to approximately 80%. A large retrospective review of over 18,000 midtrimester screening examinations with normal four-chamber views were examined at a single institution to determine how often outflow tracts could be obtained during a routine scan. In 7.0% of 1308 scans, the main pulmonary artery, aortic outflow tract, or both were poorly visualized. In 778 scans (4.2%), poor visualization of the aorta only was noted. In 297 scans (1.6%), poor visualization of the pulmonary artery only was noted. In 233 scans (1.3%), neither ventricular outflow tract could be visualized. Given the significantly improved detection of CHD, and the low rate of poor visualization of the outflow tracts, recent guidelines now consider visualization of both arterial outflow tracts to be an integral part of the midtrimester fetal cardiac screening examination.
The effectiveness of routine midtrimester fetal cardiac evaluation was reported in a large screening study of over 30,000 pregnancies in a nonselected Norwegian population. This study was performed at a single institution where 98% of pregnancies received routine midtrimester screening scans at approximately 18 weeks’ gestation that included a four-chamber view with visualization of the great arteries. Over one half (57%) of the 97 CHD cases with major cardiac defects were detected prenatally. Their findings underscored the importance of examiner experience for the effective detection of major CHD.
Cardiac Screening
The cardiac screening examination is optimally performed between 18 and 22 weeks’ gestation, typically as part of a routine fetal anatomic survey. Standardized transverse scanning planes are used to screen fetuses for CHD using basic principles that have been based on a sequential segmental approach to describing sonographic findings. Cardiac ultrasound images are typically optimized by adjusting image display depth, modifying acoustic focus for the heart, and maintaining low frame persistence. A relatively narrow scan angle will permit satisfactory temporal resolution.
Standardized Scan Planes.
Because the relatively enlarged fetal liver displaces the fetal heart into a more horizontal position, the examiner can use standardized transverse planes to systematically evaluate fetal cardiac anatomy ( Figs. 13-10 through 13-12 ).


The four-chamber view permits assessment of major anatomic landmarks with particular emphasis on the AV junctions. Further examination of the size and relationship of the aortic and pulmonary outflow tracts, 3VV, and 3VT view ( Figs. 13-13 and 13-14 ) provides a means to evaluate the size, number, alignment, and appearance of the great arteries in relation to their ventriculoarterial junctions and surrounding anatomy. The same views used in cardiac screening are used in formal fetal echocardiography, in addition to a series of other views obtained in different planes ( Figs. 13-14 and 13-15 ). The additional views are discussed further later in this section (“ Standard Views ”).


Describing the Heart.
Evaluation of cardiovascular structures includes a description of the anatomy using sequential segmental analysis. Two main historical schools of nomenclature are typically used: the Van Praagh/Boston school and the Anderson/European school, as well as consensus-based nomenclature for CHD surgery that is typically used for databases. Regardless of the names used, description of the heart typically includes evaluation of (1) atrial anatomy, (2) AV connections, (3) ventricular looping/topology, (4) ventriculoarterial connections, and (5) description of the great arteries ( Fig. 13-16 ). Abnormalities of these normal relationships are present in many types of heart disease, as detailed in the following sections. Some examples of abnormal atrial anatomy, AV connections, ventricular looping, ventriculoarterial connections, and great artery arrangement are illustrated in Figure 13-17 .


Standard Views
Plane 1: Transabdominal View.
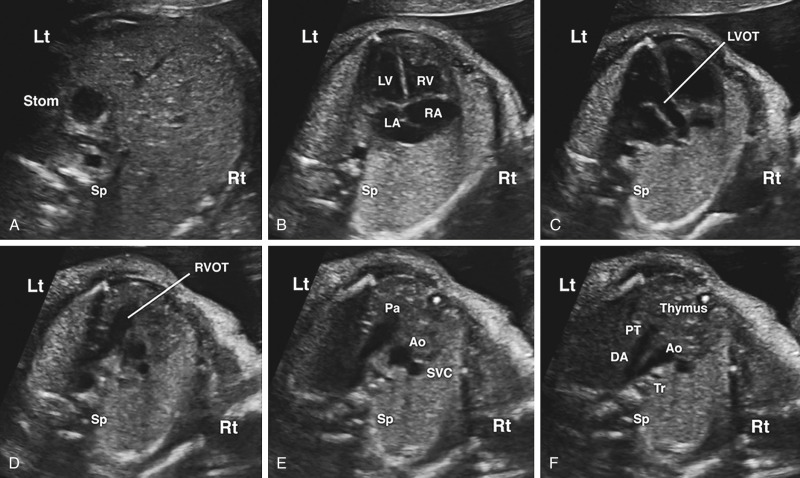
A transverse view of the upper fetal abdomen is first evaluated to confirm normal situs ( Fig. 13-18 ). The most caudal transabdominal scanning plane typically reveals a left-sided fetal stomach with a main hepatic lobe and gallbladder on the right side. This view is useful in heterotaxy syndromes such as left atrial isomerism (polysplenia) and right atrial isomerism (asplenia) that may be associated with complex cyanotic heart disease and cardiac rhythm disturbances.

Plane 2: Four-Chamber View.
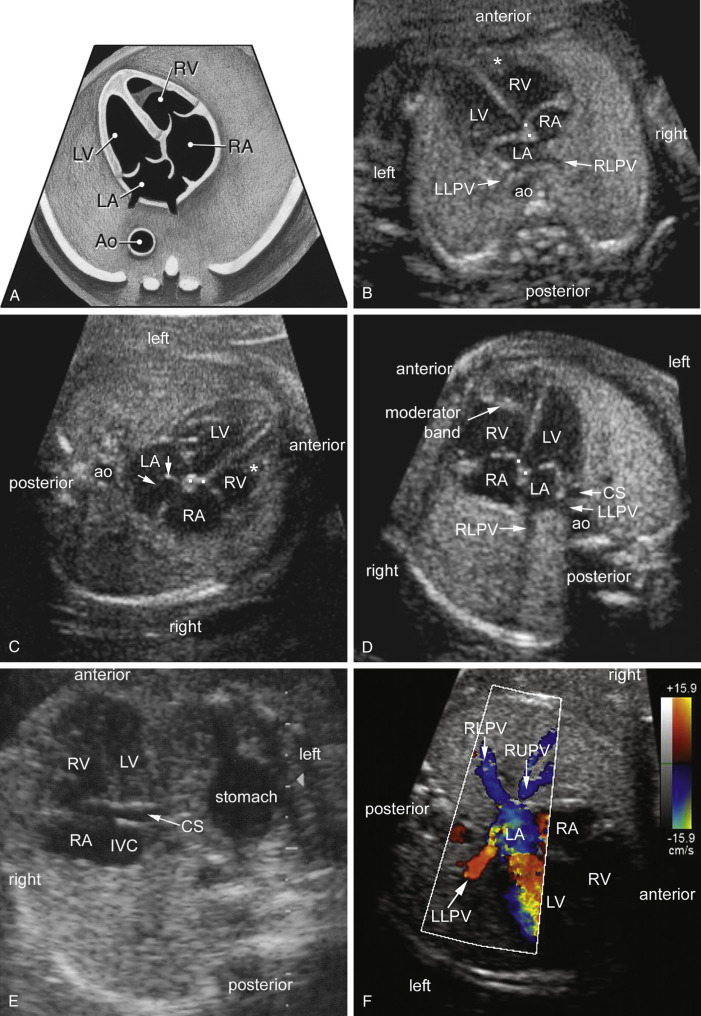
After one verifies the stomach on the left side and liver on the right, the transducer is swept cephalad across the fetal thorax toward the head to obtain a four-chamber view and to assess cardiac position and direction of the apex ( Figs. 13-11, 13-12B, 13-14, and 13-19 , ). The four-chamber view is defined by a specific set of diagnostic imaging criteria that have been well summarized by the International Society of Ultrasound in Obstetrics and Gynecology ( Table 13-2 ).
| General Assessment |
|
| Atrial Chambers |
|
| Ventricular Chambers |
|
| Atrioventricular Junction and Valves |
|
Plane 3: Left Ventricular Outflow Tract View.
Continuation of a transducer sweep toward the fetal head will reveal an aortic outflow tract that originates from the LV ( Figs. 13-11, 13-12C, 13-14, and 13-20 , ). Although not required for screening, it may be possible to visualize neck vessels of the transverse aortic arch as one follows the distal end of the LVOT. The medial aortic wall should be continuous with the ventricular septum. Membranous or conoseptal VSDs will be seen in this plane and will not be visualized on a four-chamber view. Use of color or spectral Doppler imaging is not a mandatory part of the LVOT evaluation, although familiarity in its use and adding it to routine screening is encouraged, as they can aid in the identification of aortic stenosis or aortic regurgitation.

Plane 4: Right Ventricular Outflow Tract View.
The next scanning plane demonstrates a pulmonary artery that originates from a morphologic RV that is identified by a moderator band ( Figs. 13-11, 13-12D, 13-14, and 13-21 ). A pulmonary artery bifurcation may be visualized ( Fig. 13-21C ), although this finding is not a required element for a technically satisfactory cardiac screening examination. An example of a right ventricular outflow tract (RVOT) abnormality is narrowing of part of the RVOT in TOF, although narrowing may not be apparent until later stages of pregnancy. Familiarity of using color Doppler sonography for routine assessment of the RVOT is encouraged, although it is not considered a mandatory component for cardiac screening. Color and spectral Doppler evaluation of the RVOT can aid in the identification of pulmonary stenosis or pulmonary regurgitation.

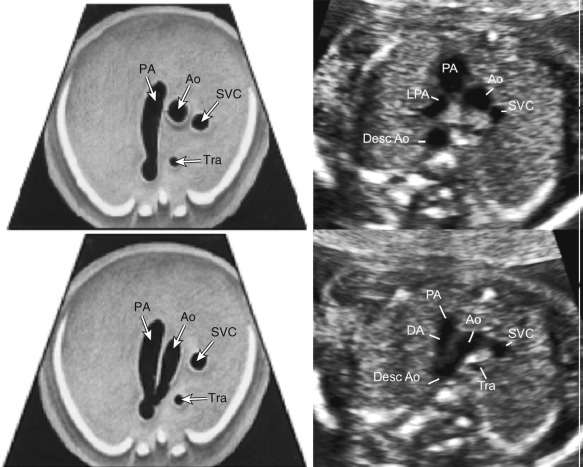
Plane 5: Three-Vessel View.
A 3VV provides a transverse view of the upper fetal mediastinum. In this plane, the main pulmonary artery, ascending aorta, and superior vena cava are arranged in a straight line that extends from the left anterior to right posterior aspect of the mediastinum with decreasing magnitude of their vessel diameters ( Figs. 13-11, 13-12E, 13-13, 13-14, and 13-22 ). If technically feasible, the 3VVshould be attempted as a routine part of a midtrimester screening examination. Color Doppler sonography is not a mandatory part of the 3VV, although familiarity in its use and adding it to routine screening is encouraged.
Normal and abnormal examples for using color Doppler sonography with the 3VV have also been reported. Abnormalities in vessel number, size, alignment, and arrangements may provide clues for anomalies of the great vessel such as right aortic arch or a persistent left superior vena cava. Paladini has also described how the internal mammary arteries can be used to outline the fetal thymus from a 3VT view for fetuses at risk for chromosome 22q11.2 microdeletion.
Plane 6: Three-Vessel and Trachea View.
Finally, a 3VT view is obtained just a few millimeters above the 3VV after slight counterclockwise angulation toward the left from an axial plane ( Figs. 13-12F, 13-13, 13-14, 13-22, and 13-23 ). This plane is used to evaluate major vessels in the fetal mediastinum. The transverse aortic arch and isthmus merge into the descending aorta, as does the pulmonary trunk and ductus arteriosus, creating a V-shaped configuration. Note the presence of an anterior fetal thymus gland in this view as well and how the V-shaped landmark lies just to the left of the trachea.

A 3VT view is very similar to the 3VV except that the aortic and ductal arches are both visualized just superior to the carina (see Fig. 13-13 ). Both arches are normally visualized to the left of the spine and trachea. Much like the 3VV, the 3VT view can be used to assess the number, size, and alignment of the main pulmonary artery, aorta, and right superior vena cava. However, the 3VT view will likely allow the detection of life-threatening ductus-dependent cardiac malformations. In this regard, color Doppler sonography can be very useful for identifying ductus-dependent lesions in this scanning plane. The 3VT view has also been used for the detection of aortic arch anomalies and aberrant right subclavian artery (ARSA). In a study of 106 second trimester Down syndrome fetuses, the incidence of aberrant right subclavian artery was 25%.
Key Components of Screening
General Assessment
Heart Rate.
Fetal heart rate (FHR) reference ranges during the second and third trimesters typically fall between 120 and 160 beats/minute (bpm) with occasional and limited decelerations or accelerations beyond these limits. Benign episodes of fetal bradycardia can occur during a second trimester screening scan, but they quickly recover to normal values, especially if maternal abdominal pressure of the ultrasound transducer is reduced. Although fetal bradycardia has been broadly accepted as a heart rate less than 100 bpm, the American College of Obstetricians and Gynecologists (ACOG) has defined bradycardia as a heart rate less than 110 bpm. Sustained bradycardia below this threshold may be caused by heart block. Mild tachycardia (>160 bpm) can transiently occur in normal fetuses, although persistent tachycardia (≥180 bpm) should be further investigated for problems such as supraventricular tachycardia (SVT), chorioamnionitis, fetal distress, or hyperthyroidism.
Heart Size.
Cardiac circumference measurements provide quantitative verification when cardiomegaly is suspected. Enlarged hearts can be associated with cardiac dysfunction, especially in the presence of pericardial effusion. Cardiomegaly is generally defined as a cardiothoracic circumference ratio greater than 0.50 or a cardiothoracic area ratio greater than 0.25.
Cardiac Axis and Position.
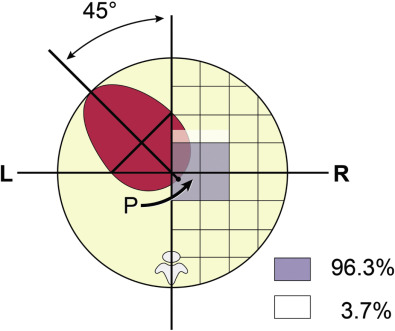
Cardiac axis is determined from a line that is drawn from the spine to the anterior chest wall. This line divides the fetal chest into equal halves with an angle that the interventricular septum makes with this line as the cardiac axis. The fetal heart is located in the left hemithorax with a cardiac axis of 45 ± 20 degrees (see Fig. 13-9 ). The heart can point toward the midline (mesocardia) or be deviated toward the right side of the chest (dextrocardia) as a normal variant. The same line can be extended to the most posterior cardiac border where it intersects the posterior wall as a “P point.” Point P is located within a specific area of the thorax in 96.3% of fetuses.
Both cardiac axis and position are constant throughout pregnancy. Although left cardiac axis deviation (>75 degrees to left) can occur as a normal variant, most cases will be associated with structural malformations, particularly conotruncal anomalies and coarctation, which may not otherwise be detectable from a four-chamber view. Right cardiac deviation (heart axis from 25 degrees to the left of midline to anywhere in the midline or right side of the chest) has been associated with polysplenia/asplenia, situs inversus, AVSD, double-outlet right ventricle (DORV), or common atria. Abnormal cardiac position deviated into the right chest (dextroposition) warrants a further search for either a left-sided congenital diaphragmatic hernia or space-occupying mass such as a cystic adenomatoid malformation.
Four Cardiac Chambers Present.
The presence of four cardiac chambers is an essential component of a normal four-chamber view. However, a simple count of four chambers alone should not be mistaken as being sufficient to fulfill diagnostic criteria for a technically acceptable four-chamber view. In a normal four-chamber view the two atria and the two ventricles will be symmetric in size (see Fig. 13-19A through D ).
No Pericardial Effusion or Hypertrophy.
Pericardial effusions are occasionally identified at the time of a routine cardiac screening examination ( Fig. 13-24 ). A pericardial fluid collection of more than 2 mm in thickness is considered abnormal. Isolated effusions can spontaneously resolve with good postnatal outcomes, although this finding can also be associated with a genetic syndrome such as trisomy 21. Age-specific reference values for left and right ventricular wall thickness have been reported in fetuses.

Atrial Chambers.
A normal fetal cardiac screening examination identifies two atrial chambers of approximately the same size with a normal-appearing foramen ovale flap in the LA (see Fig. 13-19A through D ). The primum atrial septum is intact and pulmonary veins enter the left atrial chamber. The coronary sinus can be visualized in the left AV groove when sweeping inferiorly (see Fig. 13-19E ).
One of the primary reasons for investigating atrial morphologic appearance is to rule out heterotaxy (also known as isomerism), in which the heart has inappropriate symmetry. Berg and colleagues reviewed 30 prenatally diagnosed cases of heterotaxy and have described two types of atrial morphologic features : (1) sickle shape with tip pointing laterally and apically and (2) blunt shape resembling the usual atrial appearance in the four-chamber view (see Fig. 13-17A ). Their results suggest that prenatally diagnosed heterotaxy most often presents with an isomeric morphologic appearance in the four-chamber view, and that differentiation between bilateral left (sickle-shaped) and bilateral right (blunt and pyramidal) isomerism can be determined. This differentiation is particularly significant because the greatest attrition in left atrial isomerism occurs during fetal life, whereas neonates with right atrial isomerism are more likely to experience postnatal problems associated with complex CHD. However, caution should be exercised when applying these findings to a screening population. More information regarding evaluating heterotaxy in the fetal echocardiogram is given in the discussion of congenital heart lesions (“Situs Abnormalities”).
Atrial septal aneurysm may also be visualized from the four-chamber view. A retrospective study of 1302 fetal echocardiograms found a 7.6% incidence of atrial septal aneurysm that was defined as redundant tissue extending at least halfway across the LA. They observed that 36% of fetuses with atrial septal aneurysm had premature atrial beats that appeared to be related to the degree of septal bulging. Their results suggest that such aneurysms almost always resolve after birth and are not typically associated with major cardiac dysrhythmias. Severe atrial septal aneurysms that extend over the mitral valve apparatus have been reported with left-right asymmetry on fetal evaluation, and occasionally with coarctation of the aorta.
Routine screening should also include assessment of the pulmonary veins. A normal four-chamber screening examination usually demonstrates at least two of the four pulmonary veins entering the LA (see Fig. 13-19B through D and F ). Total anomalous pulmonary venous return (TAPVC) should be suspected when the connection between the pulmonary veins and the LA is not evident. The diagnosis of TAPVC should always be considered in cases of heterotaxy, especially in fetuses suspected to have right isomerism. Ganesan and colleagues described sonographic findings for 26 fetuses with a prenatal diagnosis of TAPVC. They concluded that the diagnosis of TAPVC can be suspected on standard axial views during the cardiac screening examination and confirmed on fetal echocardiography based on pulsed-Doppler studies. More detailed information on anomalies of pulmonary venous return is provided later in this chapter under “Anomalous Pulmonary Venous Connection.”
Ventricular Chambers.
A normal four-chamber view requires confirmation of two cardiac ventricles that are approximately the same size, although the RV is usually slightly larger, particularly in late gestation. The normal RV/LV size ratio increases with progressing gestational age (90% CIs ranging from 0.79 to 1.24). Ventricular size discrepancy may be an initial clue for cardiac anomalies during the screening examination despite the presence of normal ventricular diameter measurements.
Left Ventricle.
A cone-shaped LV lies posterior to and leftward of the RV (see Fig. 13-19A through E ). The LV has two distinct papillary muscles, the anterolateral and posteromedial. Both papillary muscles have chordae tendineae, which connect to the mitral valve. The LV septal surface is smooth with fine apical trabeculations and no septal connection to the mitral valve.
Right Ventricle.
The morphologic anterior right ventricular chamber has a moderator band near the cardiac apex (see Fig. 13-19A through D ). Chordae tendineae extend from the septal tricuspid valve leaflet and insert into papillary muscles that arise from the right ventricular septal surface. Unlike the LV, the inlet and apical portions of the RV are heavily trabeculated.
Atrioventricular Junction and Valves
Mitral and Tricuspid Valves.
The AV valves prevent ventricular blood from backing up into the atrial chambers. On the screening examination, valve leaflets do not appear thickened and should move freely throughout the cardiac cycle. Although not required, color Doppler imaging of the AV valves is the most useful way to assess for AV valve regurgitation, which is commonly seen in fetal heart disease, especially in atrioventricular canal defects (AVCDs), Ebstein anomaly and other tricuspid valve disorders ( ), and fetal primary or secondary cardiac dysfunction ( Fig. 13-25 ). AV valves should also be assessed for appropriate connections to the ventricles, as conditions such as tricuspid atresia and mitral atresia can have absent connections to the ventricles, and double-inlet LV can have both AV valves entering the LV ( Fig. 13-26 and ).


Offset Atrioventricular Valves.
In the normal heart, the tricuspid valve annulus is slightly offset from the center crux of the heart and more apically positioned than the mitral valve annulus (see Fig. 13-18 ). Absence of this normal offsetting suggests an abnormality. For example, in Ebstein anomaly, there is excessive apical displacement of the septal tricuspid valve leaflet ( Fig. 13-27 ). In AVCDs and variants, the normal valve offsetting is not present as there is either a common AV valve or separate AV valves at the same level. The normal valve offsetting may not be apparent in fetuses with a dilated coronary sinus, or may be challenging to recognize due to technical factors.

Offset AV valves can usually be visually confirmed in fetuses, although occasionally it may be helpful to measure the distance between insertions of the medial leaflets of the mitral and tricuspid valves (MTD). Calipers are placed parallel to the ventricular septum using a standard four-chamber view. The first caliper is placed at the junction of the insertion point of the atrial surface of the tricuspid valve and ventricular septum, and the second caliper is placed at the level of insertion of the atrial surface of the mitral valve and the ventricular septum. In the second trimester, the mean MTD is 2.8 ± 0.9 mm, and in the third trimester the mean MTD is 4.6 ± 1.1 mm.
Ventriculoarterial Junction and Valves
Aortic and Pulmonary Valves.
The aortic and pulmonary valves prevent blood from backing up into the ventricular chambers during diastole. On the screening examination, normal valve leaflets appear thin and mobile throughout the cardiac cycle.
Arterial Outflow Tracts.
The aorta normally arises from the LV and the pulmonary artery arises from the RV. Conotruncal abnormalities involve a spectrum of anatomic defects such as DORV, TOF, transposition of the great arteries (TGA), and truncus arteriosus that are not usually evident in a four-chamber view. Identification of conotruncal anomalies remains a challenging task for those who routinely screen fetuses for CHD.
The great vessels should appear approximately equal in size and cross over each other at approximately 80 degrees from their respective ventricular chambers. The addition of color and spectral Doppler to outflow tracts is not mandatory, but may facilitate making the diagnosis of valvar regurgitation or stenosis.
Fetal Echocardiography
Guidelines.
Fetuses at risk for CHD should be further examined using a detailed echocardiogram. A practice guideline consensus was recently developed on behalf of several organizations that included the AIUM, ACOG, Society for Maternal-Fetal Medicine (SMFM), American Society of Echocardiography (ASE), and American College of Radiology (ACR). In brief, this collaborative document outlined common maternal and fetal indications for fetal echocardiography but emphasized that most referrals are not associated with known risk factors. Further details on the rationale for fetal cardiac diagnosis and treatment, including a more detailed list of indications for prenatal echocardiography, can be found in a multidisciplinary Scientific Statement from the American Heart Association ( Table 13-3 ).
| Indications With Higher Risk Profile (estimated >2% absolute risk) | Indications With Lower Risk Profile (estimated >1% but <2% absolute risk) | Not Indicated (≤1% risk) |
|---|---|---|
| Maternal pregestational diabetes mellitus Diabetes mellitus diagnosed in the first trimester Maternal phenylketonuria (uncontrolled) Maternal autoantibodies (SSA/SSB + ) Maternal medications ACE inhibitors Retinoic acid NSAIDs in third trimester Maternal first trimester rubella infection Maternal infection with suspicion of fetal myocarditis Assisted reproductive technology CHD in first-degree relative of fetus (maternal, paternal, or sibling with CHD) First- or second-degree relative with disorder with mendelian inheritance with CHD association Fetal cardiac abnormality suspected on obstetric ultrasound Fetal extracardiac abnormality suspected on obstetric ultrasound Fetal karyotype abnormality Fetal tachycardia or bradycardia, or frequent or persistent irregular heart rhythm Fetal increased NT >95% (≥3 mm) Monochorionic twinning Fetal hydrops or effusions | Maternal medications Anticonvulsants Lithium Vitamin A SSRIs (only paroxetine) NSAIDs in 1st/2nd trimester CHD in second-degree relative of fetus Fetal abnormality of the umbilical cord or placenta Fetal intra-abdominal venous anomaly | Maternal gestational diabetes mellitus with HbA 1c <6% Maternal medications SSRIs (other than paroxetine) Vitamin K agonists (Coumadin), although fetal survey is recommended Maternal infection other than rubella with seroconversion only Isolated CHD in other than first- or second-degree relative |
Timing of Fetal Echocardiogram.
The timing of the first fetal echocardiogram depends on the study indication. For most practitioners and programs, fetal echocardiography is easily performed after 18 weeks’ gestation. There are many reports, however, of fetal echocardiography performed at 13 to 18 weeks with accurate results, although this option is not offered in all programs. When there is a structural anomaly suspected on screening ultrasound images, fetal echocardiography should be performed shortly after to provide early counseling. When fetal echocardiography is indicated because of increased risk secondary to another condition (e.g., family history, maternal diabetes mellitus), recommendations are generally for fetal echocardiography to be performed at 18 to 22 weeks. It still should be kept in mind that some lesions progress over the course of the pregnancy, and the abnormality may be more evident later in gestation.
Fetal Echocardiography Views.
Specific components of the fetal echocardiogram as recommended by the American Heart Association 2014 guidelines are listed in Table 13-4 . Evaluation in standard planes can be useful, including those listed earlier for cardiac screening (see Fig. 13-14 ), along with the following additional views (see Fig. 13-15 ): (1) the bicaval view, (2) long-axis view of the aortic arch, (3) long-axis view of the ductal arch, (4) high short-axis view—great arteries, and (5) low short-axis view—ventricles. Details of these views are listed next. In addition to gray-scale imaging in all views, color and spectral Doppler are performed. Sweeps of the heart allow anatomic definition of the fetal heart. Measuring cardiac structures is optional, although this step should be considered for suspected structural or functional anomalies. Reference values have been published for most fetal cardiac structures, and free gestational age–based or size-based Z-score calculators are available using published reference values. This detailed assessment may include an advanced assessment of cardiac function such as ventricular strain and myocardial performance index (MPI) measurements.
| Two-Dimensional Imaging | Rhythm Assessment | Color Flow Map Imaging | Pulsed Doppler Interrogation | Continuous Wave Doppler | Ventricular Function |
|---|---|---|---|---|---|
| Cardiac size (qualitative) Cardiac axis Cardiac position Visceral and atrial situs Systemic venous anatomy Pulmonary venous anatomy Qualitative atrial size Atrial septal morphology/localization of defect if present AV connections Tricuspid/mitral valve morphology and size Ventricular morphology, looping, size Ventricular septal morphology with description of defect if present Ventricular-arterial connections Pulmonary/aortic valve morphology and size Great artery relationship/size Aortic/ductal arch morphology Aortic/ductal relationship relative to the trachea Proximal right and left branch pulmonary arteries Pericardial or pleural effusions | Heart rate AV relationship/ rhythm Mechanical PR (AV) interval ‡ Description of AV relation including arrhythmia onset/ offset, duration ‡ | Tricuspid and mitral valves/ventricular inflows Pulmonary and aortic outflows/ ventricular outflows Aortic/ductal arches Ventricular and atrial septal flow Superior and inferior venae cavae Pulmonary veins Ductus venosus | Tricuspid and mitral inflows Pulmonary and aortic outflows Ductus venosus Pulmonary veins Umbilical vein Umbilical artery Aortic and ductal arches Superior/inferior venae cavae Branch pulmonary arteries † Middle cerebral artery Doppler † | Valvar insufficiency (if present) Ventricular outflows (if pulse Doppler abnormal) Ductus arteriosus (if pulse Doppler abnormal) | Exclusion of hydrops Exclusion of cardiomegaly Qualitative assessment of ventricular contractility Systemic venous Doppler examination * Pulmonary venous Doppler examination * Ventricular Doppler inflow examination * Right and left ventricular cardiac output * Ventricular shortening fraction * Isovolumetric contraction and relaxation time * Myocardial performance index * Cardiovascular profile score * |
| Proximal branch pulmonary arteries Umbilical vein Umbilical artery | |||||
| Tricuspid/mitral annulus diameters Atrial dimensions Ventricular length and width Pulmonary and aortic valve annulus diameters Main pulmonary artery and ascending aorta diameters Ductus arteriosus diameter Aortic transverse arch diameter Cardiothoracic ratio measurement * Branch pulmonary artery diameters † |
* Elements that can be used for assessment of a known/suspected cardiac function abnormality.
† Additional elements for which usefulness is not well established but which may be considered (class IIb).
‡ Required elements (class I) for a known/suspected rhythm abnormality or if indication for examination relates to potential for rhythm abnormality.
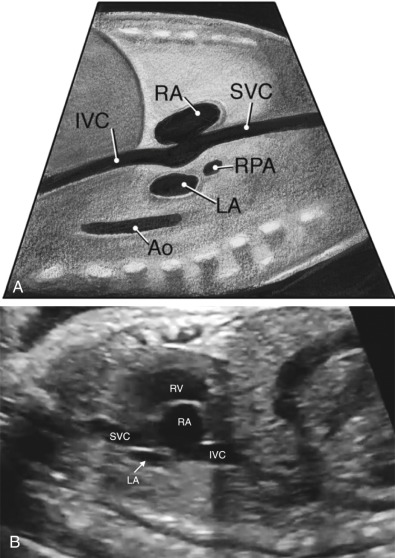
Plane 7: Bicaval View.
The bicaval view is obtained by sagittal imaging of the fetal chest, just to the left of midline ( Fig. 13-28 and ). This view confirms that the suprahepatic portion of the inferior vena cava is intact (may be interrupted in heterotaxy) and that a right superior vena cava is present. This view is also the best view to visualize the foramen ovale. Color Doppler should be used to assess the direction of flow across the foramen ovale, which is normally from the RA to the LA, but may be left to right in cases of HLHS.
Plane 8: Long-Axis View of the Aortic Arch.
The long-axis view of the aortic arch, or “candy-cane” view, is obtained by sagittal imaging of the fetal thorax and angling slightly leftward ( Fig. 13-29 and ). It can also be obtained by aligning the transverse arch with the ultrasound beam in the 3VT view and turning the probe 90 degrees. The arch should be assessed for hypoplasia or coarctation, and measurements can be performed and compared with the normal range for age. Flow should be toward the descending aorta. Reversal of flow in the arch indicates that the ductus arteriosus is supplying some of the flow to the head and upper extremities circulation and may be seen when there are hypoplastic left-sided structures or an atrial septal aneurysm obstructing mitral valve inflow.

Plane 9: Long-Axis View of the Ductal Arch.
The long-axis view of the ductal arch, or “hockey stick” view, is usually accomplished by obtaining a direct sagittal view of the fetal thorax, just left of center ( Fig. 13-30 ). The ductus should be assessed for restriction and direction of flow. By spectral Doppler, a restrictive ductus arteriosus typically has a peak velocity greater than 2.0 m/second and an abnormal flow pattern with continuous flow. Continuous high-velocity flow is also usually evident by color Doppler imaging. Flow reversal in the ductus arteriosus is present with severe right-sided obstructive lesions, such as severe pulmonary stenosis or pulmonary atresia.

Plane 10: High Short-Axis View—Great Arteries.
Imaging in cross section of the heart can be very useful in assessing the outflow tracts, the ventricular septum, function, and AV valve anatomy. The first short-axis view is the high short-axis view, which demonstrates the aortic valve en face, surrounded by the pulmonary artery wrapping around the aorta ( Fig. 13-31 and ). The proximal branch pulmonary arteries can also be seen bifurcating, and the tricuspid valve is well seen in this view. The high short-axis view is best for demonstrating RVOT obstruction and for differentiating types of VSDs that involve the outlet portion of the ventricular septum. Tricuspid regurgitation can also be assessed from this view.

Plane 11: Low Short-Axis View—Ventricles.
The low short-axis view is the best view to assess ventricular function and to evaluate for muscular VSDs ( Fig. 13-32 and ). As muscular VSDs are often very small, the use of color Doppler to show flow across the septum is usually necessary to detect or confirm these defects. The AV valve morphologic appearance can be assessed as well, including detection of a common AV valve or mitral valve cleft.

Assessment of Cardiovascular Function.
Detailed functional assessment should be performed if cardiac function appears impaired. The assessment of cardiac function in the fetus can be complex. In an effort to standardize the assessment of cardiovascular function, Huhta and colleagues developed the Cardiovascular Profile Score (CPS), a scoring system that incorporates cardiac and extracardiac aspects of fetal cardiovascular function. Figure 13-33 details the five categories of the CPS (hydrops, umbilical venous Doppler, heart size, abnormal myocardial function, and arterial Doppler), each worth 2 points, for a total score of 10. A lower value signifies worsened cardiovascular function, although a discrete cutoff point for predicting poor fetal outcome has varied between studies, from lower than 6 to lower than 10.

Cardiac output (CO) can be estimated by echocardiography using the following formula:
where VTI = velocity time integral of flow across that semilunar valve, D = diameter of the semilunar valve, and HR = heart rate. In the fetus, because of the parallel circulation physiology, aortic cardiac output can be added to pulmonary cardiac output to arrive at an estimated combined cardiac output (CCO). Fetal estimates of CCO have correlated with cardiovascular profile score in high cardiac output lesions such as sacrococcygeal teratoma and with worse outcomes in twin-twin transfusion syndrome.
The MPI, or Tei index, is a commonly used and extensively studied measure of fetal cardiac function. The MPI is obtained by measuring the AV valve closure to opening time (systole) and the semilunar valve ejection time. The ejection time is then subtracted from the AV valve closure to opening time in order to arrive at the sum of isovolumetric contraction and isovolumetric relaxation times. This sum is then divided by the ejection time ( Fig. 13-34 ). Normal values of the MPI change slightly throughout gestation. Generally, values less than 0.43 to 0.45 are considered to be normal. Elevations of MPI values reflect alternations in both systolic and diastolic function.

Myocardial deformation imaging is a relatively new technique, which has begun to be applied to fetal echocardiography. Deformation refers to the degree to which myocardial tissue fibers shorten over the cardiac cycle. Discrete layers of ventricular muscle fibers oriented in longitudinal, circumferential, and radial dimensions play specific roles in the cardiac cycle. The most commonly reported measures of deformation are strain and strain rate. Strain (ε) represents the fractional change in length (L) of a myocardial segment caused by an applied force.
Strain rate represents the rate of myocardial deformation (strain per unit time). Speckle tracking echocardiography is an imaging technique that involves tracking the motion of natural acoustic markers throughout the cardiac cycle in order to calculate strain and strain rate. Deviations of the angle of interrogation are overcome by this method, which makes it very attractive for fetal cardiac imaging. Furthermore, standard measures of systolic dysfunction are ominous, late findings in fetal cardiovascular disease, thus making a more sensitive measure of diminished contractility appealing. However, the small fetal heart mass and fast heart rate pose significant challenges to applying existing myocardial deformation technology. In order to reduce undersampling throughout the cardiac cycle, optimal temporal resolution (high frame rate) and optimal spatial resolution are required. Despite these concerns, multiple studies have reported successfully tracking the fetal heart and have reported normal strain and strain rate values at various gestational ages.
Within the past few years, there have been studies of differences in myocardial deformation values between normal fetuses and those with CHD, those exposed to maternal diabetes, those with growth restriction, and those with twin-twin transfusion syndrome. Although concerns for reproducibility and uncertainty about the actual added clinical benefit of myocardial deformation imaging currently limit its clinical use, it is a promising technique for the assessment of fetal cardiac function.
3D and 4D Fetal Cardiac Evaluation
3D sonography can be used evaluate the anatomy of the heart, but does not incorporate time. 4D technology has been developed that allows 3D evaluation of the fetal heart plus the aspect of time as the fourth dimension. Spatiotemporal image correlation (STIC) is a feature of 4D sonography that allows the acquisition of volume datasets akin to blocks of pathologic specimens, in which all the anatomic information is contained in the block and the information displayed depends on the level at which the block is cut. STIC has the additional advantages that these planes can be assessed in a virtual beating heart, that fetal electrocardiographic triggering is not needed, and that rendering techniques can be used to gain additional insight into the structure and function of the fetal heart.
With the use of STIC, volume datasets from fetal heart are acquired with a single automated sweep of the transducer, and spatial and temporal information is combined to display images that can be extracted from volume datasets. Thus, standardized planes for fetal echocardiography can be obtained from the volume datasets at the time of the sonographic examination or afterward; moreover, novel planes to examine the fetal heart can also be obtained including coronal views. In addition to this anatomic information, functional information of the fetal heart can be obtained including the direction of blood flow if the volume dataset was obtained with color Doppler or high definition (HD) power Doppler.
Several studies suggest that 4D sonography facilitates examination of the fetal heart. Thus, 4D fetal echocardiography has the potential to reduce the operator dependency of 2D sonography. Prenatal diagnosis of CHDs is challenging because of the complexity of the fetal heart and the expertise required in performing fetal echocardiography. In addition, fetal and maternal motion, maternal body mass index, gestational age, adequacy of the amniotic fluid volume, and fetal position are important factors that can affect image quality. This section of the chapter reviews some technical aspects of 4D sonography including volume acquisition and rendering, displays modalities in 4D sonography, and summarizes the evidence evaluating the accuracy and reproducibility of 4D sonography in the prenatal diagnosis of CHDs.
Acquisition of Volume Datasets With 4D Sonography and STIC
Volume Acquisition With Mechanical Transducers.
Volume acquisition is performed with an automated sweep of the transducer, acquiring sequential frames at a rapid rate. Acquisition time ranges from 5 to 15 seconds; the longer the acquisition time, the better the spatial resolution. During acquisition, on the basis of changes in the cardiac motion, the STIC algorithm detects the FHR and synchronizes 2D images. Frames acquired during the same phase in the cardiac cycle are merged into one volume dataset representing approximately 40 volumes. After analysis and rearrangement the dynamic images are displayed on the screen in three planes that are orthogonal to each other.
The image quality contained in a STIC cardiac volume dataset can be improved by optimizing the settings before acquisition by adjusting the 2D gray-scale and color Doppler parameters. Our preference is to use low persistence, high contrast, and high frame rate settings. Typical acquisition time ranges from 5 to 15 seconds. Shorter acquisition times can be used to minimize motion artifacts but this reduces the image spatial resolution.
Volume Acquisition With Matrix Array Technology.
Matrix array transducers utilize several thousand elements and have eliminated the need for internal moving parts. Each element fires an ultrasound beam that is used to create a pyramidal group of ultrasound voxels, with an opening angle between 6 and 100 degrees. This allows real-time 4D imaging that does not require mechanical translation of the ultrasound transducer. Additionally, the large aperture in the elevation plane provides for superior resolution. Volume dataset acquisition with mechanical transducers relies on approximately 40 volume datasets to reconstruct a virtual volume. In contrast, the 4D volume dataset obtained with matrix transducers divides the volume into four subvolumes. Acquisition of a spatially and temporally correlated volume takes approximately 25% of the time that is required using a mechanical transducer. Typically, STIC acquisitions take about 5 to 15 seconds, during which time the fetus may move and affect the quality of volume acquired. With matrix array technology, the volume acquisition takes about 3 seconds with less motion artifact in addition to increased spatial and temporal resolution. Hence, the real-time data acquisition is less prone to artifact from fetal movement and maternal respiratory motion.
Display Modalities in 4D Sonography and STIC
2D sonography relies on standard anatomic views of the fetal heart, as described previously. Acquisition of these views can be facilitated using different display modalities of 4D sonography.
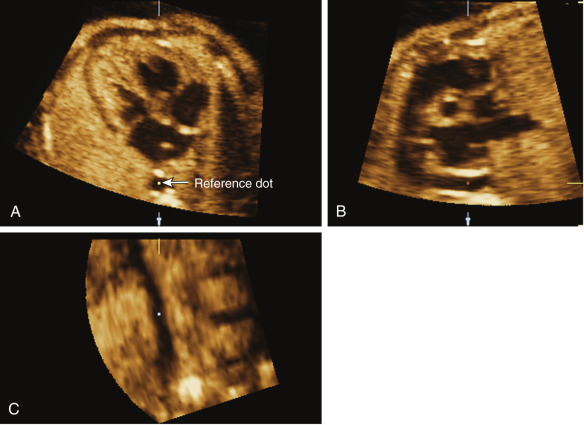
Dynamic Multiplanar Display.
This modality in 3D and 4D sonography allows for the simultaneous display of three anatomic planes that are orthogonal to each other: the transverse, sagittal, and coronal planes. Moreover, an imaging tool referred to as the reference dot allows for the identification of anatomic structures in these three orthogonal planes ( Fig. 13-35 ). This display modality can also be used to scroll through the volume dataset to visualize the transverse view of the upper abdomen, four-chamber view, five-chamber view, and the 3VV. For example, in cardiac rhabdomyomas, the transverse plane allows visualization of the cardiac tumor in the four-chamber-view, whereas the sagittal and coronal planes reveal additional smaller tumors that are not seen in the axial plane ( Fig. 13-36 ). One approach is to display the standard transverse view used in fetal cardiac evaluation in panel A, to place the dot in the abnormal vascular structure, and to identify the structure in the sagittal and coronal planes in panels B and C ( Fig. 13-37 ).


Novel algorithms using the multiplanar display have been proposed for simultaneous display of both outflow tracts, to visualize the aortic and ductal arches, and to determine the nature of vascular connections to the fetal heart using the spin technique. The latter technique involves positioning the reference dot in the center of the structure and “spinning” the volume dataset around the y-axis to determine its spatial relationship with the heart and other vascular structures.
The sagittal view of the ductal arch can be easily obtained using 4D volume datasets of the fetal heart acquired with STIC ( Fig. 13-38 ). A retrospective study using this approach reported that the visualization rate of the sagittal view of the ductal arch was significantly lower in fetuses with conotruncal anomalies than among normal fetuses and those with other CHDs. The authors concluded that the inability to visualize the ductal arch using the proposed algorithm should raise the possibility of conotruncal anomalies.

Automated Display of Multiple Slices.
This modality allows for the simultaneous display of up to eight parallel planes whose distance can be adjusted for better visualization of anatomic planes. Tomographic ultrasound imaging (TUI) (GE Healthcare, Milwaukee, WI) allows the visualization of multiple sections of a beating heart at the same time. An overview image, which is shown on the upper left corner, shows a plane orthogonal to the slices, and parallel lines demarcate the position of the slices within the volume dataset ( Fig. 13-39 ). However, the simple use of planes parallel to the four-chamber view of the heart does not allow for the visualization of the long-axis view of the left outflow tract and the short-axis view of the aorta, which are considered part of an integral examination of the fetal heart. An algorithm using TUI with STIC was developed that allows for the simultaneous visualization of the standard planes for fetal cardiac screening including the four-chamber view, 3VV, long-axis view of the left outflow tract, and short-axis view (right outflow tract) in most fetuses without CHDs. With the use of this algorithm a normal four-chamber view, five-chamber view, longitudinal view of the ductal arch, 3VT view, view of the left outflow tract, and short-axis view were visualized in 99%, 96.9%, 98.5%, 88.2%, 93.3%, and 87.2% of the volume datasets, respectively. Similar results were recently reported by Rizzo and associates using STIC and a simplified method referred to as the “three-step technique.” Other algorithms designed to evaluate the fetal heart using multiplanar display includes the Four-chamber view And Swing Technique (FAST) echo and Fetal Intelligent Navigation Echocardiography (FINE) techniques.

Rendering Techniques in 4D Sonography and STIC
Several rendering algorithms have been described for visualization of the fetal cardiovascular structures.
Inversion Mode.
This mode transforms echolucent structures into solid structures. Thus, anechoic structures such as the heart chambers, lumen of the great vessels, stomach, and bladder appear echogenic on the rendered image, whereas structures that are normally echogenic become anechoic. Postprocessing adjustments are performed as necessary, including adjustments of the gamma curve, threshold, and transparency to improve image quality. The technique allows examiners to obtain 4D rendered images of cardiovascular structures from volume datasets acquired with gray-scale only. For example, the value of this display modality can be observed in the visualization of a dilated azygous vein in a case of interrupted IVC in heterotaxy complex ( Fig. 13-40 ).

Transparency Modes.
The minimum projection mode (MPM) is another volume-rendering tool that allows preferential display of minimum gray-scale values within a volume dataset. This algorithm can be useful for displaying vascular structures and fluid-filled organs. The MPM can provide important insight into the spatial relationships of abnormal vascular connections to the fetal heart in the upper mediastinum and could potentially be useful in the determination of atrial morphologic features in cases of left and right isomerism.
B-Flow Rendering.
This 4D display modality enhances signals from weak blood reflectors from vessels and, at the same time, suppresses strong signals from surrounding tissues. Because this technology does not rely on Doppler methods to display blood flow, it is angle-independent and does not interfere with the frame rate. This modality is potentially advantageous over color or power Doppler imaging when used in conjunction with STIC for the evaluation of the fetal vasculature. In B-flow imaging, the echoes from the tissue and the blood flow can be displayed with high resolution and without the overlay that characterizes color Doppler imaging. Moreover, B-flow may have less signal dropout when the ultrasound beam is perpendicular to the vessel. B-flow imaging can provide important insight into abnormal vascular connections to the fetal heart including TAPVC ( Fig. 13-41 ) and tortuous aorta in cases of coarctation ( Fig. 13-42 ).


Accuracy and Reproducibility of 4D Sonography in the Prenatal Diagnosis of Congenital Heart Disease
The accuracy and reproducibility of 4D sonography with STIC in the diagnosis of CHDs were recently evaluated in two multicenter studies in the second trimester of pregnancy. One cross-sectional study included seven international centers with expertise in 4D sonography where fetuses with and without confirmed heart defects were scanned between 18 to 26 weeks’ gestation and their volume datasets were uploaded onto a centralized FTP (file transfer protocol) server. The authors reported that the median (range) sensitivity, specificity, and positive and negative predictive values as well as false positive and false negative results for the identification of fetuses with CHDs were as follows: 93% (77%-100%), 96% (84%-100%), 96% (83%-100%), 93% (79%-100%), 4.8% (2.7%-25%), and 6.8% (5%-22%), respectively. Moreover, there was excellent intercenter agreement (kappa statistic = 0.97) in the identification of CHDs. The authors concluded that 4D volume datasets can be remotely acquired and accurately interpreted by different centers and that among centers with technical expertise 4D sonography is an accurate and reliable method for fetal echocardiography. However, 10% of volume datasets have limited clinical value because the image quality was not adequate, the volume dataset did not include sufficient anatomic information, or image artifacts limited the visualization of the anatomic structures. Of note, the median time required to upload or download each volume dataset into the centralized FTP server was 2 minutes (range: 1-3 minutes), and the median time required to analyze each volume dataset was 6 minutes (range: 2-15 minutes). Similarly, in another study involving 167 normal fetuses and 175 fetuses with CHDs the authors reported that the sensitivity, specificity, and positive and negative predictive values of 4D sonography with STIC in the identification of CHDs were 91.6%, 94.9%, 88.1%, 89.7%, and 94.0%, respectively. Two different sonographers with expertise in 4D sonography read the volume datasets in a blinded fashion and agreed in the final diagnosis in 74% of the cases. However, in a different report the same authors reported good or excellent intraobserver and interobserver agreement in the identification of fetal cardiac structures using 4D sonography and STIC in all trimesters of pregnancy.
One study evaluated if 3D and 4D sonography can improve the ability of 2D sonography in the identification of CHDs. The authors compared 2D cine loops and 4D volume datasets from 181 fetuses with CHDs. The authors reported that with different 4D rendering modalities 12 CHDs were identified by 3D/4D sonography but not by 2D cine loops. These cases included one case of right aortic arch with anomalous branching, one case of TGA with pulmonary atresia, one case of segmental interrupted aortic arch, one case of RV aneurysm, two cases of total anomalous pulmonary venous connections (TAPVCs), and four cases of VSDs.
First and Early Second Trimester 4D Fetal Echocardiography
A 2014 study evaluated the role of 4D sonography in the identification of CHDs between 11 and 15 weeks of gestation. The study included 48 volume datasets from fetuses with normal ( n = 17) and abnormal ( n = 16) hearts. Overall, the median (range) accuracy, sensitivity, and specificity, as well as the positive and negative likelihood ratios, for the identification of fetuses with CHDs were 79% (77-83%), 90% (70-96%), 59% (58-93%), 2.35% (2.05-9.8%), and 0.18% (0.08-0.32%), respectively. Of note, there was only a moderate intercenter agreement (kappa = 0.6); and between 15% and 23% of volume datasets were considered to have limited clinical value because the image quality was not adequate, the volume dataset did not include sufficient anatomic information, or image artifacts limited the visualization of the anatomic structures. Moreover, participating centers with lower diagnostic indices reviewed a higher proportion of suboptimal volume datasets than those with higher diagnostic indices. The authors concluded that 4D sonography can be performed in the first trimester and early second trimester of pregnancy and that 4D volume datasets obtained from fetuses between 11 and 15 weeks can be remotely acquired and accurately interpreted by different centers. These results are in keeping with a 2008 report indicating that standardized planes for fetal echocardiography can be obtained from 4D volume datasets obtained in the first trimester of pregnancy in a reproducible manner and with a 2009 report indicating that 4D fetal echocardiography in the first trimester can identify CHDs with 95.3% accuracy.
The median sensitivity (90%) of 4D first trimester fetal echocardiography for the identification of CHDs reported in the multicenter study is comparable with the results of a study done at a single institution. However, the median specificity (59%) is lower than previously reported. This may be a reflection of moderate intercenter agreement. The observation that in almost one fifth of the cases 4D volume datasets had limited clinical value appears to be a reflection of the challenges of 4D first trimester fetal echocardiography due to frequent fetal motion, the size of the cardiac structures, and the frequent need to rely on color Doppler imaging to evaluate these structures. However, in many instances the anatomic information contained in these volume datasets was sufficient to differentiate normal from abnormal cases and to diagnose the specific CHD.
The evidence reviewed in this section indicates that 4D fetal echocardiography with STIC can facilitate the examination of the fetal heart with the use of multiple display and rendering modalities. Moreover, 4D sonography appears to be an accurate and reproducible technique for the identification of CHDs in the second trimester of pregnancy. The initial reports on the value of 4D sonography in the first trimester and early second trimester of pregnancy are promising. However, larger studies are required to confirm these results. Another important area for research is the evaluation of 4D sonography in the screening of CHDs as well as the use of automated or semiautomated algorithms using 4D sonography and STIC in the screening and diagnosis of CHDs. The practical application of STIC for fetal cardiac screening, versus a role better suited to a specialized echocardiographic procedure, requires further investigation in the context of emerging technologies.
Fetal Cardiovascular Disease
Overview
Epidemiology.
Fetal cardiovascular disease most commonly consists of structural heart disease, fetal arrhythmias, or secondary heart disease, but also includes fetal myocarditis and cardiomyopathy, pericardial effusions, and cardiac tumors. The prevalence of fetal cardiovascular disease is unknown and difficult to ascertain. Given that some fetuses with CHD do not survive to term, it is suspected that the prevalence of CHD in the fetus is significantly higher than the liveborn estimate of 6 to 10/1000, although this topic has not been extensively studied.
Etiology.
The cause of CHD is unknown in most cases, but is clearly multifactorial. Maternal exposures that have been associated with CHD include environmental (dioxins, polychlorinated biphenyls, pesticides), ingested (alcohol, isotretinoin, thalidomide), and infectious (rubella). Maternal fever alone, regardless of the cause, has also been implicated in CHD, as has the increasingly prevalent health conditions of obesity and diabetes.
There are genetic influences on development of CHD, both inherited and sporadic. A large number of syndromic disorders are associated with CHD, and genetic disorders have also been shown to be associated with isolated CHD ( Table 13-5 ). Genetic disease with CHD may be due to aneuploidies, such as Down syndrome or Turner syndrome; may result from chromosomal deletions, such as chromosome 22q11.2 deletion; or may be secondary to a single DNA base mutation that causes abnormal protein transcription, such as Alagille syndrome due to a JAG1 mutation. Given the frequent associations between CHD and genetic disorders, many advocate that genetic evaluation should be performed in any fetus or child with CHD.
| Condition | Cardiovascular Findings |
|---|---|
| Turner syndrome (monosomy X) | Left-sided disease: hypoplastic left heart syndrome, bicuspid aortic valves, coarctation of the aorta Systemic venous anomalies: absence of the ductus venosus, left superior vena cava Pulmonary venous anomalies: partial anomalous pulmonary venous return |
| Down syndrome (trisomy 21) | Atrioventricular canal defect Atrioventricular canal defect with tetralogy of Fallot Isolated ventricular septal defect |
| 22q11.2 deletion | Tetralogy of Fallot Truncus arteriosus Double-outlet right ventricle Pulmonary atresia with ventricular septal defect Right aortic arch Aberrant right or left subclavian artery Double aortic arch |
| Edwards syndrome (trisomy 18) | Atrial septal defect Ventricular septal defect Polyvalvar disease |
| Patau syndrome (trisomy 13) | Atrial septal defect Ventricular septal defect Polyvalvar disease |
| Williams syndrome ( ELN mutation) | Supravalvar aortic stenosis, branch pulmonary artery stenosis, mitral valve and aortic valve disorders |
| Alagille syndrome ( JAG1 mutation) | Tetralogy of Fallot Branch pulmonary artery stenosis |
| CHARGE syndrome | Atrial septal defect Ventricular septal defect Tetralogy of Fallot |
Of note, however, at this time only a minority of CHDs can be attributed to a recognized genetic condition. The majority of infants born with CHD are born to parents with no identifiable risk factors. Therefore, despite discovered risk factors, the most important tool for detection of prenatal CHD is a high-quality second trimester ultrasound examination.
Neurodevelopmental Outcomes.
Over the last 30 years, there have been significant advances in understanding neurodevelopment sequelae in children with CHD. Although the vast majority of nonsyndromic children with CHD do not have severe neurodevelopmental impairments, children who have undergone cardiac surgery are more likely to have neurodevelopmental abnormalities than children without cardiac disease. A 23% incidence of structural brain abnormalities has been identified by fetal MRI in children with complex forms of CHD as compared to normal control subjects (<2%). Owen and colleagues have also reported impaired brain volume growth before cardiac surgery in infants with CHD. Given that prenatal diagnosis has been shown to improve the preoperative status of newborns with critical CHD, prenatal coordinated multidisciplinary care and possibly early interventions may result in improved neurodevelopmental outcomes.
Congenital Heart Lesions
This section highlights the anatomy and imaging pearls of the most common CHDs. Detection of these lesions can most easily be accomplished by use of sweeps through the heart that are centered on the key views listed earlier.
Ventricular Septal Defect
Definition.
A VSD is a communication between the RVs and LVs. There are several types of VSDs and multiple names for the same lesion, depending on nomenclature used ( Table 13-6 ). The Congenital Heart Surgery Nomenclature and Database Project addressed this topic, simply classifying VSD types as types 1 through 4. For the purposes of this chapter, the Van Praagh classification will be used.
| Congenital Heart Surgery Nomenclature and Database Project | Van Praagh | Anderson | Other |
|---|---|---|---|
| Type I | Conalseptal | Doubly committed juxtarterial or Muscular—outlet or infundibular | Supracristal Infundibular Juxtarterial Conal Right ventricular outlet Subarterial |
| Type II | Conoventricular—membranous type or Conoventricular—malalignment type | Perimembranous—outlet | |
| Type III | Atrioventricular canal type | Perimembranous—inlet * | Inlet |
| Type IV | Muscular | Muscular—trabecular or Muscular—inlet |
* Unless defect is associated with an endocardial cushion defect, in which case it would not be included in VSD classifications.
Epidemiology.
When excluding the residual fetal structures PFO and PDA, VSDs represent the most common type of CHD. The birth prevalence of VSD has been increasing over the last several decades, and in recent series it is approximately 300/100,000. The increase over time appears to be primarily due to nonsurgical perimembranous and muscular defects. Given this, there has been speculation that the increase in VSDs is at least in part due to improved cardiovascular imaging.
Anatomy.
The various potential locations of VSDs as seen from the right ventricular side of the ventricular septum are displayed in Figure 13-43 . Membranous types of conoventricular VSDs (more commonly referred to simply as membranous VSDs, Fig. 13-44 ) are bordered by the aortic valve and the tricuspid valve and are one of the most common types of VSD. Malalignment type of conoventricular VSDs (commonly referred to as conoventricular VSDs) are also bordered by the tricuspid and aortic valves, but the conal septum is either anteriorly or posteriorly deviated, resulting in overriding of the aorta or of the pulmonary artery, respectively ( Fig. 13-45 ). Anteriorly malalignment defects are the type most commonly seen in TOF, and posterior malalignment defects are most commonly seen with interrupted aortic arch.

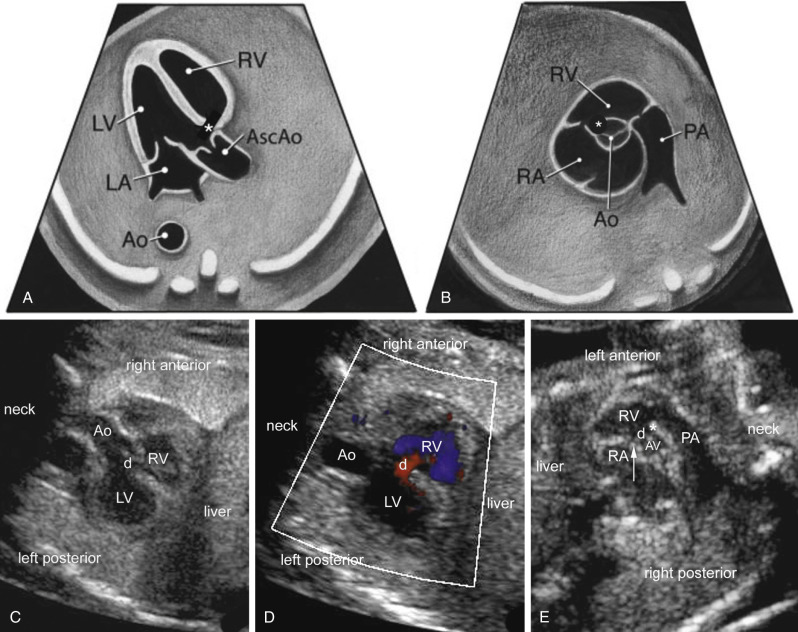

Defects that are in the trabecular septum are termed muscular VSDs ( Fig. 13-46 and ), which may be further described as apical, midmuscular, posterior, and anterior. Muscular VSDs are the most common type of VSD. Defects in the inlet septum that borders both AV valves are called AV canal type VSDs (perimembranous inlet type by Anderson terminology, Fig. 13-47 ).
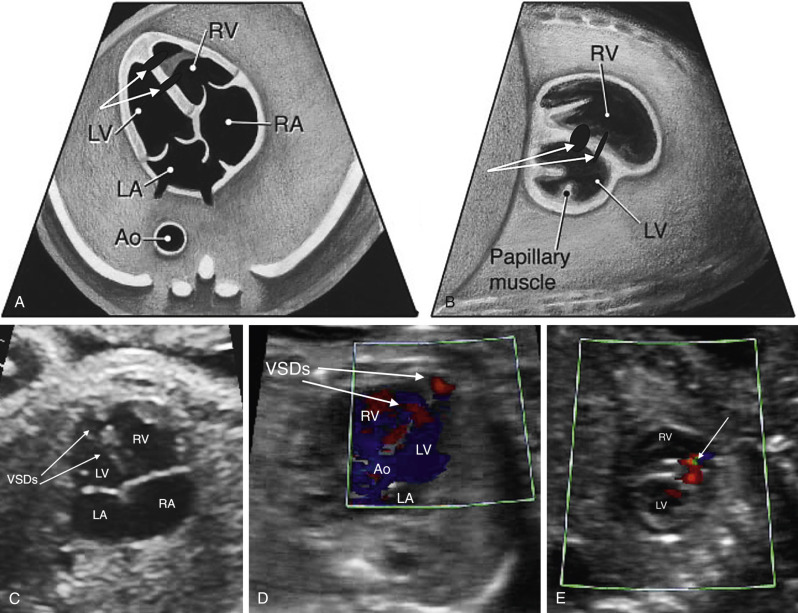

Conalseptal defects ( Fig. 13-48 ) are the least common and are present when the septum between the RVOT and the LV is incomplete. These defects often are bordered by both the pulmonary valve annulus and the aortic annulus, hence the name given in the Anderson nomenclature is doubly committed juxtarterial . If a defect is in this region, but completely surrounded by muscular tissue (instead or bordered by a valve), it would be classified using Anderson terminology as muscular outlet VSD.

Genetic Considerations.
Genetic disorders must be considered when a VSD is noted. One study reported that among fetuses noted to have a VSD, 46% had a genetic abnormality. Of note, however, all patients except one with genetic abnormalities had an abnormal NT, were high risk for aneuploidy, or had known extracardiac defects. When broken down into those with and without risk factors, 2.5% of those with none of the previous factors had a genetic abnormality, whereas 58% of those with risk factors had a genetic disorder. Another paper showed similar findings, with only 1.2% of patients with a VSD but no extracardiac anomalies having a genetic disorder.
Particular VSD types significantly increase the risk of a genetic disorder. For example, if an AV canal type VSD is seen, one must be sure this is not a complete AVCD, which would confer an almost 50% risk of Down syndrome. If a malalignment type VSD is associated with pulmonary stenosis or a right aortic arch, the risk of 22q11.2 deletion syndrome increases substantially to as high as 25%. If polyvalvar disease is present with a VSD, the risk of trisomy 13 or 18 is very high.
Interventions and Prognosis.
A VSD typically has one of three fates. It can close spontaneously, can be closed with surgery, or can be left alone without intervention if it is not hemodynamically significant. Both muscular and membranous VSDs may close spontaneously, and this may occur in utero. Studies suggest that muscular defects close in fetal life 2% to 31% of the time, with another 19% to 75% closing in the next 12 months. An estimated 0% to 15% of muscular defects discovered in utero will require surgery. For membranous defects, studies suggest 4% to 35% of them close in fetal life, and another 1% to 23% in first 12 months, with an estimated 42% needing surgery. AV canal type VSDs, malalignment VSDs, and conalseptal defects rarely close spontaneously and will require surgical repair.
For VSDs that require intervention, in the absence of other congenital heart lesions, the procedure can usually be deferred to several months of age, although diuretic therapy may be used in the interim to improve symptoms. At present, surgical repair for pediatric VSD is the preferred therapy in most centers, although catheter-based techniques are demonstrating an improved safety profile compared to prior decades. Pulmonary artery banding is largely reserved for critically ill infants with multiple VSDs or for those with associated anomalies.
In isolation, prognosis of children with VSDs is excellent. Even if surgical repair is necessary, most pediatric cardiac surgical programs have mortality rates for VSD closure below 1%. There are potential complications of postoperative arrhythmia (~4%, usually temporary) and postoperative AV block (~1%). Patients with conalseptal defects and membranous or malalignment defects may develop aortic regurgitation or aortic dilation far beyond the surgery, so lifetime follow-up is recommended.
Diagnostic Imaging Features.
VSDs are some of the most commonly missed CHD lesions by prenatal imaging, likely because of wide variation in size and equal ventricular pressures in the fetus precluding easy observation of shunting. Medium to large VSDs can be detected in the fetus with careful imaging. Smaller defects are able to be visualized, but it can be challenging to distinguish them from artifact. In some cases, the “T-sign” may be helpful in distinguishing a true VSD from artifact, although it is not completely reliable. The T-sign refers to an area of dropout bordered by an echobright, sharp structure that represents the blunted end of the intact portion of the septum ( Fig. 13-50C ). In both early and later gestation, a combination of 2D sonography and Doppler color imaging can help identify VSDs, to optimize detection and minimize false positive diagnoses. Although large defects may be easily seen by 2D imaging, VSDs should always be confirmed by color Doppler imaging, which usually demonstrates bidirectional flow across the large defects.
Diagnostic Imaging Tips
Membranous Ventricular Septal Defect (See Fig. 13-44 )
- •
Defects are seen from many views.
- •
Aortic valve or tricuspid valve will always be in the picture as a border of the defect.
- •
If one starts from a four-chamber view, and sweeps superiorly, the defect will be seen just as the aortic valve comes into view.
- •
False positive findings are common, as the membranous septum is the thinnest part of the septum and can appear to be missing even when present. Findings should always be confirmed by color Doppler.
Conoventricular Ventricular Septal Defect (See Fig. 13-45 )
- •
Defects can exist in isolation, but are most frequently associated with other defects, specifically TOF (anterior malalignment) and interrupted aortic arch (posterior malalignment).
- •
Conoventricular VSDs frequently are associated with outflow tract obstruction and therefore warrant close evaluation of great artery size discrepancy and obstruction.
- •
There is a higher association with right aortic arch.
- •
Classically, the aorta appears to be overriding (anterior malalignment). The pulmonary artery can also appear to be overriding (posterior malalignment), which is usually associated with aortic arch hypoplasia or interrupted aortic arch.
Muscular Ventricular Septal Defects (See Fig. 13-46 and )
- •
Muscular VSDs do not border any valves.
- •
They may appear fenestrated on imaging, as some defects have a single opening on the left ventricular side and multiple openings on the right ventricular side.
Atrioventricular Canal Type Ventricular Septal Defect (See Fig. 13-47 )
- •
If the aortic valve is seen at the same time as the VSD, the defect is probably not an AV canal type VSD, or it occurs in combination with a membranous VSD.
- •
It is best diagnosed in the four-chamber view (see Fig. 13-47B ).
- •
Carefully inspect for primum ASD (four-chamber view) and common AV valve (en face imaging in the short-axis view).
- •
Defect must be seen when the AV valves are in view because they serve as borders of this defect.
Conalseptal Ventricular Septal Defect (See Fig. 13-48 )
- •
This least common VSD may be confused with a membranous VSD in some views.
- •
With this diagnosis, VSD cannot be bordered by the tricuspid valve.
- •
The defect lies close to the pulmonary valve.
- •
Short-axis imaging is best to distinguish membranous defects from conalseptal defects.
Atrioventricular Canal Defects
Definition.
An atrioventricular canal defect (AVCD) is also known as an atrioventricular septal defect (AVSD) or an endocardial cushion defect. For this section, AVCD terminology will be used. This cardiac malformation has a septum primum atrial septal defect (ASD), an AV canal type VSD, and an abnormal common AV valve, usually composed of five leaflets ( Fig. 13-49 and ). The defect is an anomaly of the crux of the heart resulting in an ASD in the atrial septum near the AV valves and a VSD in the inlet ventricular septum. There is failure of the common AV valve to be septated by the endocardial cushions. The common AV valve has a single annulus that connects both atria and ventricles. The common AV valve crosses both ventricles at the same level at the crux of the heart resulting in the absence of the normal AV valve offsetting.


Epidemiology.
AVCD accounts for 4% to 5% of infants with CHD and occurs in 0.19 to 0.35 per 1000 live births. In a large prospective study of fetal CHD, AVCD was the most common cardiac diagnosis and was found in 18% of abnormal fetal hearts. In AVCD, the four-chamber view is diagnostic given that the ASD, VSD, and common AV valve are evident ( Fig. 13-50 ).

 weeks of gestation is shown by two-dimensional ( C ) and color Doppler ( D ) imaging. ant, anterior; Ao, aorta; DAO, descending aorta; desc ao, descending aorta; LA, left atrium; LV, left ventricle; PE, pericardial effusion; post, posterior; RA, right atrium; RV, right ventricle; vsd, ventricular septal defect.
 Because the dextrodorsal conus cushion contributes to the right AV valve development and the outflow tracts, AVCD may be associated with conotruncal anomalies such as TOF and DORV. Complete AVCD and variations of AVCDs with TOF can be seen in trisomy 21 patients. Unbalanced AVCD occurs when the AV valve connection is shifted primarily toward one ventricle and the contralateral ventricle has hypoplasia. AVCD also occurs in heterotaxy syndrome and is more common in asplenia (bilateral right atrial isomerism) than in polysplenia (bilateral left atrial isomerism).
Anatomy.
AVCD defines a group of cardiac defects resulting from an abnormal development of the endocardial cushions during cardiogenesis. Failure of the endocardial superior and inferior cushions to fuse results in a defect in the inferior atrial septum and the inlet ventricular septum. There is a common AV valve with the left and right components of the common AV valve attaching at the same septal insertion level. The inferior displacement of the left component of the common valve results in the absence of the normal offsetting of the AV valves. The distance from the crux of the heart to the apex is foreshortened and the distance from the apex to the aorta is increased and results in an elongated LVOT with the aorta anteriorly displaced. The aorta is “sprung” and is not normally wedged between the two AV valves. The elongated, narrowed LVOT has the appearance of a “goose neck.” The narrowed LVOT and abnormal attachment of the anterior bridging leaflet to the ventricular septum can result in subaortic stenosis and LVOT obstruction after surgical repair.
A complete AVCD is characterized by a large primum ASD and AV canal type VSD, with the common AV valve positioned between both defects. The ostium primum ASD is located anterior and inferior to the fossa ovalis and adjacent to the AV valves. An AVCD is classified by the morphologic features of the anterior (sometimes called superior) bridging leaflet as described by Giancarlo Rastelli. In type A, which is the most common, the anterior bridging leaflet inserts entirely on the anterosuperior rim of the ventricular septum. Type B is the least common, and the anterior bridging leaflet is larger and straddles the ventricular septum with chordal attachments along the right ventricular septum or moderator band. Type C has an anterior bridging leaflet that is not attached to the ventricular septum and has chordal attachments to the right anterior papillary muscle. The type C anterior bridging leaflet is described as a “free-floating” leaflet with no septal chordal attachments and it “floats” over the VSD. The papillary muscles in AVCD are rotated counterclockwise. The papillary muscles may be closely positioned or fused as a single papillary muscle.
An incomplete or partial form of AVCD occurs when both the anterior and posterior (sometimes called inferior) bridging leaflets have dense septal attachments to the crest of the ventricular septum, which results in no VSD. There is a large primum ASD but no VSD ( Fig. 13-49B and C, Fig. 13-51 , and ). The AV valves are at the same level with a common, single AV valve annulus, but there are two separate orifices due to a tongue of AV valve tissue centrally connecting the superior and inferior bridging leaflets. The left AV valve component has a cleft in the anterior leaflet, which is directed toward the middle portion of the ventricular septum. A “transitional” AVCD is similar to the incomplete AVCD but the chordae are less dense and there is a restrictive VSD or multiple small VSDs.

When the AV valve is equally connected to both ventricles, the AVCD is balanced. An unbalanced AVCD occurs when the AV inlet is primarily committed to one ventricle ( ). Unbalanced AVCDs account for about 10% of all AVCDs. Approximately two thirds of unbalanced AVSDs are RV dominant with more than half of the common AV valve committed to the RV. In RV-dominant AVCD, the LV is hypoplastic, and there are frequently LVOT obstruction, aortic valve hypoplasia, and aortic arch anomalies such as coarctation of the aorta. In LV-dominant AVCD, the RV is hypoplastic, and there are associated RVOT obstruction and pulmonary stenosis or atresia. In trisomy 21 patients with an unbalanced AVCD, the LV-dominant type is common.
Genetic Considerations.
Approximately 40% to 45% of children with trisomy 21 have congenital cardiac anomalies. Of children with trisomy 21 and heart disease, about 45% have an AVCD. Of the patients with AVCD, more than 75% have trisomy 21. Thus, in the prenatal diagnosis of AVCD, trisomy 21 should be high in the differential diagnosis. A common atrium with an absent atrial septum and common AV valve and no VSD is associated with Ellis–van Creveld syndrome, an inherited condition with an autosomal recessive pattern of inheritance.
Interventions and Prognosis.
Incomplete or partial AVCD has the physiology of a large ASD and because there is no ventricular component, these patients undergo surgical repair in the first 2 years of life to patch the ASD and repair the cleft in the left anterior AV valve leaflet. The morbidity and mortality rates are very low in this lesion. Left residual AV valve regurgitation may be a chronic problem and is more commonly seen in children repaired after 4 years of age.
Over the last several decades AVCD has become one of the most successfully repaired congenital heart anomalies. The Pediatric Heart Network recently reported an overall 1-month mortality rate of 2.5% and a 6-month mortality rate of 4%. In complete AVCD, a residual ASD or VSD was common at 1 month but at 6 months only 1% had a residual VSD of significance. Late operations occurred in approximately 20% of complete AVCD patients and include repair of residual AV valve regurgitation (most often the left AV valve), AV valve stenosis, LVOT obstruction, and residual VSD. The most common reason for a subsequent surgery is moderate to severe residual left AV valve regurgitation, which may be repaired but in some cases requires replacement.
Diagnostic Imaging Features.
All types of AVSD (see Figs. 13-50 and 13-51 and ) have the following features:
- •
AV valve leaflets insert at the same level at the cardiac crux.
- •
Cleft in the left AV valve component is directed toward the ventricular septum.
- •
Aorta is unwedged and anteriorly displaced.
- •
LVOT is elongated.
- •
Primum ASD is located anteroinferior to the margin of the fossa ovalis.
- •
LV papillary muscles are rotated counterclockwise.
- •
Large AV canal type VSD.
- •
Common AV valve crossing between the large ASD and large VSD.
- •
Unbalanced AVC when the common AV is committed primarily to one ventricle. Given this possibility, examination should include evaluation of the contralateral hypoplastic ventricle for outflow tract and distal semilunar valve obstruction. In RV-dominant AVC, evaluation for aortic arch obstruction is required.
- •
No VSD.
- •
Common AV valve with a connecting tongue of AV valve tissue creates two separate orifices in the single AV valve annulus.
- •
The left AV valve component has a cleft in the anterior leaflet, which is directed toward the middle portion of the ventricular septum ( Fig. 13-51C ).
- •
Small, restrictive VSD.
- •
Common AV valve with a connecting tongue of AV valve tissue creates two separate orifices in the single AV valve annulus.
Tetralogy of Fallot and Pulmonary Atresia With Ventricular Septal Defect
Definition.
In 1671, Niels Stensen initially described a constellation of findings now known to represent TOF. Over 200 years later, Etienne Fallot described a “blue malady” linked to four distinct structural anomalies of the heart: a large VSD, aortic override, right ventricular hypertrophy, and stenosis of the pulmonary artery ( Figs. 13-45 and 13-52 , and ). It is now well understood that TOF is the result of four unrelated structural cardiac lesions. In fact, underdevelopment and anterosuperior deviation of the infundibular septum is the pathognomonic feature. This deviation of the infundibular septum is crucial to the echocardiographic diagnosis of TOF ( Fig. 13-45B and D ). Pulmonary atresia with a ventricular septal defect (PA-VSD) represents the most severe form of TOF, with complete obliteration of the RVOT (see Fig. 13-46 ).

Epidemiology.
TOF is the most common cyanotic heart defect, with a prevalence of approximately 0.5 per 1000 live births. In the absence of a genetic syndrome, a mother who has had a child with TOF has a 3% to 4% risk of having a second child with CHD.
Anatomy.
Although the presence of a conotruncal defect may be readily identified, distinguishing between conotruncal diagnoses can be challenging. In the long-axis view of the LV, the appearance of a VSD and an overriding semilunar valve can signal the presence of any of a variety of lesions, including TOF, PA-VSD, truncus arteriosus, some forms of DORV, or aortic atresia with large VSD ( Figs. 13-45A and C and 13-53A through C ). Distinguishing these lesions and searching for known associated abnormalities is of the utmost importance.
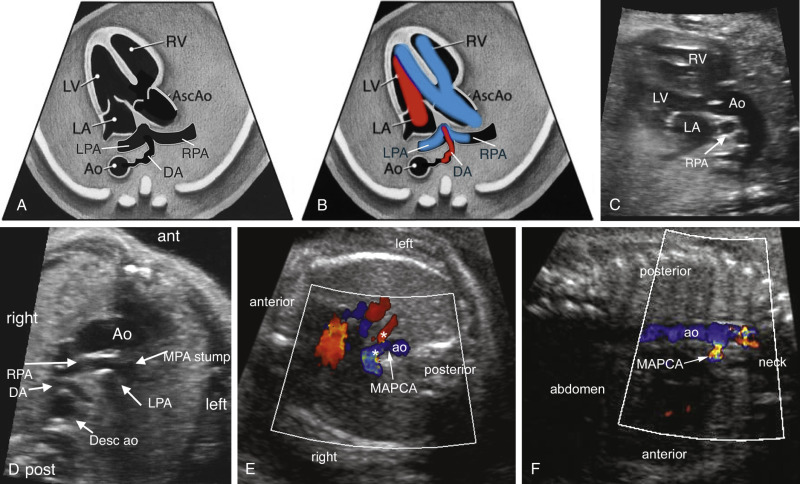
TOF represents a wide spectrum of disease. In contrast to infants with very little obstruction to pulmonary blood flow and VSD physiology (“pink tet”), infants with severe outflow tract obstruction require prostaglandin administration at delivery to assure sufficient pulmonary blood flow (“blue tet”). Evaluation of the RVOT is crucial. Color and spectral Doppler interrogation at the pulmonary valve and of the ductus arteriosus, as well as 2D measurements of the pulmonary valve and main pulmonary artery, can aid in predicting the need for prostaglandin infusion after delivery, for early intervention, and for a transannular patch during the initial repair. Specifically, severe pulmonary valve annular hypoplasia, significantly elevated flow velocity at the level of the pulmonary valve, and flow reversal in the ductus arteriosus are all signs of more severe obstruction, requiring prostaglandin administration at delivery. Additionally, the presence of associated cardiac anomalies, such as additional VSDs, a right-sided aortic arch ( Fig. 13-53D ), and branch pulmonary artery hypoplasia should be investigated.
Determining the source of pulmonary blood flow in pulmonary atresia is crucial. In the case of pulmonary blood flow fed by a ductus arteriosus (see Fig. 13-53A through D ), prostaglandin initiation would be necessary at birth, as would neonatal surgery to establish a stable source of pulmonary blood flow. When the pulmonary blood flow is supplied by multiple aortopulmonary collateral arteries (MAPCAs) ( Fig. 13-53E and F ), pulmonary blood flow is stable at birth. In the case of pulmonary blood flow supplied by a ductus arteriosus, the ductus is tortuous and elongated ( Fig. 13-53A and B and ).
Genetic Considerations.
The common features among conotruncal defects are further highlighted by their association with 22q11.2 deletion syndrome (i.e., DiGeorge syndrome, but this describes only a subset of findings in 22q11.2 deletion syndrome). CHD of some form is present in approximately 80% of liveborn patients with 22q11.2 deletion syndrome. Cardiac anomalies most closely linked to 22q11.2 deletion include absent pulmonary valve syndrome, pulmonary atresia and MAPCAs, truncus arteriosus, and type B interrupted aortic arch ( Table 13-7 ). In addition, the presence of a right aortic arch, anomalous subclavian artery, and crossing pulmonary arteries further increase the risk of 22q11.2 in these populations. A fetal study published in 2001 demonstrated a 45% prevalence of 22q11.2 deletion in patients with an interrupted aortic arch compared to 38% in absent pulmonary valve syndrome, 31% in truncus arteriosus, 18% in PA-VSD, 14% in TOF, and 12% in complex TGA. Interestingly, the association between TGA and 22q11.2 is not consistently observed postnatally, indicating that this transposition with 22q11.2 deletion may represent a group at risk for fetal demise.
Related posts:

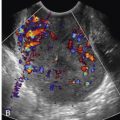
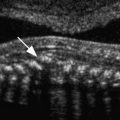
Stay updated, free articles. Join our Telegram channel

Full access? Get Clinical Tree


