Peak
Biology
Marker
Increase
Decrease
N-Acetyl-aspartate
NAA
2.02 ppm
Second-most-concentrated cerebral amino acid
Synthesis in neuronal mitochondria from the amino acid aspartic acid and acetyl-coenzyme A
Functions still under investigation
Neuronal marker
Neuronal integrity
–
Any neuronal damage (may be reversible)
Choline-containing compounds
Cho
3.2 ppm
Part of the hydrophilic head of the membrane phospholipid phosphatidylcholine (lecithin)
Cell density
Cell proliferation
Demyelination
High-grade glioma
Medulloblastoma, PNET
ATRT
Cell necroses
Gliosis
Total creatine
(phosphocreatine + creatine)
tCr (PCr + Cr)
3.03 and 3.94 ppm
PCr: storing and buffering of high phosphate-bound energy, provide quick regeneration of ATP
Cr: functions still under investigations, synthesis in oligodendrocytes associated with neuronal elements
Used for polyamine and methionine synthesis in tumor cells
Activation of glial cells
Gliomatosis
Some solid gliomas
Prognostic marker for PSF of WHO grade II and III astrocytomas
Metastases, necrosis, lymphoma, malignant glial tumors
Myo-inositol
MI, m-Ins
3.56 ppm
(complex signals in short TE)
Osmotic regulator within the astrocytes
Precursor of phosphatidylinositol (involved in metabolic pathway activating proteolytic enzymes)
Osmolyte
Not defined
Gliomatosis
Low-grade astrocytomas
Schwannomas
Choroid plexus papilloma
Metastases
High-grade gliomas
Glycine
Gly
3.56 ppm
Simplest amino acid
Increased synthesis in glioma cells (serine hydroxymethyltransferase)
Utilized for de novo purine biosynthesis
Not defined
aTumor cell proliferation
High-grade gliomas
Medulloblastoma
Normally not measurable, negligible
Lipids
Two large peaks at 0.8–0.9 ppm and 1.2–1.3 ppm
Mobile lipids, lipids in droplets
Cell necrosis
Necrosis of high-grade gliomas
Metastases and meningioma
Lymphomas
Radio-necrosis
Normally not measurable, negligible (cave artifacts from skull)
Lactate
Double-peak at 1.33 ppm, in long-TE (135 ms) inverted
Product of glycolysis
Anaerobic glycolysis
Unspecific: tumor (more often in high- but also in low-grade glioma) necrosis, cysts, inflammation
Normally not measurable
Taurine
3.4 ppm
(complex signals in short TE)
Abundant in developing cerebellum and isocortex; involved in cell shrinkage during apoptosis
Putative marker of apoptosis
Medulloblastoma
Low-grade pilocytic astrocytoma, choroid plexus papilloma
Alanine
Double-peak at 1.5 ppm in long-TE (135 ms) inverted
Amino acid
Meningioma, abscess
Normally not measurable

Fig. 1
MRSI parameter maps for NAA and tCho of a patient with glioblastoma. The left panel (a) shows a T2-weighted MRI with a grid overlay indicating the spatial resolution of the MRSI data. The white frame marks the area selected for spectroscopy using the PRESS excitation scheme. The glioblastoma is located left paracentral; the adjacent parasagittal cortex is slightly blurred on both sides with a mild increase in signal intensity. The color-coded maps show the regional distribution of the metabolites NAA (b, marker for intact neuronal tissue) and tCho (c, marker for proliferating cells). The tCho concentration increase is inhomogeneous showing tumor infiltration into the cortex of both hemispheres (Figure already published in Nervenartz 2014)
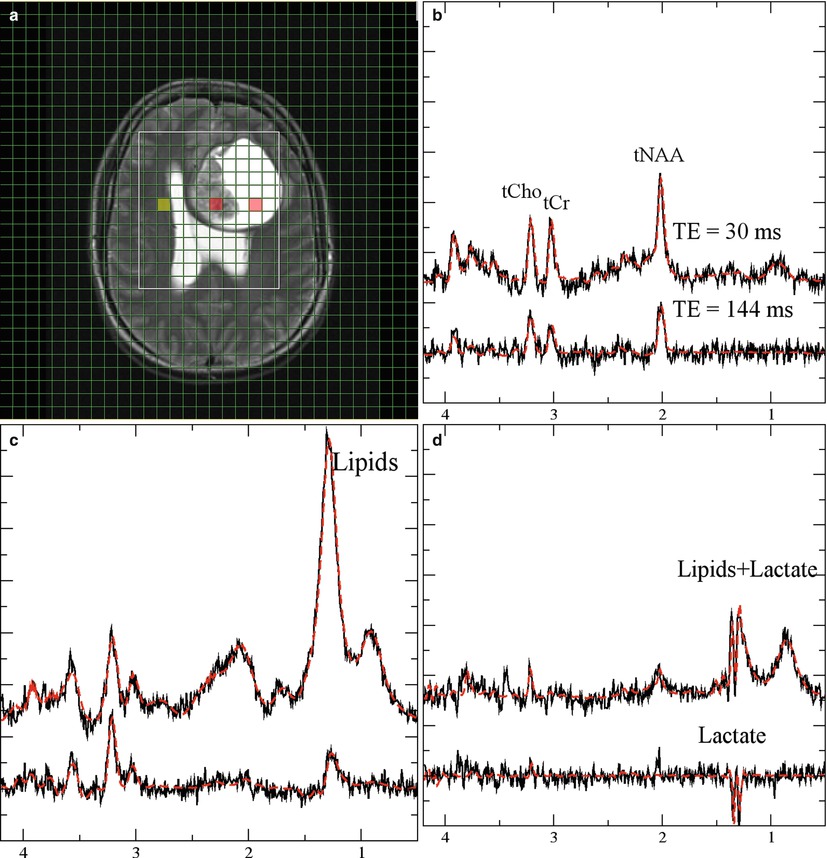
Fig. 2
Monitoring lactate. Short (30 ms, upper traces) and long (lower traces) from a patient with glioma grade IV. (a, T2-weighted MRI with a grid overlay indicating the spatial resolution of MRSI). The three panels with spectroscopic data show normal-appearing tissue (b, yellow-marked voxel in the MRI), necrotic tissue (c, central red-marked voxel in the MRI), and CSF (d, right red-marked voxel in the MRI). Lactate is visible as a doublet (two signals with 8 Hz distance) at 1.3 ppm. The signals are inverted at long TE. Note that the lipid signals at 1.2 ppm which are only visible at short TE are overlapping with lactate
Single voxel spectroscopy relies on the accurate definition of tumor tissue from T2-weighted or CE-enhanced MRI. But these data lack information of tumor heterogeneity and potential tumor infiltration. Further, discrimination of tumor tissue may be difficult for infiltrating gliomas. In MR spectroscopic imaging (MRSI), all spectra of a selected slice are acquired simultaneously applying encoding gradients between the excitation pulse and the acquisition period. After spatial Fourier transformation, the spectroscopic image is obtained as a matrix of the dimension NX × NY, where NX and NY denote the number of phase encoding steps in each direction within the slice. For each matrix, a spectrum can be calculated representing the metabolic information for the voxel attributed to the matrix element. Signal intensities and their ratios can be visualized as a grid overlay on the anatomical image providing parameter maps for the concentrations for specific metabolites or metabolite concentrations ratios (spectroscopic image, Fig. 1). The anatomical reference image should have been recorded with identical angulation and slice offset. Such spectroscopic images provide a retrospective definition of the center and the extent of tumor tissue, while at the same time reference spectra are available from normal-appearing tissue (Fig. 2). The resolution can be as low as 0.75 × 0.75 × 1.00 cm3 at sufficient signal to noise ratio (S/N), but this requires phase encoding for the entire matrix. Consequently, acquisition of a data set with conventional MRSI techniques takes more than 15 min (see below) which might not be tolerated by many patients especially when performed in addition to the other modalities (Chaps. MR Imaging of Brain Tumors, MR Spectroscopic Imaging, MR Perfusion Imaging, and Diffusion-Weighted Methods) routinely applied in the MR examination. Modifications of the basic MRSI sequence which can reduce the data acquisition time or/and provide multi-slice data will be discussed in the next section. Details of biochemical and clinical aspects of metabolic changes will be discussed in a dedicated section.
1.2 Summary of Spectroscopic Imaging Techniques Applied in Tumor Diagnostics
For an in-plane resolution of 7.5 × 7.5 mm2, the 32 × 32 matrix shown in Figs. 1 and 2 had to be recorded at a 240 mm2 FOV. Acquisition of the entire k-space at a repetition time of 1.5 s would take 1,024 × 1.5 s or 26 min. Together with the preparation period (extensive shimming, adjustments for water suppression), the MRS examination may add another 30 min. to the conventional imaging examination. Reduction of measurement time and optimized automatic adjustments for the preparation period are therefore essential for a successful MRS protocol. The latter has been addressed in the modern scanners by the use of image-guided shimming procedures and implementations of routines for automatic adjustments of water suppression. These tools can reduce the preparation time to less than 1 min.
The rather extensive acquisition times required for the complete k-space can also be reduced. Without significant loss in spatial resolution, a 28 × 28 matrix can be recorded and extrapolated to 32 × 32 by adding zeroes before Fourier transformation, which will reduce the total acquisition time to 20 min. Selection of a circular (elliptical in case of rectangular FOV) k-space area centered around the origin will save another 25 % of acquisition time without seriously affecting the spatial resolution (Maudsley et al. 1994). The use of a rectangular FOV could also save up to 30 % (Golay et al. 2002) resulting in a total acquisition time between 10 and 15 min. Further reduction in acquisition time can be achieved with fast imaging techniques like echo planar spectroscopic imaging (EPSI) and parallel imaging method (Posse et al. 1995; Zierhut et al. 2009; Ozturk et al. 2006; Sabati et al. 2014) or multiple spin-echo spectroscopic imaging (MSESI) (Duyn and Moonen 1993). These techniques scan more than one phase encoding step for a single excitation pulse, providing the respective acceleration factors, and allow acquisition of 3D MRSI data with sufficient spatial resolution in reasonable scan time.
1.3 Partial Volume Effects Due to Low Resolution
Metabolite concentrations from lesions smaller than the grid resolution will be affected by the concentration in the surrounding tissue and changes may be masked, i.e., choline concentrations will be underestimated while NAA concentrations will be overestimated. Also, special care should be taken when nominal matrix size (i.e., the number of phase encoding steps in each direction before extrapolation by adding zeroes) is rather small (<16 × 16), since this causes significant blurring due to the poor point spread function leading to “bleeding” of signal intensity between adjacent voxels. Signal bleeding also becomes significant when the grid resolution (resolution after adding zeroes) exceeds the nominal resolution significantly; thus, digital resolution enhancement by more than a factor of 2 should be avoided. Partial volume effects should definitely be taken into account when the absolute quantification of spectroscopic data is considered.
1.4 Evaluation of Metabolite Concentrations
Spectroscopic data reflect the concentration of a subset of brain metabolites. The accuracy of the related information depends crucially on the approach used for data quantification. Generally, the spectrum is evaluated by measuring the area under the metabolite signals. This can be done either by numerical integration of metabolite peaks in phased (real) or magnitude (modulus) spectra or by using more sophisticated tools which basically perform a nonlinear fit of the entire spectrum. Depending on the tool, the fit is performed in the time domain using constraints (jMRUI (Naressi et al. 2001; Vanhamme et al. 1997), an offline tool which requires export of the data to an external workstation) or frequency domain (most processing tools which are provided by the vendor and operate on the scanner console; LCModel (Provencher 1993), offline data evaluation). All methods report signal intensities which are proportional to the respective metabolite concentration in the volume of interest (VOI). Conversion of the hardware-specific units to absolute concentrations (i.e., mMol/l) requires a set of correction factors which depend on the used pulse sequence, hardware parameters like signal amplification and coil loading, relaxation times (T1, T2) of the metabolites, as well as fractions of GM, WM, and CSF in the VOI (partial volume effects). Hardware parameters can be corrected for by using either the so-called phantom replacement method (Michaelis et al. 1993) or scaling relative to the water signal (Barker et al. 1993). The water must be recorded in a separate measurement, either as a separate MRSI data set which has to be corrected for T1 and T2 relaxations or by an imaging sequence with proton density contrast. Relaxation terms for metabolite signals from regular (healthy) tissue are available in several publications, but they may be changed in tumor tissue (Träber et al. 2004; Hattingen et al. 2007; Isobe et al. 2002). Further, the presence of contrast agents can lead to a decrease of signal intensity between 10 and 15 % (Smith et al. 2000; Sijens et al. 1997; Murphy et al. 2002). Correction for partial volume effects requires at least one more additional imaging sequence and further calculations. A rather quick method which only takes into account the CSF fraction was described by Horská et al. (2002), while analysis of GM, WM, and CSF fraction requires tissue segmentation which can be very time consuming. Therefore, a thorough data evaluation in terms of absolute concentrations should be reserved for research studies aimed at metabolic differences between different groups of patients (e.g., different tumor entities) and longitudinal studies, while for diagnostic purposes a semiquantitative approach just comparing metabolite intensities from tumor tissue and normal-appearing tissue from the contralateral side may be sufficient. Immediate information of the extent of change of metabolite concentrations or their ratios can be visualized in the MRSI metabolite map (Figs. 1 and 3). However, one should be aware of artifacts (see below).
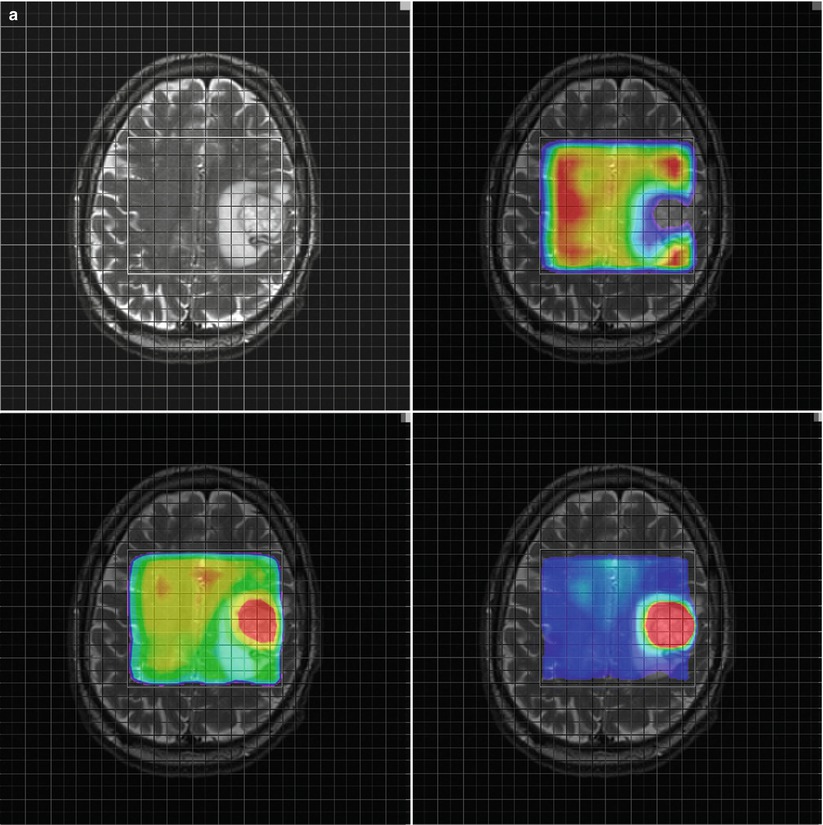
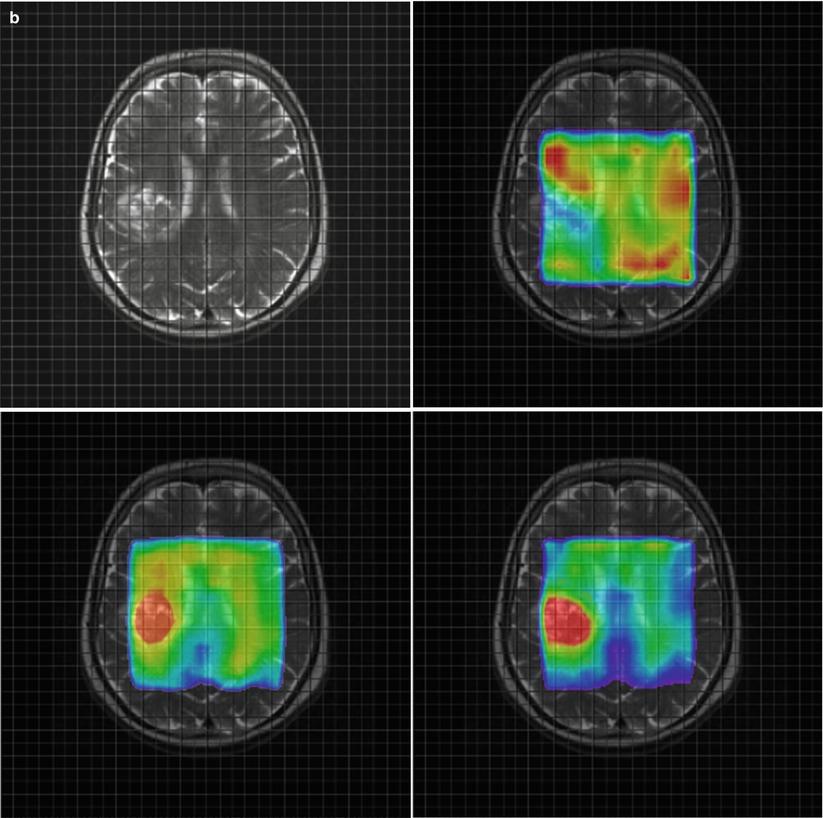


Fig. 3
Parameter maps for NAA (upper right) Cho (lower left) and the ratio Cho/NAA (lower right) from a glioblastoma (a) and a metastasis (b). Note the higher relative ratio Cho/NAA compared to the normal tissue in the glioblastoma (a) compared to the metastasis (b) due to a marked increase of choline signal intensity in the glioblastoma (a). The Cho/NAA ratios of the glioblastoma (a) are moderately increased outside the tumor mass, indicating tumor cell infiltration. In contrast, the Cho/NAA map of the metastasis shows clearer margins of the tumor (b)
1.5 Artifacts in Metabolite Maps
Spectroscopic imaging data are frequently visualized as metabolite maps, i.e., for each metabolite the concentration is displayed either as a grayscale image or as a color-coded overlay on an anatomical image. While this provides the most intuitive picture of the results, special care should be taken when interpreting these maps. Local field inhomogeneities due to calcification or deposits of paramagnetic hemosiderin which occur in the vicinity of areas with former bleeding can shift and distort signals, spoiling the data analysis algorithm applied to obtain the signal intensities for the specific metabolites. Especially for voxels crucial for diagnostic decision (e.g., with highest choline), the choline hot spots or Cho/NAA signal intensities require an inspection of the entire spectrum to exclude excessive line broadening and baseline distortions which usually prohibit a reasonable signal analysis by integration or fitting routines, leading to false values for metabolite concentrations or their ratios. Intense lipid signals originating from necrotic areas as well as from fat deposits in the skull base, soft tissue, and orbit can also distort the baseline. These lipid signals can even appear in the spectra and should not be misinterpreted as tumor necrosis (Fig. 4a). An excellent description how to judge the quality of the spectra is given by Kreis (2004). Rapidly growing tumor cells typically have marked increase of glycolytic rates even if oxygen is abundant (Warburg effect (Warburg 1956), see below), and lactate is considered as a marker for increased glycolysis. Lactate in tumor tissue coincides with the lipid signal but can be easily distinguished from lipid (Kuesel et al. 1996), since only lactate shows a doublet signal (i.e., two peaks of identical intensity separated by 7.4 Hz) which will be inverted at an echo time of 135 ms (Fig. 2). At B0 field strength of 3 T, the doublet structure of lactate may be less visible due to increased line broadening at higher field strengths but signal inversion can still be exploited for discrimination of lactate from lipid.
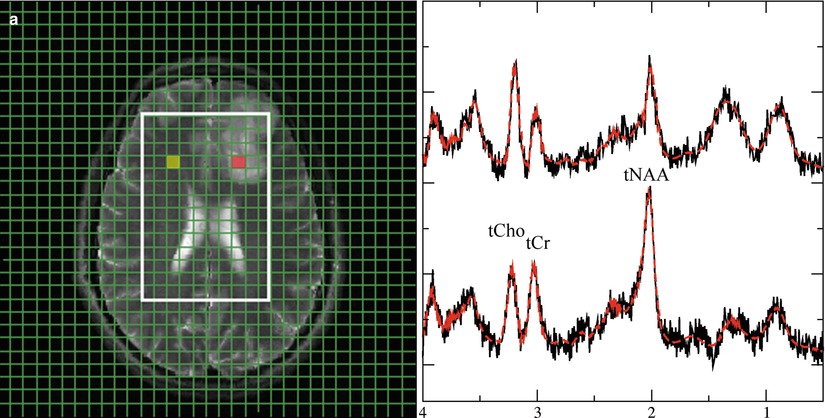
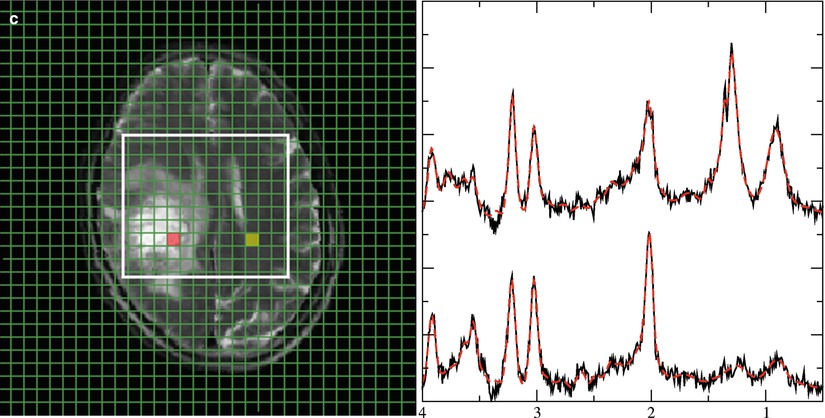


Fig. 4
Representative 1H spectra in gliomas of different WHO grades. Short TE (30 ms) from brain tumors depicting a low-grade (a), a grade III (b), and a heterogeneous grade IV tumor (c). Each panel with spectroscopic data shows spectra from the voxels marked in the respective MRI on the left with the upper trace referring to the tumor voxel (red) and the lower trace referring to the contralateral, normal appearing tissue voxel (yellow). Due to its more frontal position, spectra from the low-grade tumor are broadened and therefore plotted with an extended y-scale. Note: The grade III tumor shows the most enhanced tCho signal
2 Tumor Metabolism
A major characteristic of brain tumors is the altered metabolism. In recent years it has become clear that biological modifications in tumor tissue are evident through metabolic alterations which may be of great importance in therapy resistance (Tennant et al. 2010). This chapter describes changes in metabolic pathways which are typical for tumor tissue and can be measured by MR spectroscopy. Identifying those features may be useful for the diagnosis or treatment of brain tumors.
Tables 1 and 2 show an overview of the most important 1H and 31P metabolites for brain tumors. Representative 1H and 31P spectra from gliomas with different tumor grades are shown in Figs. 4 and 5
.
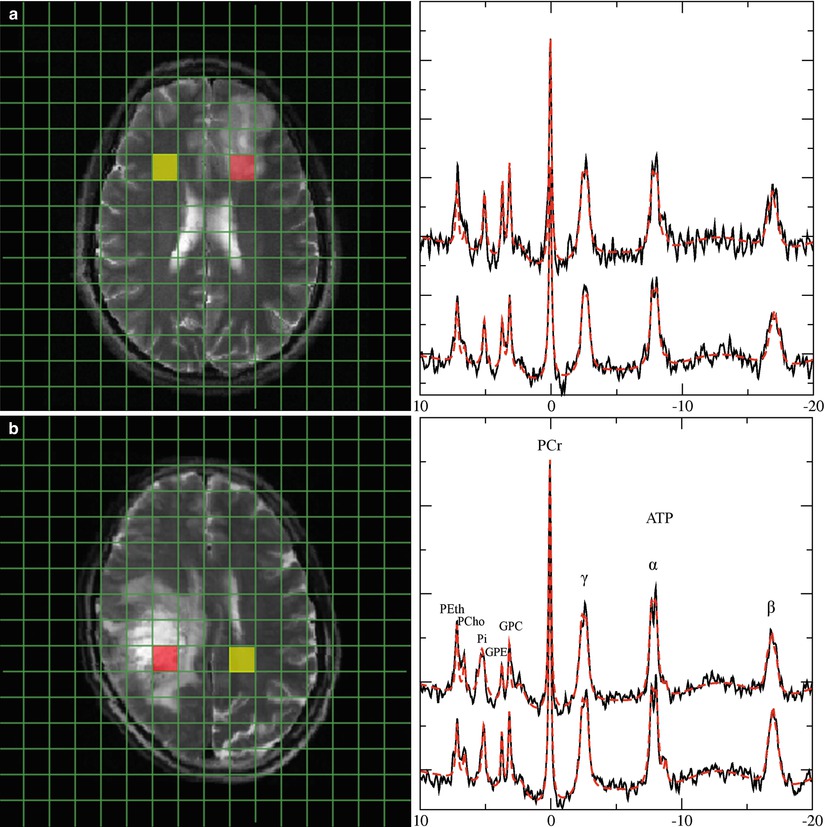
Table 2
Metabolites measurable with in vivo 31P MR phosphorus spectroscopy in brain tumor
Metabolite | Peak | Biology | Marker | Increase | Decrease |
|---|---|---|---|---|---|
Phosphocholine PCho, PC | 6.2 ppm | Precursor of the membrane phospholipid phosphatidylcholine (lecithine) Cho phosphorylation is catalyzed by choline kinase (CK) High levels of expression and activity of CK promotes tumor cell growth | Tumor cell proliferation | Proliferating high-grade glioma cells (animal model) Elevated PCho/GPC implies transformation of grade II to grade IV glioma (Elkhaled et al. 2014)a and GBM progression | Putative decrease under HIF1α inhibitor treatment (Venkatesh et al. 2012)a |
Glyceropho-sphocholine GPC | 2.9 ppm | Metabolite of the degradation pathway of phosphatidyl-choline by phospholipases | Low-grade glioma (relative increase to tCho) (Righi et al. 2009) | High-grade glioma (Elkhaled et al. 2014; Righi et al. 2009; Venkatesh et al. 2012) rGBM (Hattingen et al. 2013) | |
Phospho-ethanolamine PEth, PE | 6.8 ppm | Precursor of the membrane phospholipid phosphatidylethanolamine (cephaline) | Tumor cell metabolism | In vivo tumors (Mintz et al. 2008) Elevated PEth/GPE in rGBM (Hattingen et al. 2013) Lymphoma (ex vivo liquid chromatography) (Kinoshita et al. 1994) | |
Glycerophospho-ethanolamine GPE | 3.5 ppm | Metabolite of the degradation pathway of phosphatidyl-ethanolamine by phospholipases | Putative marker of GBM | Tumor cell apoptosis (rat glioma) (Valonen et al. 2005)a | Recurrent GBM (Hattingen et al. 2013) |
Phosphocreatine PCr | 0.0 ppm | Reserve of high-energy phosphates Donator of the phosphate group to ADP to form ATP catalyzed by phosphokinase | High-energy storage | ATP/Pi increase under BCNU (animals) | Brain tumors (rat glioma) (Ross et al. 1988), rGBM (Hattingen et al. 2013) |
Adeosine triphosphate ATP | −2.5 ppm (doublet) −7.6 ppm (doublet) −16.1 ppm (triplet) | High-energy source for many cellular processes such as cell division and biosynthetic reaction ATP is replenished from ADP an Pi mainly by energy from cellular respiration | High-energy metabolism | Not clear (most studies used ratios), ATP/Pi increase under BCNU (animals) | (Pre)treated brain tumors (animal tumors, rGBM) (Naruse et al. 1985; Hattingen et al. 2013) |
Inorganic phosphate Pi | 4.7–5.4 ppm (position changes with pH) | Low-energy state of phosphate | Part of phosphokinase reaction | (Pre)treated brain tumors (animal tumors, rGBM) (Naruse et al. 1985; Hattingen et al. 2013) | |
Intracellular pH | Chemical shift difference between PCr and Pi | Upregulation of H+ extruding and buffering pathways (Na+/H+ exchanger, transmembrane carbonic anhydrases) More acidic extracellular environment enhances the tumor invasiveness and angiogenesis | Intracellular H+ production (through glycolysis) | Intracellular alkalosis in high-grade gliomas (Oberhaensli et al. 1986) |

Fig. 5
Representative 31P spectra in gliomas of different WHO grades. 31P spectra from a low-grade glioma (a) and a heterogeneous glioma grade IV (b). Upper traces represent data of tumor tissue from the red-marked voxel in the MRI, while lower traces refer to the contralateral normal-appearing tissue from the yellow voxel in the MRI. Note: Increased GPE and PE signals in the low-grade tumor, while GPE is decreased in the glioma grade IV. Broadening of the inorganic phosphate signal in the glioma grade IV indicates increased intracellular pH in the tumor tissue
A basic metabolic alteration in malignant cells is the phenotype which performs aerobic glycolysis even in the presence of oxygen whereas oxidative phosphorylation is suppressed (Warburg 1956). Enhanced lactic acid production through glycolysis causes extracellular acidosis. To counteract the intracellular proton accumulation, the activity of H+ extruding and buffering pathways like the Na+/H+ exchanger or the transmembrane carbonic anhydrases is upregulated (Chiche et al. 2009; McLean et al. 2000). Thus, the extracellular environment gets more acidic while the intracellular pH increases. The maintenance of an alkaline intracellular pH in tumor cells supports cellular proliferation, whereas extracellular acidosis promotes angiogenesis. Phosphorus spectroscopy is the only noninvasive method measuring both intracellular pH and the high-energy phosphate compounds ATP and PCr (Negendank 1992; Hattingen et al. 2011). Suppressed oxidative energy metabolism as a result of tumor hypoxia and repressed mitochondrial function may induce a decrease in high-energy phosphates like ATP and phosphocreatine (Papandreou et al. 2006).
Further, energy consumption is increased in neoplastic transformations to provide protein and nucleotide synthesis (Susa et al. 1989). The glycolytic pathway is linked with amino acid production. Serine as intermediate from 3-phosphoglycerate seems to be increased in proliferating cells (Snell 1984). Serine hydroxymethyltransferase, catalyzing the reversible reaction of serine to glycine, is highly activated in cultures of rat glioma cells (Kohl et al. 1980). Glycine, one product of this reaction, is measurable by proton spectroscopy. It has been shown that glycine is increased in malignant gliomas (Jain et al. 2012; Lehnhardt et al. 2005; Hattingen et al. 2009; Kinoshita et al. 1994; Maudsley et al. 2014). The other product, 5,10-methylene-tetrahydroxyfolate, is utilized for purine and nucleotide synthesis. Therefore, glycine might be considered as a surrogate marker of enhanced glycolysis and nucleotide synthesis.
However, the glycine signal is overlapping with the signal from myoinositol (MI) at 3.56 ppm, requiring special measures for discriminating MI from glycine as described in Chap. Future Methods in Tumor Imaging). Increased MI concentrations or ratios of MI to creatine were detected in tumors, but also in multiple sclerosis, Alzheimer’s disease, and in other metabolic and inflammatory white matter diseases as well as in tuberous sclerosis. Common to all of these pathologies is augmented astrocytic proliferation and demyelinization. Therefore, the role of this metabolite in maintaining cell volume in reactive astrocytes is discussed (detailed discussion and references in Hattingen et al. 2008).
An increased choline signal intensity is frequently observed in 1H MRS data from tumor tissue (Figs. 3a, 4b, and 6) and has been attributed to rapidly proliferating cells (Herminghaus et al. 2002; Guillevin et al. 2008). In conjunction with the decrease of the NAA (N-acetyl-aspartate and N-acetyl-aspartylglutamate) signal intensity due to neuronal loss, the tCho/NAA ratio is considered as the most prominent marker for tumor tissue in MRS (Figs. 1, 3a, 4b, and 6). Modulations of phospholipid turnover, which is in part described by the Kennedy pathway (Kennedy 1957), play a pivotal role in the tumor metabolism (Podo 1999). In brief, this pathway describes synthesis of phosphatidylcholine via choline and phosphocholine (PCho) and its breakdown via glycerophosphocholine (GPC). However, 1H MR spectroscopy detects only total choline (tCho) as the sum of free choline, PCho, and GPC. Consequently, 1H MRS cannot differentiate between PCho and GPC changes, whereas 31P spectroscopy can (Fig. 5). There is increasing evidence that the metabolites PCho and GPC play an important role in tumorigenesis with high PCho/GPC ratios indicating malignant phenotype of a brain tumor (Hattingen et al. 2013).
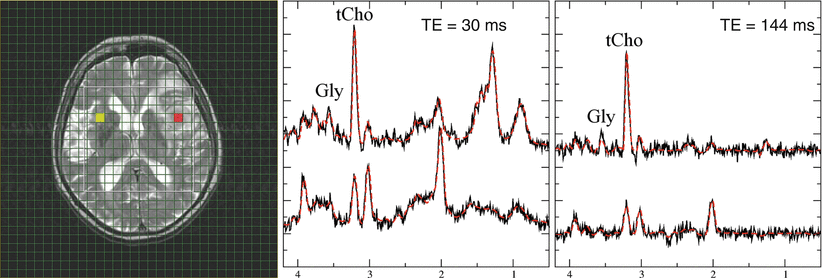

Fig. 6
Diagnostic information from combined long and short TE spectra in high-grade gliomas. Short (30 ms, middle panel and long (144 ms, right panel) TE spectra from glioma grade IV. The upper traces represent tumor tissue from the red-marked voxel in the MRI, while lower traces show contralateral normal-appearing tissue (yellow-marked voxel in the MRI). Note that only the short TE spectrum of the tumor shows a prominent lipid signal at 1.3 ppm. The signal at 3.6 ppm in normal-appearing tissue almost disappears at the long TE, while this signal is clearly visible in tumor tissue for both TE. This indicates that the signal in tumor rather originates from glycine than from myoinositol
In vitro studies showed that PCho is the dominant membrane lipid metabolite in proliferating tumor cells and tumor tissues (Gillies et al. 1994). PCho is formed by phosphorylation of choline by the cholinkinase α which is over-expressed in many malignant tumors including glioma cell lines (Glunde and Bhujwalla 2007). Several oncogenes increase choline kinase activity and hypoxia-inducible factor 1 alpha signaling upregulates choline kinase expression (Glunde et al. 2008). Apart from its role as a phospholipid membrane precursor, PCho may also act as a second messenger in cell growth signaling (Gillies et al. 1994; Cuadrado et al. 1993; Aiken and Gillies 1996). Aiken and Gillie 1996 found increased PCho content of rat glioma cells, which decreased during the conversion from the exponential growth to stationary growth phase. Ex vivo MR spectroscopic studies of human brain tumors could further show that the PCho concentration is increased in high-grade gliomas compared to low-grade tumors (McKnight et al. 2011; Vettukattil et al. 2013), but the same studies yielded inconclusive results regarding the GPC concentrations in these glioma specimens. It remains unclear whether low-grade gliomas have higher GPC concentrations compared to high-grade tumors. The amount of GPC might be predominantly influenced by molecular genetic markers and not by the tumor grade. It has been shown that glioma tissue specimens with oncogenic IDH1 mutations have significant higher GPC concentration levels compared to tumors without this mutation (Constantin et al. 2012). Studies in endometrial and ovarian cancers showed that higher activity of the GPC-cleaving enzyme glycerophosphodiesterase increases migration capacity of tumor cells (Papanagiotou et al. 2007). High activity of this enzyme lowers the GPC concentration releasing free choline which can be converted into PCho.
Stay updated, free articles. Join our Telegram channel

Full access? Get Clinical Tree


