Considerable progress in myocardial perfusion cardiovascular magnetic resonance (CMR) has been achieved recently and its diagnostic performance has been documented in single-center and multicenter trials. From single-center trials, and particularly from multicenter trials, the knowledge of how to perform and interpret perfusion CMR studies has improved considerably. Also, convincing evidence has been obtained regarding the robustness of the technique when performed at different sites, the importance of the reader experience for data analysis, and the excellent prognostic power of perfusion CMR. Finally, an increasing number of studies are available that now also address the economic consequences of introducing this new technique for diagnosing and managing coronary artery disease (CAD).
The CMR technique offers an almost unbeatable versatility for exploring any aspect of cardiac disease. Therefore this chapter starts by illustrating how perfusion CMR is embedded in the concepts of atherosclerosis development and the vulnerable plaque theory. It then addresses established and not yet established aspects of the perfusion CMR protocol, including the different approaches proposed for data interpretation and analysis. In this chapter, the current performance of clinical perfusion CMR is presented to diagnose CAD and predict outcome. A perspective for the future of perfusion CMR is provided at the end of the chapter.
The Rationale for Perfusion Imaging
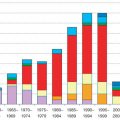
Endothelial dysfunction is generally recognized as a crucial initial step in the development of atherosclerosis. Among many alterations in dysfunctional endothelium, the production of nitric oxide is reduced, which promotes the recruitment of leukocytes to the vessel intima through enhanced expression of endothelial adhesion molecules. In the vessel wall, mononuclear leukocytes become foam cells by lipid accumulation and form reversible fatty streaks. In addition, recruitment of smooth muscle cells and their production of extracellular matrix induce the formation of fibrous lesions. During the course of atherogenesis, inflammatory triggers and other factors can affect the balance between the production of matrix-degrading enzymes and collagen production by macrophages, which can cause fibrous cap destabilization. Subsequent repetitive plaque ruptures (and healing), even when clinically silent, may cause a stepwise progression of atherosclerotic lesions. A final rupture then of larger plaques can cause the ultimate thrombus formation and acute vessel occlusion. In line with this concept, invasive studies conducted mainly in the preinterventional era demonstrated a positive correlation between stenosis degree in coronary angiography and risk for plaque rupture and acute myocardial infarction. Fig. 18.1 demonstrates in approximately 17,000 patients an exponential increase in the likelihood of a coronary occlusion associated with a plaque rupture with an increasing degree of coronary artery stenosis. Accordingly, vulnerable plaques were defined by four major criteria : (1) thin cap with large lipid core, (2) stenosis degree >90%, (3) endothelial denudation with superficial platelet aggregation, and (4) fissured plaque.

In a large autopsy study evaluating the entire coronary tree of sudden cardiac death patients, active (vulnerable) plaques were found in ~60%, and in all patients severe stenoses (>75% diameter reduction) were observed. In another 20% healed postinfarct scares were found (most likely causing malignant arrhythmias) and in another 20% severe nonactive stenoses were present. Given these events in the development of CAD described earlier, a major goal of noninvasive imaging is to identify vulnerable plaques in the coronary circulation that are at risk for occlusion in case of rupture: that is, severely stenosing plaques. Ideally, identification of these plaques would include determination of both plaque mass (to some degree related to stenosis severity) and plaque composition. Although direct visualization of plaques in the coronary circulation and assessment of plaque components is still in an early clinical phase, assessment of stenosis degree by means of perfusion CMR has been evaluated in large clinical single-center and even multicenter trials, which convincingly demonstrated its high prognostic power to predict cardiac death and nonfatal myocardial infarction.
The Perfusion Cardiovascular Magnetic Resonance Protocol
Stress-Only Versus Stress-Rest Examination for the Detection of Hemodynamically Significant Lesions
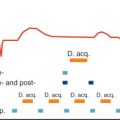
In fundamental canine experiments, a reduction of coronary artery cross-sectional area was related to resting and hyperemic flow in the vessel. To assess the hemodynamic consequences of a coronary artery stenosis, the maximum hyperemic coronary blood flow during intracoronary adenosine infusion was measured. To compare maximum hyperemic flow in different coronary vessels, hyperemic flow was normalized with resting flow to correct for differences in mass of the vessel-dependent myocardium. Thus the assessment of hemodynamic significance of a coronary artery stenosis was achieved by dividing hyperemic blood flow by resting blood flow: that is, by calculating the coronary flow reserve (CFR). However, the influence of resting hemodynamics on resting flow, and thus on CFR, was recognized. By altering resting heart rate and blood pressure, CFR ranged from 2 to 12 in their experiments. To solve this problem, the relative CFR was proposed as hyperemic blood flow with stenosis divided by hyperemic blood flow without stenosis. This relative CFR eliminates the influence of resting hemodynamics on CFR because hyperemic stenosis flow is normalized by maximum adenosine-induced hyperemic flow that is uncoupled from myocardial oxygen demand. Consequently, this relative CFR remained stable during varying resting hemodynamics (standard deviation [SD] of 17% for relative CFR vs. 45% for the absolute CFR). These findings are in line with a recent CMR study in humans, demonstrating the important effect of resting hemodynamics such as heart rate, contractility, and loading conditions on resting myocardial blood flow and, hence, on absolute CFR. Further evidence that absolute CFR is affected by resting hemodynamics is provided by positron emission tomography (PET) studies on myocardial perfusion performed in patients with CAD. With this technique, a correlation of CFR with percent area stenosis was demonstrated; however, there was a tendency toward even better correlations for hyperemic myocardial flow alone. These data suggest that relating hyperemic flow supplied by stenosed coronary arteries to hyperemic flow supplied by nonstenosed coronary arteries (e.g., represented in a normal database) is advantageous because it eliminates the influence of resting hemodynamics as encountered with the CFR approach. This stress-only approach, which compares hyperemic stenosis flow with hyperemic flow of a normal database, has been successfully applied in several clinical CMR studies. Although the CFR measurements are affected by resting hemodynamics, two additional problems should be kept in mind: (1) matching myocardial regions, for example, the subendocardial layer, for both rest and hyperemic conditions may be difficult because geometry of the heart is changing with changing heart rate and loading, and (2) to obtain accurate results for the CFR calculation, the technique must guarantee a linear relationship between CMR-derived perfusion parameters and true flow over a wide range of flow conditions covering resting and hyperemic flow. A synopsis on advantages and disadvantages on the stress-only and stress-rest protocols is shown in Table 18.1 .
| Stress-Only Perfusion Protocol | Stress-Rest Perfusion Protocol | ||
|---|---|---|---|
| Acquisitions | Hyperemic data only | Hyperemic and rest data waiting time between acquisitions | |
| Oxygen demand–perfusion relation | |||
| Not applicable | Determined by “confounding factors” | |
| |||
| |||
| |||
| Oxygen demand–supply uncoupled | Oxygen demand–supply uncoupled | |
| Analysis | Only hyperemic data | Two analyses (stress and rest) matching anatomy for rest/stress condition “late enhancement effect” for second acquisition | |
| “Ideal” MR parameter–perfusion relation | Linear for low perfusion range (no perfusion increase during hyperemia in myocardium supplied by significantly stenosed vessel) | Linear for both resting and hyperemic perfusion, because CFR is calculated as hyperemic data/rest data | |
| Normal/abnormal discrimination | With normal database for regional hyperemic perfusion | With normal database for regional CFR | |
| Viability assessment | With late enhancement acquisition advantage: acquisition window: minutes | Low resting perfusion indicates scar disadvantage: acquisition window: seconds (first pass) | |
| Assessment of perfusion and viability | |||
|
| Hyperemic perfusion | With resting perfusion yielding CFR |
| Late enhancement | Resting perfusion | |
|
| Hyperemic perfusion (tracer injection at stress) | — |
| Rest-tracer redistribution (tracer injection at rest) | — | |
|
| Perfusion (flow tracer injection at stress) | With resting perfusion yielding CFR |
| Rest FDG uptake (metabolic tracer injection at rest) | — | |
Options for Inducing Stress in Cardiac Perfusion Studies
From the considerations mentioned earlier, it appears mandatory to apply some kind of stress to the myocardium to assess stenoses that reduce maximum blood flow, but not resting flow. If oxygen demand of the myocardium is increased either by positive inotropic agents such as dobutamine or by direct physical stress, the supply-demand imbalance induces a vasodilation and a hyperemic reaction in the myocardium to meet demand ( Fig. 18.2 ). However, in myocardial regions supplied by a stenosed coronary artery, increased oxygen demand is not met by supply, causing ischemia and consequently regional hypokinesia or akinesia. In this latter situation, assessments of both myocardial (contractile) dysfunction and reduced hyperemic reaction allow detection of a hemodynamically significant stenosis. Alternatively, hyperemia can be induced directly by administration of vasodilators such as dipyridamole or adenosine. This strategy detects coronary artery stenoses by assessment of a compromised hyperemic flow, although ischemia (O 2 supply-demand imbalance) is very rarely induced by vasodilators. To cause a steal effect by vasodilators, the stenosis has to be severe (i.e., >90%) as demonstrated in experimental studies. Consequently, when contractile function was assessed during vasodilator-induced stress, the sensitivity for detection of CAD in clinical studies was very low. Moreover, in comparison with positive inotropic approaches, the vasodilator approach as used for perfusion tests appears advantageous by reducing ischemia-associated side effects such as angina pectoris and arrhythmias. Adenosine causes hyperemia via A1 receptors, but it also induces negative chronotropic, dromotropic, and inotropic effects and, in addition, it can cause bronchospasm, atrioventricular (AV) block, and mast cell degranulation. Despite this profile, it is a very safe stressor as was shown in the EuroCMR registry with only two severe reactions in 18,840 patients. In clinical routine, an insufficient hemodynamic response to adenosine can occur. Karamitsos and colleagues proposed a high-dose regimen for adenosine (by increasing the standard dose of 140 µg/kg/min for 3 minutes to 210 µg/kg/min for 7 minutes), which was safely applied in patients with suspected CAD, increasing the proportion of adequate hemodynamic response (heart rate increase >10 beats per minute or systolic blood pressure decrease >10 mm Hg) from 82% to 98%. Conversely, dipyridamole induces hyperemia by blocking adenosine re-uptake. Finally, regadenoson represents a more selective adenosine 2A receptor, which is administered as a single intravenous (IV) bolus. This compound was shown to induce hyperemia at a similar degree to adenosine and it was also successfully used in studies on prognosis (see later).

Endogenous Versus Exogenous Contrast Media
Endogenous Contrast Media
Arterial spin labeling exploits the fact that unsaturated protons entering saturated tissue shorten the tissue T1. Using appropriate electrocardiogram (ECG)-triggered pulse sequences, T1 measurements are performed after global and slice-selective spin preparation. Absolute tissue perfusion is then calculated by assuming a two-compartment model. It should be kept in mind that this approach assumes that the direction of flowing blood in intramural vessels is orthogonal to the slice orientation, which is not the case for all myocardial layers. Furthermore, fiber orientations change during contraction and relaxation, making this approach problematic in the beating heart.
In blood-oxygen-level-dependent (BOLD) imaging, deoxygenated and thus paramagnetic hemoglobin shortens T2 relaxation time and therefore can be used as an endogenous contrast media (CM) (although oxygenated hemoglobin is slightly diamagnetic, causing less T2 shortening). A T2- or T2*-weighted pulse sequence allows for an estimation of an increased content of oxygenated blood. During pharmacologically induced hyperemia, oxygen content will increase in well-perfused myocardium but not in myocardium supplied by a stenosed vessel (which is associated with a higher O 2 extraction). However, signal differences in normally perfused regions versus hyperemic regions (with a 4-fold increase in flow) were reported to be as low as 32% in an experimental study. These BOLD data correlated closely with microsphere data, but the slope of the correlation was as low as 0.08. This limitation in signal difference might be problematic, because CM first-pass studies suggested several hundred percent of signal change being required for a reliable stenosis detection. In another study applying BOLD, ΔR2 measurements yielded an adequate slope of 0.94. But again, the sensitivity to absolute flow changes was low, because a 100% increase in flow yielded a signal increase of only 5% (i.e., a change in myocardial R2 of 0.94/s) in that study. Accordingly, in a recent study in patients, R2 increased by only 16% during adenosine stress in nonstenotic areas (although adenosine is typically increasing flow 300%–500%). The BOLD approach is also sensitive to magnetic field inhomogeneities, predominantly occurring in the posterior wall close the coronary sinus draining deoxygenated blood. Considering these aspects, the robustness of the method is not yet fully explored.
Exogenous Contrast Media for Perfusion Cardiovascular Magnetic Resonance
These CM are typically injected into a peripheral vein, and the signal change in the myocardium occurring during the first-pass of the CM is measured by a fast CMR acquisition. All CM first-pass techniques either under development or in clinical routine are designed to meet the following requirements: (1) provide high spatial resolution to permit detection of small subendocardial perfusion deficits, (2) provide adequate cardiac coverage to allow for assessment of the extent of perfusion deficits, (3) feature high CM sensitivity to generate optimum contrast between normally and abnormally perfused myocardium during CM first pass, and (4) allow acquisition of perfusion data every one to two heartbeats to yield signal intensity–time curves of adequate temporal resolution that allow for extraction of various perfusion parameters (see later). To reach these goals, high-speed data acquisition and time-efficient magnetization schemes are most important. Because the first pass of CM during hyperemia lasts only 5 to 10 seconds, breathing motion is minimized by a breath-hold maneuver, although cardiac motion is eliminated by ECG triggering. This control of cardiac and breathing motion in perfusion CMR preserves its high spatial resolution of data acquisition: on the order of 1 to 2 mm × 1 to 2 mm. This is not the case for scintigraphic techniques with acquisition windows of several minutes, which preclude breath-holding for elimination of respiratory motion, and ECG triggering during single-photon emission computed tomography (SPECT) studies requires higher tracer amounts to improve counts statistics.
Extravascular Contrast Media
For perfusion CMR techniques, the relationship between myocardial CM concentration and myocardial signal depends on a variety of factors. Normal perfusion can cause a signal increase during first pass of a gadolinium (Gd) chelate when combined with a T1-weighted pulse sequence, although a T2-weighted sequence with a higher dose of a Gd chelate can even cause a signal drop during first pass. This is fundamentally different from ischemia detection based on the assessment of wall motion, where new onset of dysfunction unambiguously indicates the presence of ischemia.
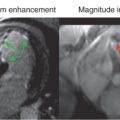
Today, extravascular Gd chelates are most commonly used for first-pass perfusion CMR in combination with heavily T1-weighted pulse sequences. These CM are excluded from the intracellular compartment (i.e., from viable cells with intact cell membranes); therefore a perfusion deficit during the first pass reflects either hypoperfused viable myocardium (which would become ischemic during inotropic stress) and/or scar tissue (with severe reduction of perfusion even at rest). To differentiate hypoperfused tissue further, it is recommended to inject another dose of CM and to wait for the establishment of a dynamic equilibrium of CM concentrations in the various compartments (blood, viable myocardium, scar tissue), to obtain conditions where tissue CM concentrations are governed by distribution volumes (and no longer by perfusion). During this condition, which typically occurs within 10 to 20 minutes after CM injection in humans, late enhancement imaging (with the inversion time set to null normal myocardium) is ideal to discriminate hypoperfused but viable myocardium as dark tissue from scar, which appears bright. For viability assessment, scintigraphic techniques also exploit the equilibrium distribution of tracers, which is observed after rest injection or rest reinjections. However, the radioactive tracers are not taken up by scar tissue, which consequently appears as a cold spot, whereas viable tissue appears as a hot spot (see Table 18.1 ).
Several multicenter studies were performed for the assessment of the optimal CM dose for perfusion imaging. This is important because higher CM doses can cause susceptibility artifacts at the subendocardium, where differences in CM concentrations between blood and myocardium are high during first pass. Strongly T1-weighted sequences showed an absence of a susceptibility-induced signal drop in the subendocardial layer up to doses of 0.15 mmol/kg of an extravascular Gd chelate, which resulted in superior diagnostic performance of doses of 0.1 and 0.15 mmol/kg versus 0.05 mmol/kg for semiautomatic analysis of the upslope parameter ( Fig. 18.3 ).

Intravascular Contrast Media
For albumin-targeted MS-325 and polylysine-Gd compounds differences between normally perfused and stenosis-dependent hypoperfused myocardium were reported in animals. However, these intravascular Gd-based CM have not advanced into clinics. Ultrasmall superparamagnetic particles of iron oxide (USPIO) nanoparticles were used for perfusion studies in humans (however, this CM is no longer under investigation because its iron accumulation in the liver). For T2*-enhancing CM, not only the concentration of CM in the voxel but also its intravoxel distribution (homogeneous vs. inhomogeneous) determines its T2*-shortening effect, rendering such a T2*-approach susceptible to vessel architecture (vessel orientation, intervessel distance), which also may compromise quantitative approaches.
Hyperpolarized Contrast Media
Conventional Gd chelates modulate the magnetic resonance (MR) signal by accelerating the relaxation rates of surrounding water protons. However, at a field strength of 1.5 T, the polarization level of the spin population of the MR active nuclei at the thermal equilibrium is low (several parts per million), and only the vast abundance of water molecules in the human body enables generation of a measurable signal. Because the polarization level of water protons increases with magnetic flux density, a higher signal is achieved at higher field strength. Alternatively, however, the polarization level of the spin population of specific nuclei (such as liquid 13 C in various compounds) could be increased by a factor of up to 100,000 (compared with polarization of water protons at the thermal equilibrium) by dynamic nuclear polarization or parahydrogen-induced polarization. With these hyperpolarized CM, signal is received only from the 13 C-nuclei; therefore no signal from background tissue is obtained. This feature appears ideal for absolute quantification of perfusion because signal is directly proportional to the amount of 13 C molecules similar to radioactive tracers, where radioactivity is directly proportional to tracer concentration. Similarly to radioactive tracers, the signal from hyperpolarized 13 C-nuclei also decays (with specific time constants depending on the type of the 13 C-compound), because the spin population of the 13 C-molecules is far away from thermal equilibrium. In addition, repetitive radiofrequency pulsing further destroys longitudinal magnetization depending on the pulse sequence type and the imaging parameters. Johansson and colleagues showed that depolarization can be approximated by a monoexponential function with a time constant T D and successfully applied this concept for cerebral perfusion quantification. Recently, sophisticated spiral pulse sequences became available, which allowed for myocardial perfusion and metabolism quantification in small animals and for the first time in humans.
Perfusion Cardiovascular Magnetic Resonance: What Is Established and What Is Not
Cardiovascular Magnetic Resonance Data Readout
Echo planar readout strategies are well suited to speed up data acquisition, particularly when segmented to reduce the echo time and consequently to render the pulse sequence less prone to susceptibility artifacts (hybrid echo planar pulse sequences). With these accelerated pulse sequences, several k -lines are acquired following a single radiofrequency excitation, reducing the repetition time (TR) per k -line down to less than 2 ms and consequently reducing the total acquisition window per slice substantially. This enables the acquisition of a stack of slices every one to two heartbeats, allowing for multislice acquisitions. Conventional nonsegmented fast gradient echo (FGE; or Turbo fast low angle shot [TurboFLASH]) pulse sequences were also used for perfusion imaging, however, resulting in relatively long readout windows. Alternatively, FGE can be combined with parallel imaging techniques or strategies that exploit the spatiotemporal correlations of image data to considerably speed up the data acquisition. Improving cardiac coverage without the need to reduce spatial and/or temporal resolution would be beneficial because the extent of CAD correlates with outcome. In a recent study in human volunteers, the loss in signal-to-noise ratio (SNR) given by g * √ R (with g being the so-called geometry factor and R the accelerating factor) was compensated for by a longer TR (due to the implementation of temporal sensitivity encoding, a modification of sensitivity encoding [SENSE] ) and increasing the readout flip angle from 20 to 30 degrees. This accelerated hybrid echo planar saturation recovery technique yielded twice as many slices as that obtained with the nonparallel approach whereas SNR improved by approximately 20%.
Readout strategies during steady-state conditions of magnetization (steady-state free precession [SSFP] sequences) appear promising because they preserve magnetization and, thus a high SNR. In a human volunteer study, however, banding artifacts (probably because of longer readout periods or off-resonance) were problematic and myocardial signal increase was rather low (approximately 40% of baseline signal). Recently, Jogiya et al. compared an FGE with a SSFP readout in a three-dimensional (3D) acquisition at 3 T. To optimize the radiofrequency (RF) deposition homogeneity, a dual-source parallel RF transmission approach was applied. To allow for 3D undersampling with acquisition windows of 191 ms and 211 ms for FGE and SSFP, respectively, k – t ( k -space) BLAST (broad linear speed-up technique) and k – t PCA (principal component analysis) reconstructions were used. In 15 volunteers, overall image quality was good, but more susceptibility, that is, dark-rim artifacts, were observed in the SSFP acquisitions compared with FGE. Currently, SSFP-based techniques are not recommended for clinical use because of a relatively high level of artifacts compared with (hybrid) FGE readouts.
Magnetization Preparation
Although 180-degree preparation was used in the past, a 90-degree magnetization preparation is now generally accepted as the most efficient way to achieve T1 weighting because it shortens the delay time to 100 to 150 ms and, additionally, it renders the sequence heart rate independent. Partial preparation flip angles (e.g., of 45–60 degrees) were suggested, which allow for shorter delay times. However, this limited the dynamic range of signal response and it is no longer recommended ( Fig. 18.4 ).

The relationship between CM concentration and MR signal is not only dependent on the flip angle of the preparation pulse but also on the readout flip angle, as shown in Fig. 18.4 . To shorten the delay time, it is also important to place the readout of the data into phases of minimal cardiac motion, into late systole and mid-diastole, which is achieved with a delay time of about 120 ms. Because length of systole varies relatively little with a changing heart rate (as occurs during pharmacologically induced hyperemia), these delay times are robust to place the data collection into stable heart phases irrespective of heart rate. To further accelerate data collection, it was proposed to play out one single nonslice-selective 90-degree saturation pulse, and to acquire the entire stack of slices thereafter. With this scheme, however, the delay time varies from slice to slice, and consequently, CM sensitivity becomes dependent upon slice position and acquisition order, which is likely to affect data analysis. In a modified version of a saturation recovery preparation, the entire myocardium is prepared by a 90-degree saturation pulse except the slice which is immediately imaged after preparation (“notch technique”). With this scheme, the readout time for slice n equals the preparation time for the next slice, that is, slice n +1, and so on. This approach allows acquisitions of up to 7 slices every 2 heartbeats (at a heart rate up to 115 beats per minute). Currently, identical saturation recovery preparation of each acquired slice is recommended to allow for consistent signal response and easy data analysis.
Field Strength: 1.5 T Versus 3 T
Systematic data comparing the diagnostic performance of perfusion CMR at 1.5 T and 3 T are still sparse. Increasing the field strength from 1.5 T to 3 T increases the available magnetization, as was demonstrated in a study in volunteers, in which myocardial signal during the first pass (at 0.1 mmol/kg Gd-diethylenetriamine penta-acetic acid [DTPA] IV) was 2.6 times higher at 3 T than at 1.5 T (relative to baseline signal). However, this increase was observed in the anterior wall, whereas signal increased by only 1.7 times in the posterior wall. This inhomogeneous signal increase might be disadvantageous, and larger clinical trials would be required to demonstrate a potential advantage of perfusion imaging at 3 T. In a recent study, a novel spatiotemporal correlation approach was implemented (5× kt -SENSE) on a 1.5 T and a 3 T machine. In patients with suspected CAD, the 1.5 T and 3 T machines yielded spatial resolutions of 1.5 × 1.5 mm 2 and 1.3 × 1.3 mm 2 (with otherwise identical temporal resolution and coverage). The areas under the receiver operator characteristics (ROC) are under the curve (AUC) for CAD detection (defined as >50% diameter reduction on coronary angiography) were not different with 0.80 and 0.89, respectively ( P = .21), despite slightly higher SNR on 3 T, indicating that the high diagnostic performance of perfusion CMR at 1.5 T is hard to improve. Accordingly, in the EuroCMR registry, out of 27,781 examinations, only 5.9% were performed on 3 T machines, whereas 29.3% of all examinations were adenosine stress studies.
Analysis of Perfusion Data
With increasing experience, an observer will be able to visually differentiate hypoperfused regions from artifacts, both typically causing lower signal during first-pass conditions. However, the advantage of experience is traded for subjectivity, that is, reduced interreader reproducibility. Therefore a computer-assisted or automatic analysis of perfusion data would be highly desirable and could potentially render CMR perfusion analyses fully reproducible. Because many different analysis procedures are currently in use, some common definitions for analysis characteristics are proposed in Fig. 18.5 .

Visual Assessment
Although visual reading can provide accurate diagnoses, adequate reproducibility should not rely on individual experience but on standardized criteria that in particular would differentiate signal loss due to hypoperfusion from artifacts. This indicates that reading criteria should also assess image quality, which in turn depends on the pulse sequence, the CM type and dose, and, importantly, the experience and care in data acquisition. Signal loss in the subendocardium, which is most sensitive for perfusion abnormalities, can be caused by susceptibility artifacts occurring during the time window when CM concentration differs most between the blood pool and the myocardial tissue. Thus long persistence of signal loss during first pass is suggestive of the presence of true hypoperfusion in the subendocardium. However, these timing criteria also depend on the dose of CM injected, the injection rate and site, and the dispersion of the bolus within the pulmonary circulation. Currently, CM doses of 0.075 to 0.10 mmol/kg of a Gd chelate (with injection rates of 4–8 mL/s intravenously [IV]) are recommended and typically used in clinical routine. With such a setting, a reduced signal increase in the subendocardium lasting for ≥3 frames (i.e., during ≥3–6 heartbeats) during hyperemic first pass is highly suggestive for ischemia as established in trials on diagnostic performance. Most trials on outcome use this or similar criteria demonstrating an excellent prognostic power (for more details, see also Table 18.4 later). A signal reduction consistent with a territory supplied by an individual coronary artery is also supporting the diagnosis of CAD, whereas artifacts predominantly distribute along the phase direction (because spatial resolution is often reduced along phase) or may occur in regions with inhomogeneous magnetic field characteristics as observed in the inferior wall (where air is extending between diaphragm and inferior wall of the left ventricle). Criteria for quality assessment of perfusion data were derived from multicenter studies and validated for interobserver reproducibility in multicenter registry data, as given in Table 18.2 .
| Acquisition | Quality | Reading |
|---|---|---|
|
| The perfusion deficit is:
|
| Comments | ||
| The recommended acquisition parameters were derived from single-center and multicenter trials, which confirmed their high diagnostic performance | These quality criteria were derived from multicenter studies and were validated with multicenter registry data. Criteria are modified from Klinke et al. The maximum score is 9, which would indicate severe artifacts in 3 slices or more. A score <4 indicates good quality, scores 4–6 indicate intermediate quality (and AUC for CAD detection decreases by ~10% vs. good quality), scores >6 indicate inadequate quality | Visual reading criteria are derived from large single-center and multicenter trials and most studies on the prognostic power of perfusion CMR (as given in Table 18.4 ) use these or similar reading criteria. Perfusion deficits are typically assessed in the 17-segment AHA model (not including the LV apex) |
Quantitative Approach
Dedicated algorithms for perfusion data analysis would allow comparison of signal responses in an individual patient with a normal database, rendering the technique less observer dependent. Because myocardial signal response is strongly dependent on imaging parameters, a normal database should be updated in case the pulse sequence and/or the imaging parameters would be modified (e.g., by a hardware or software upgrade). On the basis of such a normal database, perfusion studies can be compared between patients, and even more importantly, the perfusion situation; that is, the activity or progression of CAD can be monitored by serial perfusion CMR studies in the same patient. To allow for better comparisons between various analysis strategies, it appears reasonable to clarify some confusion that may exist with expressions such as semiquantitative and semiautomatic. In Fig. 18.5 quantitative relates to the analysis output obtained as numbers (which may be related to perfusion or may represent perfusion itself). These aspects should be separated from the issue of how the data are extracted from the imaging set, which may occur manually (with considerable observer interaction with the data and corresponding time requirements), semiautomatically (with some observer interaction), or fully automatically. A fully automatic approach is time saving (no labor needed for analysis) and eliminates any observer variability, although it is anticipated that high-quality data would be required for an automatic approach. A quantitative approach is also ideal to generate ROC, which are the adequate means for assessment of test performance. Once a ROC curve has been determined (for a given acquisition and analysis protocol), the optimum cost-effectiveness of the protocol can be calculated (optimum point on the ROC), because cost-effectiveness changes with changing portions of false and true negatives and positives.
Quantitative Approach: Perfusion-Related Parameters
First-pass perfusion studies are typically performed during breath-holding, and therefore any type of quantitative analysis should start with a registration of the first-pass data over time: that is, motion in the data caused by breathing and/or diaphragmatic drift should be eliminated either by a manual procedure or by (semi-)automatic algorithms.
To improve SNR, cardiac perfusion studies are performed with phased-array coils. Therefore analyses of signal intensity–time curves have to correct for inhomogeneous coil sensitivities. For this purpose, it has been suggested to subtract precontrast signal from the first-pass signal intensities. However, signal reception by a phased array coil does not cause a constant offset of signal over the field of view; therefore a division of first-pass signal by precontrast signal for correction is required.
From the resulting signal intensity–time curves calculated for various transmural or subendocardial segments covering ideally the entire left ventricular myocardium, many parameters can be extracted. The applicability was demonstrated for the peak signal intensity, signal change over time (upslope), arrival time, time to peak signal, mean transit time, area under the signal intensity–time curve, and others. For the upslope of the signal intensity–time curve, a relatively close correlation with perfusion data is reported in both animal and human studies, at least for the low-flow range. Its robustness could also be demonstrated in a multicenter trial. This upslope parameter is relatively insensitive to CM recirculation because it uses the initial portion of the signal intensity–time curve only, which also reduces its sensitivity for motion (most patients are able hold their breath for this short time period). The upslope parameter is also proposed to correct for differences in arterial input by dividing myocardial upslope data by the blood-pool signal upslope. This approach is suboptimal for input correction because the upslope–CM concentration relationship is flat at higher CM concentrations, which occur in the blood pool during first pass and which are even higher during hyperemic condition. An experimental study demonstrated linearity between the upslope parameter and perfusion measured by microspheres for low perfusion values only (below approximately 1.5 mL/min/g) ( Fig. 18.6A ). A similar limitation for upslope estimates was described for humans using PET perfusion measurements as the standard of reference ( Fig. 18.6B ).

Quantitative Approach: Absolute Tissue Perfusion
For blood-pool CM, which do not mix homogeneously in the tissue compartment but are restricted to the intravascular compartment, the so-called bolus tracking approach can be applied, which is based on the central volume principle given by
VB=F×MTT
Because the conventional extravascular Gd chelates do not cross the intact blood-brain barrier, this model is generally used for cerebral perfusion measurements. Also, hyperpolarized 13 C-CM (see later) can act as an intravascular tracer ; hence, this model could be applied for cardiac studies using these CM.
In the myocardial tissue, however, the conventional Gd chelates behave as extravascular CM. Therefore the CM first-pass techniques with residue detection will be discussed next. It is assumed that CM diluted in blood enters the tissue via the artery, transits the capillaries, and leaves the tissue through the venous system. Then the Fick principle relates the CM concentration in the tissue to the arterial input and venous outflow by a convolution integral. This model takes both CM inflow and outflow into account and assumes a freely diffusible CM that is homogeneously mixed within a single tissue compartment. It is given by
CT(t)=F⋅∫0tCA⋅(τ)⋅e−F/λ(t−τ)dτ=CA(t)⊗F⋅e−F/λ⋅t
Related posts:
 Use of Navigator Echoes in Cardiovascular Magnetic Resonance and Factors Affecting Their Implementation
 Acute Myocardial Infarction: Cardiovascular Magnetic Resonance Detection and Characterization
 Atherosclerotic Plaque Imaging: Coronaries
 Cardiac Iron Loading and Myocardial T2*
 Pulmonary Vein and Left Atrial Imaging
 Noncardiac Pathology
Stay updated, free articles. Join our Telegram channel

Full access? Get Clinical Tree


