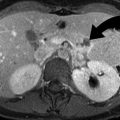
Fig. 18.1
Acute infarct. Diffusion-weighted images showing acute lacunar infarct (arrow) in posterior limb of right internal capsule
Less common etiologies, representing less than 5 % of acute stroke, include vasculopathies, immune-related diseases, hypercoagulable states, arterial dissection, global hypoperfusion, venous infarction, and mitochondrial disorders.
Concept of Penumbra
Once vascular supply to the brain has been compromised, there is a window of opportunity for reversing ischemic symptoms depending upon the level to which the blood flow has dropped. Normal cerebral flow ranges between 60 and 100 ml/100 g/min, with varying degrees of hypoperfusion seen at lower flow rates. Brain parenchyma can compensate for a decrease in perfusion by increasing oxygen extraction to a cerebral blood flow (CBF) of approximately 20–23 ml/100 g/min. While blood flow of 10–20 ml/100 g/min may be reversible for a period of hours, more severe perfusion deficit (below 10 ml/100 g/min) may lead to infarction within minutes. Ischemic brain tissue can functionally be divided into three components – infarct core, penumbra, and oligemic region (Fig. 18.2). When a cerebral artery is occluded, a core of brain tissue with severe perfusion deficit dies rapidly while the surrounding brain tissue (ischemic penumbra) with moderately reduced blood flow that may have lose electrical activity. Tissue in the penumbra may be salvageable with reperfusion; otherwise, the tissue in penumbra will progress to infarction. Mildly reduced blood flow to the oligemic region surrounds the penumbra and is more likely to survive unless perfusion is further hemodynamically altered.
Fig. 18.2
Schematic diagram shows an acute infarct and the surrounding penumbra
Imaging Workup of Acute Ischemic Stroke
In the past, imaging was primarily used to exclude hemorrhage and evaluate for surgically amenable lesions. The role of imaging has changed dramatically over the last decade and currently involves detection as well as extent of the infarct and penumbra.
Goals in acute stroke imaging are to assess the 4 “Ps” [2]:
Parenchyma: Assess early signs of acute stroke and rule out hemorrhage.
Pipes: Assess extracranial circulation and intracranial circulation for intravascular thrombus, occlusion, and severe stenosis.
Perfusion: Assess cerebral blood volume, cerebral blood flow, and mean transit time (MTT).
Penumbra: Assess tissue at risk of dying if ischemia continues without recanalization.
CT imaging, including noncontrast CT (NCCT), CT angiography (CTA), and CT perfusion (CTP), are the most often the initial imaging modalities in stroke evaluation. At our institution, NCCT followed by CTA is the initial study in stroke evaluation. CTP is performed in select cases to help stratify patients for treatment.
Noncontrast CT
Sensitivity of NCCT is 60–70 % in the first 3–6 h, and virtually all infarcts are seen by 24 h. Despite its relative insensitivity to acute infarcts in the emergency setting, NCCT remains the widely used initial imaging study in acute stroke. It is used to rule out intracranial hemorrhage and other stroke mimics.
CT signs of early ischemia include (Fig. 18.3):
Fig. 18.3
CT signs of acute infarction. (a) Noncontrast CT showing hyperdense clot in the left M1 segment (arrow) of middle cerebral artery (hyperdense MCA sign). CTA (not shown) confirmed MCA occlusion. (b) Noncontrast CT shows loss of grey-white matter differentiation (arrow) at the insula (insular ribbon sign). (c) Noncontrast CT shows subte hypodensity in posterior aspect of left lentiform nucleus (arrow). (d) Noncontrast CT shows hypodensity involving both gray and white matter in left occipital lobe (PCA territory) (arrow)
Dense artery sign: Acute thrombus or embolus in a cerebral artery may produce linear hyperdensity in the vessel affected. Hyperdense MCA sign is associated with large MCA territory infarct and is seen in one-thirds of the hyperacute infarcts. MCA “dot” sign refers to hyperdensity in distal MCA and its branches in sylvian fissure.
Loss of gray–white differentiation: In MCA territory infarcts, there is often obscuration of lentiform nucleus (basal ganglia are more sensitive to ischemia due to their end-artery blood supply) and insular ribbon sign (insula is especially sensitive to ischemia due to its distance from collateral flow). Peripherally, acute infarction results in loss of definition of regions of cortex (cortical sign) in the affected vascular territory.
Hypodensity: This becomes more apparent and well circumscribed by 24 h. Variable amount of cerebral swelling develops after 24 h, usually peaks at 3–5 days. The degree of swelling depends on the restoration of flow.
The detection of early acute ischemic stroke on NCCT may be improved by using variable window width and center level settings to accentuate the contrast between normal and edematous tissue [3]. Multiplanar reformats may also help in identifying subtle infarcts (e.g., coronal reformats for superior cerebellar infarcts).
CT Angiography
CTA is fast and noninvasive and allows for evaluation of etiology of acute ischemic stroke (such as thrombosis, occlusion, severe stenosis, and dissection). Both source images and 3D images should be reviewed. Though not very accurate, clot morphology like ulceration can also be assessed. When calcified plaques are present, the window can be widened for better evaluation.
CT Perfusion
CTP is a functional imaging technique that can be rapidly performed to evaluate ischemic but potentially salvageable penumbral tissue. CTP is based on the entry and washout of an intravenous iodinated bolus of contrast.
Severely diminished cerebral blood volume (CBV) has been demonstrated as a good correlate to the area of restricted diffusion on MRI and hence is considered a measure of the infarct core. Decreased cerebral blood flow (CBF) and increased mean transit time (MTT) are seen in areas of the brain either at risk for or undergoing infarct. Occasionally, increased CBV (luxury perfusion) may be seen in ischemic region due to autoregulatory vasodilatation and recruitment of collateral vessels. The combination of low CBF and normal/increased CBV represents an area at risk for ischemia (penumbra) but currently compensated by dilated collateral vessels (Fig. 18.4).
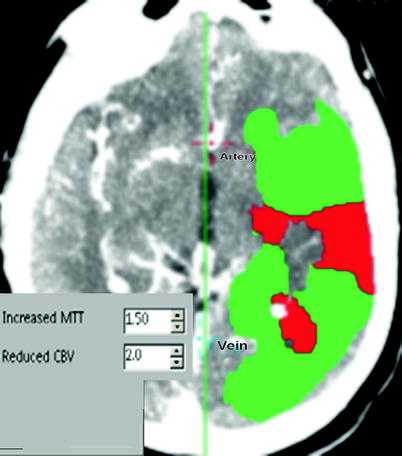
Fig. 18.4
Color-coded summary maps from CT perfusion study showing large penumbra (shown in green) in the left MCA territory. The red color indicates severely reduced cerebral blood volume
MR Imaging
MR imaging is more sensitive and specific than CT for detection of acute stroke. The most sensitive imaging sequence for detecting ischemia is diffusion-weighted MR imaging (DWI), with changes in acute infarction detected within minutes of onset of the symptoms. Cytotoxic edema of acute ischemia results in reduced water diffusion in the extracellular matrix. DWI detects this restriction of microscopic motion.
Acute infarct is seen as bright signal intensity on DWI due to restricted diffusion as well as secondary to increased water content (T2 effect), with corresponding decrease on apparent diffusion coefficient (ADC) sequence (Fig. 18.5a). DWI is positive in the acute phase with increasing intensity that peaks at 7 days. The time to normalization of DWI signal has been reported in literature to range from 14 to 72 days [4, 5]. ADC sequence initially has low signal intensity, with maximum hypointensity occurring at 24 h. Signal intensity then increases and normalizes between the 7th and 11th days [6].
Fig. 18.5
Acute infraction on MRI. (a) Acute right PCA territory infarct which is not apparent on T2-weighted sequence, is clearly seen on DWI (arrow). (b) T2-weighted sequence shows acute left PCA territory infarction (arrows). (c) Left ICA occlusion: T2-weighted sequence shows hyperintense signal within left ICA (arrow), indicating the presence of thrombus in the arterial lumen
Additional findings in acute infarct include the presence of lesion in arterial distribution, hyperintense signal on T2-weighted and fluid-attenuated inversion recovery sequence, subcortical white matter hypointensity on T2-weighted sequence (Fig. 18.5b), exaggerated intravascular enhancement, and findings of vascular occlusion (lack of normal flow void on long TE sequence and high arterial signal on FLAIR sequence related to slow flow/occlusion) (Fig. 18.5c). However, T2 signal can be normal in the first 8 h after ictus. With time, infarcts become hyperintense on T2-weighted sequence, with maximum hyperintensity reached between 7 and 30 days.
MR Perfusion Imaging
MR perfusion imaging techniques include exogenous contrast-enhanced method or an endogenous method (arterial spin labeling). Exogenous dynamic susceptibility-weighted (T2*-weighted) sequence is the most commonly used technique in acute stroke evaluation. The technique involves tracking of the tissue signal loss caused by T2* effects of paramagnetic contrast agent to create a hemodynamic time–signal intensity curve. As in dynamic CT perfusion imaging, various parametric maps (CBV, MTT, CBF, TTP) are calculated from this curve by using a deconvolution technique. The core of infarct demonstrated by restricted diffusion is compared against CBF or MTT maps for mismatch which represents the penumbra, tissue at risk (Fig. 18.6).
Fig. 18.6
Acute infarction on MR. (a) Diffusion-weighted sequence shows a hyperintense acute infarct in the right MCA territory. (b) MR perfusion image shows a large defect (arrows), suggesting the presence of a penumbra
Hemorrhagic Transformation
Hemorrhagic transformation of an infarct is a rare (3.6 %) complication in the acute phase. It is thought to be due to reperfusion of ischemic tissue during the first 2 weeks, occurring more commonly in larger infarcts and cardioembolic infarcts. Anticoagulant and thrombolytic agents increase the incidence of hemorrhagic transformation.
The European Cooperative Acute Stroke Study (ECASS) classification of hemorrhagic transformation stratified the size of these hemorrhages with the clinical outcome [7].
HI (hemorrhagic infarct) (Fig. 18.7): petechial hemorrhages without space-occupying effect
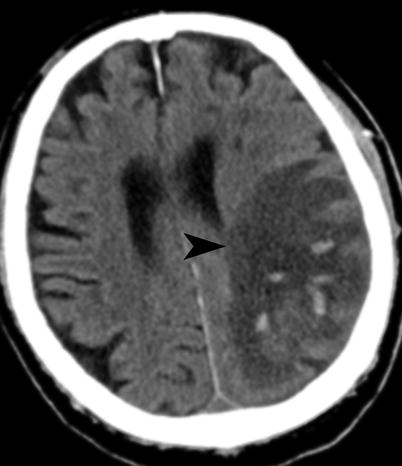
Fig. 18.7
Acute infarct with hemorrhage. Noncontrast CT shows petechial hemorrhages with left parietal infarct (arrowhead) (ECASS HI2)
HI1: small petechiae
HI2: more confluent petechiae
PH (parenchymal hematoma) (Fig. 18.8): hemorrhage (coagulum) with mass effect
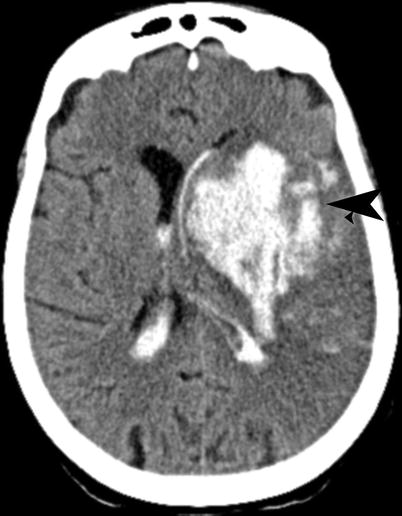
Fig. 18.8
Acute infarct with hemorrhage. Noncontrast CT shows intraparenchymal as well as intraventricular hemorrhage (arrow) within left MCA territory infarction (ECASS PH2), following IV tPA
PH1: <30 % of the infarcted area with mild space-occupying effect
PH2: >30 % of the infarcted area with significant space-occupying effect
Only PH2 independently modifies the risk of a worse clinical outcome both early and late after stroke onset. PH-1 has increased risk of early deterioration but not of a worse long-term outcome. HI is not associated with worse early or late outcome [8].
Infarction from Septic Emboli
This is a subset of embolic infarctions, mostly seen with intravenous drug abuse, infective endocarditis, and cardiac valve abnormalities. The most common MRI finding in early stages of septic emboli is that of ordinary embolic infarction. Eventually changes related to infection show up, with disproportionate edema, enhancement, cerebritis, and finally frank abscess formation. Like other embolic infarctions, these show a higher tendency to bleed.
Watershed Infarction
Watershed or boundary zone infarctions occur from hypoperfusion at the junction between arterial territories and have two patterns (Fig. 18.9):
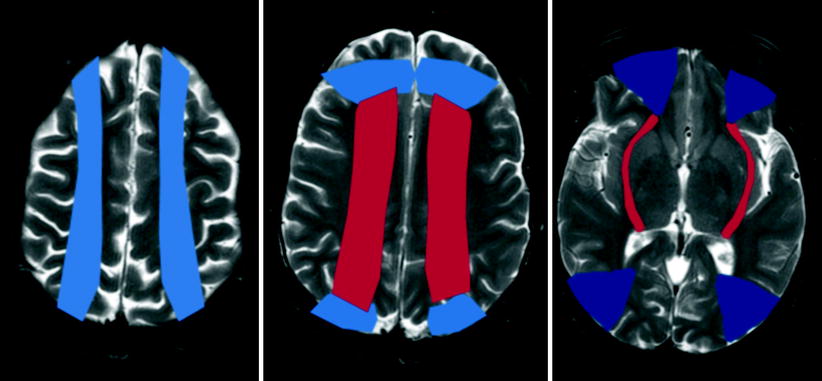
Fig. 18.9
Schematic representation of the superficial (colored red) and internal (colored blue) watershed zones in the cerebral hemispheres
Superficial border zone: These are infarctions of the cortex and adjacent white matter located at the boundary zone between leptomeningeal collaterals from adjacent arterial territories (ACA/MCA, MCA/PCA, and ACA/PCA).
Internal border zone: They occur in the corona radiata and centrum semiovale, between lenticulostriate perforators and the deep-penetrating cortical branches of the MCA and between deep white matter branches of the MCA and the ACA.
Infarct Evolution
Subacute stage approximately extends from 2 to 14 days following the initial ischemic event. In this stage the infarcts become better circumscribed. Mass effect peaks by 3–5 days and then diminishes. When there is hemorrhagic transformation, MR signal characteristics of blood change with age. Contrast enhancement seen typically in this stage can be gyral or patchy (Fig. 18.10). It typically begins toward the end of the first week, when mass effect has resolved, and persists for approximately 6–8 weeks. This discordance between enhancement and mass effect is a useful radiologic observation, because enhancing lesions with significant mass effect is unlikely to represent cerebral infarction [9].