There are many challenges involved in obtaining diagnostic MR images of the foot and ankle. The complex anatomy and morphology, with curved and angular structures localized to the periphery of the body, make for an inherent challenge, let alone if an added level of complexity, such as orthopedic instrumentation, is added. This review outlines the technical considerations best designed to produce diagnostic images of the foot and ankle, with an emphasis on the postoperative state, including imaging in the presence of metal.
Key points
- •
MR imaging can be optimized to image the foot and ankle in both the preoperative and the postoperative settings.
- •
Contrast-enhanced MR angiographic techniques can be used for vascular mapping of the foot and ankle.
- •
Appropriate MR technique modifications can provide diagnostic image quality even in the setting of metal.
Introduction
There are many challenges involved in obtaining diagnostic MR images of the foot and ankle. The complex anatomy and morphology, with curved and angular structures localized to the periphery of the body, make for an inherent challenge, let alone if an added level of complexity (orthopedic instrumentation) is added. This review outlines the technical considerations best designed to produce diagnostic images of the foot and ankle, with an emphasis on the postoperative state, including imaging in the presence of metal.
Imaging the preoperative foot and ankle
Non-contrast-enhanced fast spin-echo proton density–weighted sequences have largely become the workhorse in MR imaging of the musculoskeletal system and have been validated against surgical arthroscopic standards. A long repetition time (≥3500 milliseconds) and moderate echo time (TE; 28–34 milliseconds) result in differential contrast between articular cartilage and fluid, producing an inherent “arthrographic effect” without the additional complicating diagnostic hindrances that can accompany a direct MR arthrogram (contrast extravasation into the surrounding soft tissues, air bubbles in the joint being confused as intra-articular bodies, and so forth). These standard sequences are used in foot and ankle imaging as well; however, some limitations arise due to the curved anatomy and morphology of structures about the foot and ankle, specifically with regard to ligaments and tendons.
At the author’s institution, which mostly sees populations of sports injuries, arthritis, and foot deformities, the default imaging sequences are outlined in Tables 1–3 . The inherent magnetization transfer properties induced between slices in fast spin-echo, moderate TE imaging, produce relative increased signal intensity from simple fluid. This results in a distinct contrast between higher signal intensity fluid and intermediate signal intensity of articular cartilage, preventing the need to administer intra-articular or intravenous contrast material for routine anatomic imaging. This noninvasive approach, combined with dedicated surface coils, works to provide optimum image quality ( Fig. 1 ).
| Sagittal IR Inversion Time 150 | Sagittal PD | Coronal PD | Axial PD | |
|---|---|---|---|---|
| TR | 4000 | 4500 | 5000 | 5000 |
| TE | 13–15 | 25 | 25 | 24 |
| ST | 3.3 | 3.0 | 4.0 | 3.3 |
| ETL | 10 | 12 | 12 | 12 |
| FOV | 180 | 150 | 110 | 130 |
| Matrix | 256 × 192 | 512 × 384 | 512 × 384 | 512 × 256 |
| NEX | 2 | 2 | 2 | 2 |
| Coronal IR Inversion Time 150 | Coronal PD | Axial PD | Sagittal PD | |
|---|---|---|---|---|
| TR | 4500 | 4500 | 4500 | 5000 |
| TE | 16 | 27 | 26 | 25 |
| ST | 3.0 | 2.0 | 3.0 | 4.0 |
| ETL | 12 | 14 | 18 | 14 |
| FOV | 160 | 150 | 110 | 160 |
| Matrix | 256 × 192 | 512 × 320 | 512 × 320 | 512 × 256 |
| NEX | 2 | 2 | 2 | 2 |
| Coronal IR Inversion Time 170 | Coronal PD | Axial PD | Sagittal PD Lesser Toes | Sagittal PD Hallux | |
|---|---|---|---|---|---|
| TR | 6200 | 5500 | 6700 | 4100 | 6100 |
| TE | 18 | 25 | 25 | 25 | 25 |
| ST | 2.5 | 2.0 | 2.8 | 2.5 | 1.2 |
| ETL | 12 | 12 | 16 | 14 | 12 |
| FOV | 160 | 120 | 120 | 140 | 140 |
| Matrix | 256 × 192 | 512 × 384 | 512 × 384 | 512 × 384 | 512 × 256 |
| NEX | 1 | 1 | 1 | 1 | 1 |
Dedicated surface coils help to improve spatial resolution and field homogeneity, notably when imaging smaller structures such as the foot and ankle. Either a quadrature (circular polarization) knee coil or an 8-channel phased array dedicated foot and ankle coil are suggested to achieve adequate signal to noise. Images are typically obtained with the foot in neutral position, without excessive dorsiflexion or plantarflexion, although some authors have proposed imaging the foot and ankle in positions that may maximally stress regional tendons and ligaments, such as ballet dancers en pointe, in weight-bearing maximum plantar flexion. Kinematic MR examination has also been explored for the evaluation of ankle ligament integrity.
The magic angle effect, often noted in MR interpretation of the rotator cuff of the shoulder, can contribute to a degree of uncertainty when interpreting images of the foot and ankle, and it is always critical to keep this phenomenon in mind when analyzing the status of ligaments and tendons. The magic angle effect is a phenomenon of MR physics and accounts for signal changes that can be seen in anisotropic tissues, including the ordered collagen bundles that comprise tendons. It occurs when the collagen bundle orientation is 55° to the main magnetic field (z-axis). The artifact mimics tendon degeneration in that it is visible on sequences with short TEs such as the T1- and proton density–weighted sequences used commonly when imaging the musculoskeletal system, but becomes less apparent on MR sequences with longer TE values (>37 milliseconds) such as T2-weighted and short tau inversion recovery (STIR) images. When the tendon is oriented at approximately 55° to the main magnetic field, the artifact will be visible in all imaging planes. At the author’s institution, we have subjectively found that the addition of axial STIR images positively contributes to the diagnostic interpretation of the status of ankle tendons, and this finding has been independently validated by Srikhum and colleagues. Other ways to minimize this peculiarity include imaging the foot in slight (20°) plantar flexion.
STIR imaging to evaluate for areas of bone marrow edema pattern in the ankle is suggested, especially when contrasted with frequency selective fat-suppressed (usually T2) weighted images. The curved nature of the structures about the foot and ankle combined with the location of the foot and ankle at the periphery of the bore of the magnet, away from isocenter, results in inherent magnetic field inhomogeneities, which become accentuated when using frequency selective fat suppression as opposed to STIR imaging, certainly in the presence of metal.
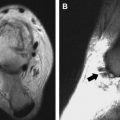
Obtaining images in the standard 3 planes: axial, sagittal, and coronal, is usually satisfactory for diagnosing most abnormalities about the foot and ankle; however, “coronal” images of the ankle are often somewhat angled, obtained at a plane parallel to the talonavicular joint to optimize visualization of the slightly obliquely oriented major ankle ligamentous stabilizers. This provides a satisfactory plane of imaging for most abnormalities; however, it can often incompletely demonstrate intra-articular abnormality such as an osteochondral lesion (osteochondral fracture, osteochondritis dissecans). In such cases, a true “straight” coronal parallel to the ankle joint (long axis of the tibia) is preferred for more detailed evaluation ( Fig. 2 ).
For optimal imaging in the foot, consideration must be paid to targeted fields of view and tailored imaging planes. Moreover, terminology for imaging planes in the foot often varies from institution to institution. In many institutions, planes in the foot are prescribed with respect to the foot itself, with axial oriented perpendicular to the sole of the foot (short axis) and coronal images oriented parallel to the sole of the foot (long axis). In other institutions, planes are prescribed with respect to the body, with axial images oriented both axial to the body and parallel to the sole of the foot, and with coronal images oriented both coronal to the body and perpendicular to the sole of the foot. Imaging of the foot is often optimized by focusing on a specific portion of the foot, that is, the ankle/hindfoot, midfoot, or forefoot (see Tables 1–3 ). This facilitates smaller fields of view and high spatial resolution imaging of the area of interest. In addition, it provides the opportunity to tailor imaging planes to anatomy of interest. For example, images in the hindfoot can be oriented to the subtalar joint; images in the midfoot can be oriented to the tarsometatarsal joints and metatarsal bones, and images of the forefoot can be oriented to the metatarsal heads or metatarsophalangeal joints. When necessary, oblique sagittal images can be oriented along a specific ray of interest. Techniques for imaging for Morton neuroma, with the patient in the prone position, have also been described.
Nowadays, most imaging centers have a choice of 1.5-T and 3.0-T magnets. MR imaging at 3.0 T results in nearly twice the signal-to-noise ratio (SNR) compared with 1.5 T, usually accompanied by concomitant advantages of improved gradient performance and wider bandwidths. Overall, imaging at 3.0 T results in higher spatial resolution and increased contrast-to-noise ratios, usually with significant decreases in scanning time when combined with software that results in higher acceleration factors (parallel acquisition techniques). Slight modifications of imaging parameters are required, however, when translating protocols from 1.5 T to 3.0 T, as T1- and T2-relaxation times are slightly different at the differing field strengths.
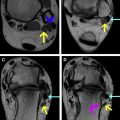
Additional MR sequences can be tailored to the specific clinical question. Gradient echo imaging, for example can be of use in certain specific diagnostic considerations. In children, 3-dimensional spoiled gradient echo imaging with fat suppression (3D-SPGR) has been shown to depict the morphology of the regional physes accurately and should be used (ideally in 2 planes, usually sagittal and coronal) to evaluate the integrity of the physes (physeal bars) in the setting of pediatric ankle fractures. In addition, T2*W multiplanar gradient echo imaging (MPGR) demonstrates significant “blooming” artifact in the setting of pigmented villonodular synovitis (PVNS), thus contributing to making this diagnosis ( Fig. 3 ).