8 The Adrenal Glands
M. Taupitz and G.P. Krestin
Introduction
Despite their small size and total weight of only 11 g, the adrenal glands are complex hormone-producing organs. As such, they are affected by dysregulation of the endocrine system, resulting in clinically manifest hormonal disorders and morphologic changes that can be detected by imaging. In addition, several nonfunctioning benign and malignant tumors can arise in the adrenal glands. Previously undetected adrenal adenomas are identified in 2–10 % of the population, and up to 26 % of patients with advanced extra-adrenal primary malignancies have adrenal metastases. Adrenal masses that can be demonstrated by imaging are present in ca. 9 % of individuals.1,2 Unsurprisingly, adrenal incidentalomas are common findings on abdominal imaging studies performed for other reasons. Characterization of such incidental adrenal masses is especially important in patients with a known extra-adrenal malignancy as it is likely to affect their further management.
Indications
The adrenal glands are visualized and evaluated in all MRI examinations of the abdomen or upper abdomen. Scrutinizing the adrenal glands for the presence of metastasis is especially important in patients who undergo MRI for a suspected or known malignancy.
A dedicated MRI examination of the adrenal glands is indicated in the following situations:
- Known extra-abdominal malignancy and indeterminate adrenal mass detected by other imaging modalities.
- Characterization of renal incidentaloma.
- Diagnostic work-up of patients in whom an adrenal mass is suspected on clinical grounds, e. g., hyperaldosteronism, Cushing syndrome, or hypertension.
Imaging Technique
See the respective sections in Chapter 1 for patient preparation, positioning, and coils. The usual axial sequences should be supplemented by a coronal sequence to define the relationship to the diaphragmatic crura. An additional sagittal sequence may be necessary to separate an adrenal lesion from the upper renal poles.
Pulse Sequences
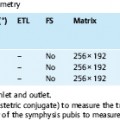
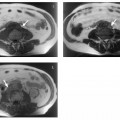
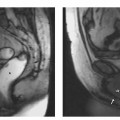
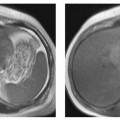
If the adrenal glands are to be included in an MRI examination of an upper abdominal organ (e. g., kidneys, pancreas, liver), it is important to acquire both in-phase (IP) and opposed-phase (OP) T1w GRE images (Fig. 8.1). Otherwise, the pulse sequences used for MRI of the liver or the kidneys (see the respective sections in Chapters 1 and 7) are also suitable for adrenal MRI. The respiratory-triggered, fat-suppressed axial T2w TSE sequence suggested for upper abdominal MRI also yields images with excellent detail of the adrenal glands. Additional coronal and sagittal images should be acquired with a single-shot T2w TSE sequence (e. g., HASTE), which is characterized by short scan times and robustness to artifacts (Fig. 8.2, Table 8.1).
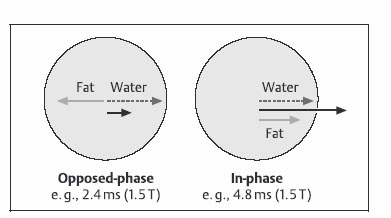
Fig. 8.1 Principle of opposed-phase (OP) and in-phase (IP) imaging. Because water and fat protons have slightly different precession frequencies, the amplitude of the echo in a GRE sequence is modulated (“beats”) in an environment consisting of a finely dispersed mixture of water and fat (as in a typical adrenal adenoma). Under OP conditions, the signal contributions of water and fat are subtracted in a volume element, resulting in low SI (left). Under IP conditions, the signal contributions are added together, resulting in high SI (right).

The acquisition of IP and OP images for identifying intracellular lipid is frequently referred to as chemical shift imaging (CSI) and must not be confused with spatially resolved MR spectroscopy, which is also designated as CSI. The latter is not used for MRI of the adrenal glands. IP and OP images can be acquired with two successive sequences or simultaneously using a double-echo sequence, which is available on newer scanners. Comparison of IP and OP signal intensities is especially important for evaluation of adrenal masses because it allows detection of finely dispersed intracellular lipid, which is highly characteristic of adrenal adenoma and rules out a malignant tumor with a high degree of likelihood.3–5
Contrast Media
The precontrast sequences can be supplemented by a dynamic series performed after intravenous injection of nonspecific Gd-based contrast medium (e. g., Dotarem, Magnevist) at a standard dose of 0.1 mmol Gd per kg body weight. For details on nonspecific MR contrast media and the dynamic study protocol see the respective sections in Chapter 1. The postcontrast series is acquired using a conventional T1w GRE sequence with an IP echo time. Alternatively, the dynamic series can be performed using a 3D GRE sequence (e. g., VIBE). Images are acquired at the usual postcontrast time points for upper abdominal MRI: arterial phase at 15 s, portal venous phase at 55–60 s, and delayed phases at 2 and 5 min, optionally also at 10 min. If a double-echo T1w GRE sequence is available for IP/OP imaging, it can also be used for the dynamic series. Lipid-containing tumors such as adrenal adenoma may fail to enhance or even decrease in signal intensity on OP images acquired after contrast administration,6 while they increase in signal intensity on IP images. This paradoxical phenomenon is attributed to the fact that the contrast medium predominantly distributes in the watery compartment, resulting in a shift in signal contributions from fatty and watery compartments on OP images. No diagnostic benefit of this effect is known.
Image Analysis
Determination of signal intensities on IP and OP images as well as on T2w images plays an important role in the MRI characterization of adrenal masses. Various quantitative methods have been proposed for region of interest (ROI) measurements in adrenal masses and, depending on the method, in an adjacent reference tissue.4 Quantitative analysis is time-consuming and the results depend on the magnetic field strength and other technical parameters; published results and cut-off values for differentiating adenoma from malignant adrenal tumors may therefore not be directly applicable to every situation. Moreover, regressive changes and hemorrhage can alter the signal intensities of both benign and malignant tumors. Quantitative approaches were primarily pursued and favored in the early era of adrenal MRI, but are no longer considered to be superior to simple visual analysis. Some of the formulas proposed are briefly outlined below.
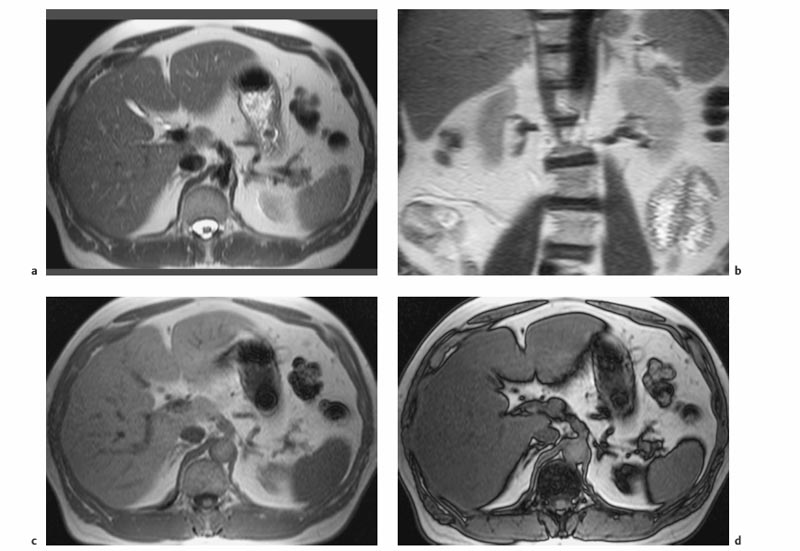
Fig. 8.2a–d Normal adrenal glands. a, b Breath-hold axial (a) and coronal (b) T2w HASTE images. c, d IP (c) and OP (d) images acquired simultaneously using a breath-hold axial T1w double-echo GRE sequence (1.5 T). Both adrenal glands are depicted as delicate structures.
The ROIs used for measuring signal intensity are placed in a homogeneous, solid area of an adrenal lesion and should be as large as possible while excluding partial volume effects and motion artifacts.
Tsushima et al. proposed an index of signal intensities (SI) calculated from IP and OP images as follows7:
Index = ([SIIP – SIOP]/SIIP) × 100 %.
An index > 5 % is assumed to indicate a significant lipid component. A more straightforward way to quantify signal intensity is to calculate the percentage signal difference (SI%) between OP and IP images:
SI% = 100 – (SIOP ×100/SIIP).
An SI difference < 5 % calculated according to this equation is assumed to rule out a significant lipid component in an adrenal mass; a difference > 25 % is taken as positive evidence that a lesion contains lipid. Other SI ratios were investigated by Fujiyosji and coworkers and found to be of little diagnostic value.4
Other techniques use T2w signal intensities to separate benign and malignant adrenal lesions.8,9 One approach is to relate the signal intensity of an adrenal tumor on fat-suppressed T2w images (SIT) to that of a comparable area in the back muscle (SIM), the spleen (SIS), or the liver (SIL). Relative signal intensity can thus be calculated for inter-individual comparison (e. g., SIrel = SIT/SIM). Because MR signal intensities of the liver and spleen are often altered by diffuse conditions (steatosis) or storage diseases (hemosiderosis), and because the fat signal is reduced to variable degrees when a fat suppression technique is used, SIrel should be calculated in relation to muscle. An SIrel cut-off value of 3.5 was found to be highly sensitive and specific for the identification of adrenal adenomas.
If dynamic contrast-enhanced images are used to characterize an adrenal mass, signal intensities are determined at different time points after contrast administration (SIt) and compared with the precontrast signal intensity (SIpre). Dynamic contrast ratios (SIdyn = SIt/SIpre) can thus be plotted over time. According to Krestin and coworkers,10 an early and persistent signal increase (SIdyn > 2) characterizes a malignant adrenal mass, whereas moderate enhancement (SIdyn <2) with complete washout after 10 min indicates a benign lesion. The cut-off values for this method vary with the field strength, scanner, and sequence used.
With some experience and training, every radiologist can acquire the skill to analyze images qualitatively and achieve the same results as with a quantitative analysis. The presumptive diagnosis of a benign tumor can be established if an adrenal mass or most of it appears markedly hypointense on OP images compared with the IP images. On T2w images, very high signal intensity is suggestive of a malignant adrenal tumor. On dynamic contrast-enhanced images, a moderate increase in signal intensity, which drops again within a few minutes, suggests a benign mass, whereas intense and persistent signal enhancement indicates a malignant process.
Anatomy and Normal MRI Appearance
The adrenal glands are located lateral to the vertebral bodies at the level of the 11th to 12th rib and are enclosed by the upper portion of the Gerota fascia. They have the shape of an inverted Y or T. Embedded in perirenal fat, the adrenals are clearly demarcated from surrounding structures. The right adrenal gland lies above the upper renal pole, medial to the posterior contour of the right hepatic lobe, and lateral to the right crura of the diaphragm. Anteriorly, it borders on the inferior vena cava. The left adrenal gland comes to lie anteromedial to the upper pole of the left kidney, lateral to the left crura of the diaphragm, posterolateral to the aorta, and posteromedial to the splenic vessels and pancreas.
On MRI, the adrenal glands are clearly demarcated from surrounding high-signal-intensity retroperitoneal fat on non-fat-suppressed T1w and T2w images. In most patients, the two glands can be easily identified on MRI. When little or no intra-abdominal fat is present, as in very slim or cachectic patients, identifying the adrenal glands may be difficult. They may also be difficult to detect in extreme hepatomegaly or when an adjacent mass such as a renal tumor is present. In patients with portal hypertension, a dilated left diaphragmatic vein may mimic thickening at the anterior border of the left adrenal. The true nature of vascular structures is revealed when flow-related signal loss can be demonstrated, which is most obvious on single-shot TSE sequences.
On all conventional pulse sequences, a normal adrenal gland is of uniform low to intermediate signal intensity, slightly above that of paravertebral muscles and slightly below that of the liver and renal cortex. As the adrenal gland contains fat, it loses signal intensity on OP images compared with IP images.5 Following administration of nonspecific Gd-based contrast medium, the adrenal glands enhance early and washout within ca. 5 min.11
MRI Appearance of Pathologic Entities
The first sign of a pathologic process of an adrenal gland is a pronounced contour distortion. Small adrenal lesions (< 1 cm) can be detected by MRI using surface coils and breath-hold acquisition to eliminate artifacts.
Adrenal tumors can arise in the cortex or medulla and cause no overt clinical symptoms if they are nonfunctioning. Functioning masses become apparent due to clinical manifestations associated with hormonal hypersecretion or hyposecretion. Primary or secondary functioning adrenal masses can be diagnosed with clinical tests. MRI is not a first line modality in this setting but may occasionally provide useful findings for further treatment.
Characterizing a nonfunctioning adrenal mass is a complex task. Such lesions are incidentally detected on abdominal CT scans in ca. 0.6–1.3 % of patients.12 At autopsies, incidentalomas are detected in 1.4–64.5 % of cases.13 They can range in size from 0.5 to 6.0 cm and are typically nonfunctioning adenomas. In patients with a known metastatic tumor such as lung cancer, it is important to establish the benign character of an incidentally detected adrenal mass and rule out a metastasis.
Benign Conditions
Adrenocortical Insufficiency
Stay updated, free articles. Join our Telegram channel

Full access? Get Clinical Tree


