In 1900, cancer trailed typhoid fever, malaria, smallpox, measles, scarlet fever, whooping cough, diphtheria, croup, influenza, dysentery, erysipelas, tuberculosis, sexually transmitted disease, meningitis, acute bronchitis, pneumonia, accidents, birth injuries, and violence as a cause of death in children in the United States (1,2). Cancer mortality constituted only 0.43% of mortality from all causes for children (1).
At the beginning of the twenty-first century in economically developed countries, many children die every year from preventable incidents such as traffic accidents, intentional injuries, drowning, falls, fire, and poisoning. The leading cause of death in children older than 1 year is murder by a close relative. Cancer in children has become a significant problem compared with other causes of childhood mortality (3). There were 12,486 new cases of cancer among children of age 1 to 14 years in the United States in 2005 (4,5). In 15- to 19-year-olds for the period 2001 to 2005 there were 5740 new cases. Cancer is the leading natural cause of death among children between the ages of 1 and 14 years in the United States (Table 1.1) (6). For the youngest children, however, cancer is not a major cause of mortality (7). The leading causes of death in infants are congenital anomalies, disorders related to short gestation and low birth weight, and sudden infant death syndrome. In late adolescence, homicide surpasses cancer as a cause of death.
The mortality rate from cancer for children is approximately 3 deaths per 100,000 population per year (5). In the United States, there are approximately 100 cancer deaths per year in 0- to 1-year-olds, 500 in 1- to 4-year-olds, and 1100 in 5- to 14-year-olds (Figs. 1.1 and 1.2) (8,9).
Table 1.1 Ten Leading Causes of Death among US Children Aged 1-14 years, 2005
Rank
Cause of Death
Number of Deaths
Total Deaths (%)
1
Accidents (unintentional injuries)
4079
36
2
Cancer
1377
12
3
Congenital anomalies
918
8
4
Assault (homicide)
718
6
5
Heart disease
403
4
6
Intentional self-harm (suicide)
272
2
7
Influenza and pneumonia
216
2
8
Septicemia
166
2
9
Chronic lower respiratory disease
160
1
10
Cerebrovascular disease
157
1
Data from Jemal A, Thomas A, Murray T, et al. Cancer statistics. CA Cancer J. Clin. 2008;58:71-96.
Although cancer is a major cause of childhood death in developed countries, it continues to trail infections as a cause of mortality in developing countries (10, 11, 12, 13, 14). In many parts of the world, nutrition, housing, climate, and sanitation conditions create childhood mortality statistics similar to those reported for industrialized countries in the early twentieth century. However, it is likely that future improvements in the standard of living, the success of immunization programs, and dissemination of medical services will make inroads against infectious disease and thereby make childhood cancer a major cause of death in developing nations. Finally, there is almost certainly some variation in childhood cancer rates between countries because of differing abilities to diagnose and treat cases.
RELATIVE FREQUENCY OF THE VARIOUS TYPES OF CHILDHOOD CANCER
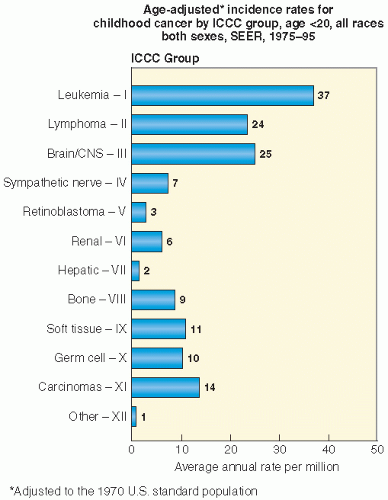
The relative frequency of the various types of childhood cancer is influenced by whether we are examining incidence or mortality and by how we stratify by age, sex, or nation. Among the most commonly used data are those of the Surveillance, Epidemiology, and End Results (SEER) program. SEER is a project of the Biometry Branch of the U.S. National Cancer Institute (NCI). The program draws data from several population-based cancer reporting systems covering approximately 10% of the total population of the United States (5,6,15). The adjusted relative frequency of the common forms of childhood cancer from SEER is shown in Table 1.2. Leukemias, brain and spinal tumors, lymphomas, sympathetic nervous system tumors (neuroblastoma), kidney (Wilms) tumors, and soft tissue and bone sarcomas are the most common childhood cancers. The common epithelial tumors of adults are rare in children (Fig. 1.3).
Figure 1.1 Age-adjusted US incidence rates for childhood cancers by International Classification of Childhood Cancer (ICCC) Group, age <20 years, all races, both sexes, SEER, 1975-1979 (http://seer.cancer.gov).
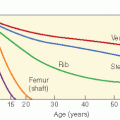
Of the cancers that do afflict children, some are more common in specific age groups. For example, neuroblastomas are more common in infancy. The ratio of non-Hodgkin lymphoma to Hodgkin disease favors non-Hodgkin lymphoma in younger children, but the reverse is true in adolescents. There is a steep rise in bone cancers among children aged 11 through 15, which coincides with the adolescent growth spurt. The most common tumors of neonates (younger than 28 days of age), for example, are teratomas, retinoblastoma, rhabdomyosarcoma, and neuroblastoma (16,17). In 15- to 20-year-olds, the list is headed by lymphoma (25%), epithelial tumors (18%), and bone malignancies (15%), followed by leukemia, central nervous system (CNS) tumors, and gonadal and germ cell tumors (10% each) (Fig. 1.4) (18).
Childhood cancer death rates for the United States are shown in Table 1.3. In general, approximately one third of childhood cancer deaths are caused by leukemia, and about one fifth of these deaths are caused by brain tumors (5,6,19,20).
Childhood cancer incidence varies throughout the world. This may be related in part to fundamental issues of biology and demographics. It can also be related to the reporting system of a country and its level of economic development. For example, the distribution of childhood cancers in Uruguay is very similar to that of North America. Uruguay has a per capita income much higher than that of the rest of Latin America and the Caribbean (21). However, the frequency of malignant solid tumors in children in a report from Pakistan was distinctly different from that in the rest of the world. This may be related to artifacts of data collection and reporting (14,22, 23, 24, 25, 26). Although the absolute frequency of certain tumors is reported to be higher in developing countries than in industrialized states, there is likely to be variation in reporting standards, diagnostic techniques, and histopathologic review (25,27). In Cuba, the most common childhood tumor is leukemia (31%), followed by lymphoma (18%), CNS tumors (15%), sympathetic nervous system tumors (7%), soft tissue sarcomas (6%), and renal tumors (5%) (11). In Thailand, leukemias are most common (40%), followed by CNS tumors (14%), lymphoma (12%), bone tumors (4%), and soft tissue sarcomas (4%) (28). In Eastern Nigeria, lymphoma leads the list (Table 1.4) (29).
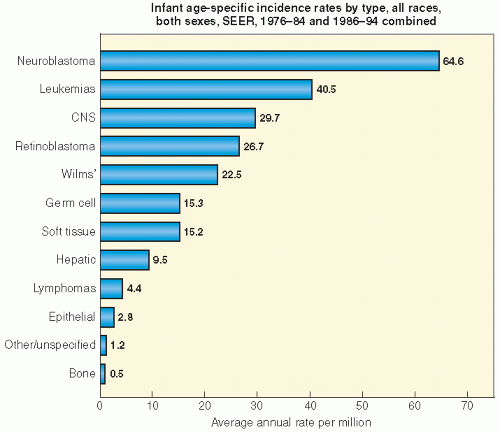
Figure 1.2 Infant age-specific cancer incidence rate by type, all races, both sexes, SEER, 1975-1984 and 1986-1994, combined (http://seer.cancer.gov/publications/childhood/infant.pdf).
Table 1.2SEERCancer Data: Percent Distribution of Childhood Cancer for <20-Year-Olds by ICCC Group
ICCC Group
As a Percentage of All Childhood Cancer
I.
Leukemia
25%
a.
Lymphoid leukemia 19%
ALL 19%
Lymphoid excluding ALL
0.2%
b.
Acute nonlymphoblastic leukemia
5%
c.
Chronic myeloid leukemia
0.9%
d.
Other specified leukemias
0.1%
e.
Unspecified leukemias
1%
II.
Lymphomas and reticuloendothelial neoplasms
16%
a.
Hodgkin disease
9%
b.
Non-Hodgkin lymphoma
5%
c.
Burkitt lymphoma
1%
d.
Miscellaneous
0.3%
e.
Unspecified
0.6%
III.
Central nervous system and miscellaneous
17%
Intracranial and intraspinal neoplasms (germ cell are found in category X)
a.
Ependymoma
1%
b.
Astrocytoma
9%
b.
Primitive neuroectodermal tumors
3%
c.
Other gliomas
3%
d.
Miscellaneous
0.3%
e.
Unspecified
0.4%
IV.
Sympathetic nervous system tumors
5%
a.
Neuroblastoma and ganglioneuroblastoma
5%
b.
Other
0.2%
V.
Retinoblastoma
2%
VI.
Renal tumors
4%
a.
Wilms, rhabdoid, clear cell sarcoma
4%
b.
Renal carcinoma
0.2%
VII.
Malignant bone tumors
6%
Osteosarcoma
3%
Chondrosarcoma
0.3%
Ewing sarcoma
2%
Other specified malignant
0.2%
Unspecified
0.1%
VIII.
Soft tissue sarcomas
7%
a.
Rhabdomyosarcoma and embryonal sarcoma
3%
b.
Fibrosarcoma, neurofibrosarcoma, other
2%
c.
Kaposi
0.1%
d.
Other specified
2%
e.
Unspecified
0.7%
IX.
Germ cell, trophoblastic, and other gonadal neoplasms
7%
a.
Intracranial and intrapial
1%
b.
Other and unspecified nongonadal
1%
c.
Gonadal germ cell tumor
4%
d.
Gonadal carcinomas
1%
e.
Other and unspecified malignant gonadal
0.1%
X.
Carcinomas and other malignant epithelial neoplasms
9%
a.
Adrenocortical carcinoma
0.1%
b.
Thyroid carcinoma
3%
c.
Nasopharyngeal carcinoma
0.4%
d.
Malignant melanoma
3%
e.
Skin carcinoma
3%
f.
Other and unspecified
0%
XI.
Other and unspecified malignant neoplasms
1%
All groups continued
100%
ALL, acute lymphoblastic leukemia; ICCC, International Classification of Childhood Cancer; SEER, Surveillance, Epidemiology, and End Results.
Data from SEER Cancer Statistics: http://seer.cancer.gov, http://seer.cancer.gov/iccol, and http://seer.cancer.gov/publications/childhood.
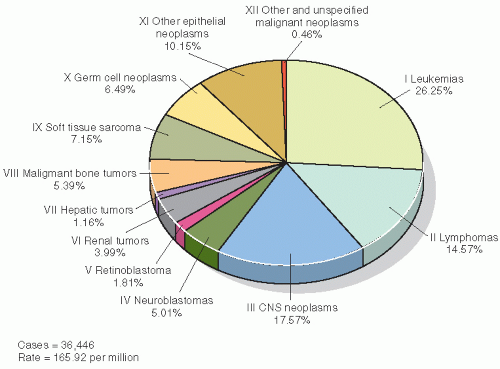
Figure 1.3 Childhood cancer incidence in those aged 0 to 19 years in United States, 2001-2003. Rates are per million and were adjusted to the 2000 US standard population. Data are from population-based cancer registries that participate in the National Program of Cancer Registries (NPCR) or the SEER program. These data included malignant tumors only and cover 90.3% of the US population. (Reproduced from Li J, Thompson TD, Miller JW, et al. Cancer incidence among children and adolescents in the United States, 2001-2003. Pediatrics. 2008; 121:e1470-e1477, with permission.)
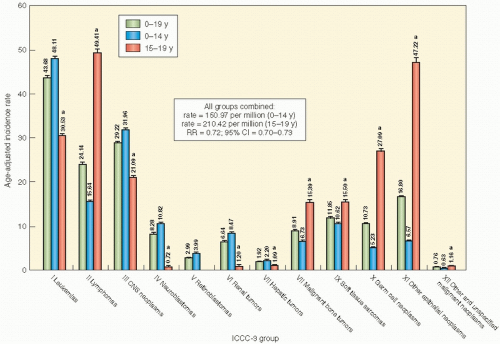
Figure 1.4 Age-specific childhood cancer-incidence rates according to ICCC-3 group: United States, 2001-2003.a There is a significant difference between children (aged 0-14 years) and adolescents (aged 15-19 years). Retinoblastomas are not shown for those aged 15 to 19 years because there were fewer than 16 cases in this category. (Reproduced from Li J, Thompson TD, Miller JW, et al. Cancer incidence among children and adolescents in the United States, 2001-2003. Pediatrics 2008; 121:e1470-e1477, with permission.)
Table 1.3 Reported Deaths for the Five Leading Cancer Sites for Individuals <20 Years of Age, United States, 2005, by Sex
Reported Number of Deaths
Male
Female
All sites, 1261
All sites, 922
1. Leukemia, 382
1. Leukemia, 258
2. Brain and other nervous system, 298
2. Brain and other nervous system, 246
3. Bones and joints, 121
3. Bones and joints, 91
4. Other endocrine system, 109
4. Soft tissue, 87
5. Non-Hodgkin lymphoma, 78
5. Other endocrine system, 69
Data from Jemal A, Thomas A, Murray T, et al. Cancer statistics.2008. CA Cancer J Clin. 2008;58:71-96.
TRENDS IN CHILDHOOD CANCER MORTALITY RATES
The mortality rate from childhood cancer has fallen dramatically in the United States. Particularly impressive gains have been posted for acute lymphocytic leukemia (ALL), bone tumors (predominantly osteosarcoma and Ewing sarcoma), Hodgkin disease, non-Hodgkin lymphoma, soft tissue sarcomas (including rhabdomyosarcoma and nonrhabdomyosarcoma soft tissue sarcomas), and Wilms tumor. Although gains have also been achieved for acute myelocytic leukemia, neuroblastoma, and brain tumors, the improvements have been less dramatic or confined to certain subgroups or stages (Tables 1.5 and 1.6). In general, however, the diagnosis and treatment of childhood cancer has been one of the success stories of modern medicine.
Table 1.4 Frequency of Histologic Types of Childhood Cancer in Eastern Nigeria, 1976-2004
Cancer Types
Frequency (%)
Lymphoma
42%
Wilms
16%
Sarcoma
11%
Leukemia
9%
Retinoblastoma
7%
Neuroblastoma
4%
Other
10%
Data from Ocheni S, Bioha FI, Ibegbulam OG, et al. Changing patterns of childhood malignancies in Eastern Nigeria. West African Med J. 2008;27:3-6.
It is clear that when compared with adult cancer, childhood cancer is a vanishingly rare event. For example, in 2008 there were 162,000 reported deaths from lung cancer alone in the United States (5). The comparative infrequency of childhood cancer is highlighted by the fact that more people in the United States die of lung cancer in 1 week than children die of all forms of cancer in 1 year. Looking at the impact of cancer solely in this manner obscures the issue, however. If one looks at a death from cancer in terms of potential years of life lost, then the death of an 8-year-old from ALL has a greater statistical weight than the death of an 82-year-old from small cell carcinoma of the lung. Therefore, the success of medical treatment of childhood cancer has a significant public health impact when considered in terms of the person-years of potential life or lifetime earnings saved. A lifetime is saved for every child cured of cancer.
IS THE INCIDENCE OF CHILDHOOD CANCER INCREASING?
Some data suggest that the overall incidence of childhood cancer is rising in the United States. Experts disagree about what might account for this alleged increase. Some have asserted that new diagnostic techniques such as computed tomography (CT), magnetic resonance imaging, needle biopsy, and serum chemical markers are increasing the rate of diagnosis of childhood cancer. Thus, the increase in childhood cancer is merely an artifact of improved diagnostic techniques. The counterargument is that the rise in the incidence of childhood cancer is real and may be linked to environmental toxins. So far, alleged links include pelvic radiography of mothers during pregnancy, the use of radioactive nucleotides during pregnancy, exposure to electromagnetic fields, radon, solvents, parental occupational exposure, diet, environmental tobacco smoke, alcohol, and infection. The alleged link to agricultural and home pesticide use is weak, and many studies find no correlation (30,31). While it has been suggested that exposure to magnetic fields emanating from electric transmission and distribution lines and certain electrical household appliances may be associated with some childhood tumors, the available studies are contradictory (32).
Only gold members can continue reading. Log In or Register to continue