Chapter 20 The exponential law
Chapter contents
20.2 Description of the exponential law 139
20.3 Radioactive decay and the exponential law 140
20.4 Measures of radioactivity 141
20.5 Half-life and decay constant 142
20.6 Physical half-life, biological half-life and effective half-life 143
20.7 Attenuation of electromagnetic radiation by matter 144
20.9 Tenth-value thickness 146
20.10 The use of the exponential form of the logarithmic law 146
20.1 Aim
The aim of this chapter is to introduce the exponential law and consider its applications to radiographic science. The law is fundamental to an understanding of radioactive decay and the attenuation of certain electromagnetic radiations (e.g. X-rays and gamma-rays).
20.2 Description of the exponential law
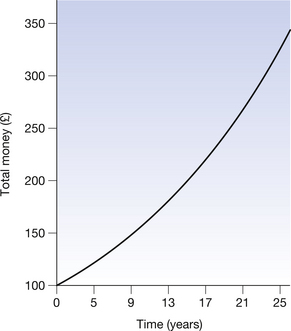
Perhaps the best everyday example of the exponential law concerns money. If £100 is invested with a financial institution which gives a fixed interest rate of 5% per annum then the growth of that money over a 25-year period is shown in Table 20.1 (See page 140).
Table 20.1 Growth of £100 at 5% per annum
| YEAR | INTEREST RATE (%) | MONEY AT END OF YEAR | NET INCREASE FOR YEAR |
|---|---|---|---|
| 1 | 5 | £105 | £5.00 |
| 2 | 5 | £110.25 | £5.25 |
| 3 | 5 | £115.76 | £5.51 |
| 4 | 5 | £121.55 | £5.79 |
| 5 | 5 | £127.63 | £6.08 |
| 6 | 5 | £134.01 | £6.38 |
| 7 | 5 | £140.71 | £6.70 |
| 8 | 5 | £147.74 | £7.03 |
| 9 | 5 | £155.13 | £7.39 |
| 10 | 5 | £162.90 | £7.77 |
| 11 | 5 | £171.03 | £8.13 |
| 12 | 5 | £179.59 | £8.56 |
| 13 | 5 | £188.56 | £8.97 |
| 14 | 5 | £197.99 | £9.43 |
| 15 | 5 | £207.89 | £9.90 |
| 16 | 5 | £218.29 | £10.40 |
| 17 | 5 | £229.90 | £10.91 |
| 18 | 5 | £240.66 | £11.46 |
| 19 | 5 | £252.70 | £12.04 |
| 20 | 5 | £265.33 | £12.63 |
| 21 | 5 | £278.60 | £13.27 |
| 22 | 5 | £292.53 | £13.93 |
| 23 | 5 | £307.15 | £14.62 |
| 24 | 5 | £322.51 | £15.36 |
| 25 | 5 | £338.64 | £16.13 |
Notice that the net increase per year is initially quite small (£5.00 in the first year) but the amount increases with time (£16.13 in the 25th year). This is an example of exponential growth in that as the time increases by equal amounts (1 year) the money increases by equal fractions (5%). If we draw a graph of the total money with the financial institution we get a smooth curve, as shown in Figure 20.1 (See page 140). This is the typical shape of an increasing exponential.
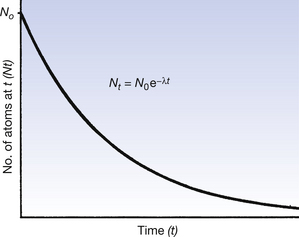
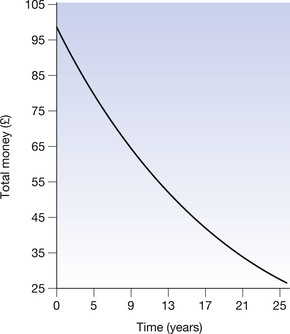
For a second example, consider a situation where we possess an initial sum of £100. If we consider a tax system where 5% of this money is removed each year as a tax, then the fate of the original £100 is shown in Table 20.2 (See page 141). Again we can note that the net decrease is greatest during the first year (£5.00) and is least during the 25th year (£1.46). The rate of decrease is, however, the same, at 5% per annum. This is an example of exponential decay in that as the time increases by equal amounts (1 year) the money left will decrease by 5% of that remaining, but will never reach zero (i.e. there will always be some money left). If we draw a graph of the total money left, we again get a smooth curve, as shown in Figure 20.2 (See page 141). This is the typical shape of a decaying exponential.
Table 20.2 Decrease of £100 at 5% per annum
| YEAR | TAX RATE (%) | MONEY AT END OF YEAR | NET DECREASE FOR YEAR |
|---|---|---|---|
| 1 | 5 | £95.00 | £5.00 |
| 2 | 5 | £90.25 | £4.75 |
| 3 | 5 | £85.74 | £4.51 |
| 4 | 5 | £81.45 | £4.29 |
| 5 | 5 | £77.38 | £4.07 |
| 6 | 5 | £73.51 | £3.87 |
| 7 | 5 | £69.83 | £3.68 |
| 8 | 5 | £66.34 | £3.49 |
| 9 | 5 | £63.02 | £3.32 |
| 10 | 5 | £59.87 | £3.15 |
| 11 | 5 | £56.88 | £2.99 |
| 12 | 5 | £54.04 | £2.84 |
| 13 | 5 | £51.33 | £2.70 |
| 14 | 5 | £48.77 | £2.57 |
| 15 | 5 | £46.33 | £2.44 |
| 16 | 5 | £44.01 | £2.32 |
| 17 | 5 | £41.81 | £2.20 |
| 18 | 5 | £39.72 | £2.09 |
| 19 | 5 | £37.74 | £1.99 |
| 20 | 5 | £35.85 | £1.89 |
| 21 | 5 | £34.06 | £1.79 |
| 22 | 5 | £32.35 | £1.70 |
| 23 | 5 | £30.74 | £1.62 |
| 24 | 5 | £29.20 | £1.54 |
| 25 | 5 | £27.74 | £1.46 |
The two major examples of the exponential law in radiographic science are radioactive decay and the attenuation of electromagnetic radiation by matter. Both of these are described in the following sections.
20.3 Radioactive decay and the exponential law
Radionuclides are said to decay when they change from one nuclear configuration to another. This decay takes several forms, including the ejection of alpha-particles, beta-particles (both positive and negative) and gamma-rays from the nucleus. These and other modes of decay have been discussed more fully in Chapter 19. The particular mode of decay is, however, not important to our discussion in this section as the application of the exponential law is valid for all the modes. It can be stated as:
This is exactly analogous to the changes that occurred in the decaying exponential sum of money, in that a fixed fraction (or percentage) will decay each unit time (similar to the loss of money from the lump sum). Figure 20.3 shows a graph depicting the above situation. Note that the initial fall in number of atoms is steep but slows down as fewer and fewer of the original nuclei are left. Also note that the number of original nuclei never reaches zero. This is exactly the same as happened in the case of the lump sum of money and you should also note the similarities between Figure 20.3 (See page 141) and Figure 20.2.