7
The Interpretation of FDG PET Studies
Eugene C. Lin and Abass Alavi
Optimal fluorodeoxyglucose positron emission tomography (FDG PET) interpretation requires attention to many details both before and after the examination is performed.
PET has a wide range of potential applications, with varying degrees of scientific evidence for the efficacy of each application. It is helpful to have a process for screening less common requests for PET (e.g., the “C” level indications in this text). Knowledge of PET is somewhat variable among referring physicians, and it is not uncommon to receive requests for indications for which PET would be unlikely to provide the expected answers. In cases where PET is of marginal value, the referring physician should be made aware of the potential limitations before the examination is performed. This is important to avoid generalization of the information provided in these settings to the overall role of the test in other indications. Screening unusual requests will avoid situations where the referring physician believes that PET will provide specific information that it is unlikely to provide based upon available knowledge. Possible limitations of PET include the following.
- Limited/inadequate evidence
- Limited accuracy. There are disease processes where PET has either or both poor sensitivity and specificity (e.g., FDG PET for detection of metastatic prostate cancer).
- Limited management effect/cost-effectiveness. PET may not change management for some potential applications regardless of the results, or it may not be cost-effective relative to other options (e.g., PET is not cost-effective in differentiating benign from malignant thyroid nodules, and it does not change management, as it is not accurate enough to preclude biopsy).
- Limited evidence. There are many potential applications for which the literature is limited at this time. In these cases, PET may be potentially useful, but it may be unclear what additive benefit PET would have over conventional imaging techniques.
- Technical limitations. PET is limited in the evaluation of small lesions. In some cases, PET may be limited for lesions < 1 cm. This can be used as a threshold, but it is not a definite cutoff. Lesions < 1 cm are detectable, but with lower sensitivity. Detectability of lesions in the 5 to 7 mm range has been reported in clinical studies; in our experience, lesions < 5 mm in size can be detected if metabolically active and in locations where motion and background activity are limited.
- Lesion detectability is dependent largely upon location. Lesion detectability is increased in areas with minimal motion (e.g., the retroperitoneum, neck, and extremities) and minimal background physiologic activity (e.g., the lungs and retroperitoneum). It is often possible to easily detect uptake in lesions < 1 cm in certain locations (see Chapter 23). Areas with large amounts of physiologic activity (e.g., the liver) will have decreased detection rates for small lesions. In the lungs, background activity is low, but respiratory motion decreases detection, particularly in the lung bases. Respiratory misregistration artifact specific to PET/computed tomography (CT) scans would further limit lesion detection in the lung bases.
- PET is sometimes requested for evaluation of equivocal lesions that may be too small to detect by PET. It is optimal to evaluate larger lesions, but lesions < 1 cm in size could be considered for evaluation depending upon the location. In these cases the referring physician should be made aware that false-negative results are possible, and only positive results are reliable. The PET study may be very helpful if positive, as this is very specific for malignancy in small lesions. Standardized uptake values (SUVs) will likely be of limited value due to partial volume effects.
- Patient limitations. Patient factors such as recent chemotherapy or radiation or inability to lie still may limit optimal examination. In most cases, these situations can be resolved with further communication with the referring physician and instituting measures such as delaying the exam or sedation.
In general, FDG PET is a very sensitive but less-specific modality (although PET can be very specific in certain settings). Therefore, an approach to optimal interpretation is to maximize specificity. Specificity can be maximized by
- Correlation with clinical data
- Correlation between all available PET data
- Correlation with anatomical imaging
It is essential that pertinent information about the history of the illness and relevant ancillary studies are collected before interpreting PET. This is especially true for PET compared with other imaging modalities, given the numerous potential pitfalls. Although the interpreting physician may choose to review the images initially without benefit of patient history, the final interpretation should take into consideration all available and pertinent data related to the disease process. Clinical pretest probability is often useful in the interpretation of PET findings.
- If the pretest probability of disease is low (e.g., the incidence of mediastinal metastases in peripheral lung cancer or residual disease after treatment of early-stage Hodgkin disease), then a negative PET is highly predictive of lack of disease, and a positive PET is more likely to be false-positive.
- If the pretest probability of disease is high (e.g., a spiculated lung nodule), a negative PET is more likely to be false-negative, and a positive PET is highly predictive of disease.
For typical PET scans, three sets of data are provided: maximum intensity projection (MIP), nonattenuation corrected (NAC), and attenuation corrected (AC). The NAC and AC images are typically reconstructed in axial, sagittal, and coronal planes. Findings on all datasets should be closely correlated.
- MIP images. The MIP image is reviewed in a rotating format and allows review of the entire volume imaged in different projections. In general, MIP images are less sensitive than the tomographic sets, but they allow a complete overview of the extent of disease and help define relationships of the abnormalities to each other and to anatomical sites.
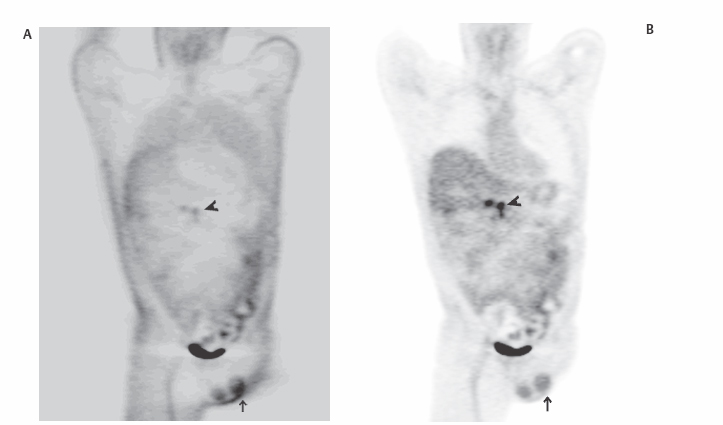
- NAC images. NAC images can be distinguished from AC images (Fig. 7.1) by
- High skin activity
- High lung activity
- Decreased central activity (e.g., low activity in the deep structures of the mediastinum and abdomen)
- NAC advantages
- Low noise. AC adds noise to the study, which can cause false-positive results. In addition, dense areas can cause artifacts on AC images if CT is used for AC (see Chapter 8). Review of NAC images may be vital to identify these false-positive findings.
- If a potential lesion is seen on AC images but not on NAC images, the possibility of a false-positive secondary to artifact (noise or dense material) should be considered. This is more of a consideration if the lesion is peripheral (because a central lesion may not be visualized on NAC images secondary to attenuation).
- Detectability. Some lesions are better detected on NAC images. In our experience, detection of lung (Fig. 7.2), bone (Fig. 7.3), or superficial lesions may be superior on NAC images.
- A clinical study suggests that NAC may be superior for lung lesion detection,1 but a phantom study suggests that NAC may be superior for abdominal lesions and inferior for lung lesions.2 A clinical PET/CT study3 did not demonstrate a difference between AC and NAC images in the detection of pulmonary metastases.
- Lesions in areas of uniform attenuation (e.g., the abdomen) will demonstrate greater contrast on NAC images, but lesions in areas of nonuniform attenuation (e.g., the thorax) will demonstrate greater contrast on AC images.2
 Limitations of PET
 Interpretation of PET

![]()


