The Liver, Biliary System, and Pancreas
Lisa M. Sullivan
L. M. Sullivan: Department of Radiology, University of New Mexico Health Sciences Center, Albuquerque, New Mexico 87131.
THE LIVER
Imaging Techniques
Ultrasound (US) is often the first examination requested in patients who present with right-upper-quadrant pain, abnormal liver function tests, or suspected malignancy. Ultrasound is an excellent screening tool. It is rapid, portable, and relatively inexpensive and does not involve radiation. With the use of color Doppler techniques, hepatic vascular abnormalities including venous thrombosis and findings of portal hypertension can be identified. This is particularly useful in evaluating vessel patency in patients after hepatic transplantation.
Computed tomography (CT) is valuable for evaluating the liver for diffuse and focal abnormalities. Multiple protocols have been developed to optimize the detection and characterization of liver lesions. It is important to understand the basic rationale behind these techniques in order to tailor the examination for an individual patient. Noncontrast-enhanced CT is used in patients who have compromised renal function, for those who have an allergy to intravenous (IV) contrast agents, or when a high-density lesion is suspected. Most liver CT protocols involve the IV injection of a bolus of 100 to 150 mL of contrast material with dynamic imaging performed at different phases of hepatic enhancement. An advantage of CT is the identification of extrahepatic lesions as part of a comprehensive examination.
CT portography is sometimes used before partial hepatectomy to search for additional metastatic liver lesions. An angiographic catheter is placed in the superior mesenteric artery or splenic artery and then the patient is transferred to the CT suite for imaging during injection of contrast material. Because metastases are not perfused by portal vein blood, they will show as negative filling defects. This technique is slightly more sensitive for the identification of additional liver metastases than is routine liver CT.
Magnetic resonance imaging (MRI) of the liver is less commonly used than either CT or US. MRI has more limited availability. MRI can be an adjunctive method for patients who are allergic to contrast agents or have poor renal function or when CT findings are equivocal. In experienced hands it is particularly useful for solving problems. MRI appears to be slightly more sensitive and specific in the diagnosis of focal lesions than is CT.
Nuclear medicine imaging is not often employed to evaluate liver disease, because of advances in US, CT, and MRI. Sulfur colloid liver/spleen imaging is done in patients with cirrhosis and suspected portal hypertension. Focal areas of decreased activity in the liver on a liver/spleen scan are nonspecific and include any space-occupying process. Lesions smaller than 2 cm may be missed. Technetium-labeled red blood cell (RBC) scanning with single photon emission computed tomography (SPECT) can be helpful in the evaluation of lesions larger than 2 cm. The examination is specific for a hemangioma. Infrequently used, gallium scanning reveals increased activity in the liver in hepatoma, some metastases, abscesses, and lymphoma.
Anatomy
A basic knowledge of the hepatic vascular supply is essential for understanding hepatic anatomy and the variety of disease processes that can involve the liver. The liver has a unique dual blood supply, with approximately 75% originating from the portal venous system and 25% coming from the hepatic artery. The hepatic veins drain filtered blood from the liver into the inferior vena cava (IVC). The liver has three functional lobes: the right lobe, which has anterior and posterior segments; the left lobe, with medial and lateral segments; and the caudate lobe.
The anterior segment of the right lobe is separated from the medial segment of the left lobe by the main lobar fissure, which contains the middle hepatic vein. The right hepatic
vein separates the anterior and posterior segments of the right lobe and lies within the right intersegmental fissure. The left hepatic vein separates the medial and lateral segments of the left lobe and lies within the left intersegmental fissure (Figs. 14-1 and 14-2). The caudate is positioned posteriorly and is separated from the rest of the liver by the fissure for the ligamentum venosum. The hepatic veins run in intersegmental fissures, while the portal veins, hepatic arteries, and bile ducts course together in intrasegmental parenchyma.
vein separates the anterior and posterior segments of the right lobe and lies within the right intersegmental fissure. The left hepatic vein separates the medial and lateral segments of the left lobe and lies within the left intersegmental fissure (Figs. 14-1 and 14-2). The caudate is positioned posteriorly and is separated from the rest of the liver by the fissure for the ligamentum venosum. The hepatic veins run in intersegmental fissures, while the portal veins, hepatic arteries, and bile ducts course together in intrasegmental parenchyma.
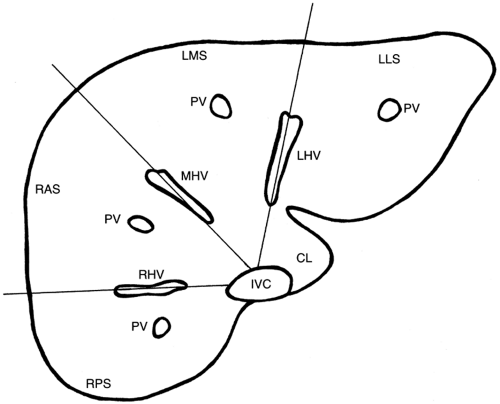 FIG. 14-1. Hepatic segmental anatomy. The venous anatomy provides the landmarks for dividing the liver into lobes and segments. RPS, posterior segment of the right lobe; RAS, anterior segment of the right lobe; LMS, medial segment of the left lobe; LLS, lateral segment of the left lobe; CL, caudate lobe; RHV, right hepatic vein; MHV, middle hepatic vein; LHV, left hepatic vein; PV, portal vein; IVC, inferior vena cava. |
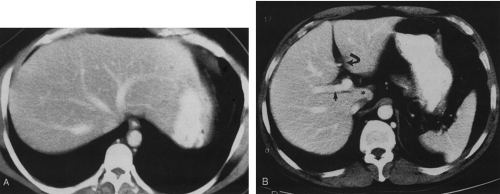 FIG. 14-2. Computed tomogram of normal liver. A: Liver at the level of the three hepatic veins and the inferior vena cava. B: More caudal image at the level of the right portal vein (arrow), falciform ligament (curved arrow), and caudate lobe (asterisk). |
Diffuse Hepatic Disease
Diffuse diseases of the liver are rarely detected early by US, CT, or MRI. Usually the diseases are advanced by the time they become evident and produce alterations in size,
density, and signal intensity that help characterize the broad range of diffuse hepatic disease.9
density, and signal intensity that help characterize the broad range of diffuse hepatic disease.9
Cirrhosis
Although there are numerous causes of cirrhosis, the most common cause in North America is alcohol abuse.3 Viral hepatitis is responsible for 10% of cases.9 Pathologically, cirrhosis consists of varying amounts of hepatic necrosis, fibrosis, fatty infiltration, and nodular regeneration. Regenerative nodules can progress to hepatocellular carcinoma (HCC), which occurs in 11% of cirrhotics.
The cirrhotic liver is enlarged early in the process and eventually becomes small, often with an irregular, nodular contour. There is relative enlargement of the lateral segment of the left lobe and caudate (Fig. 14-3). The intrahepatic fissure can become prominent.9
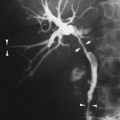
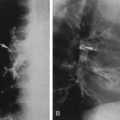
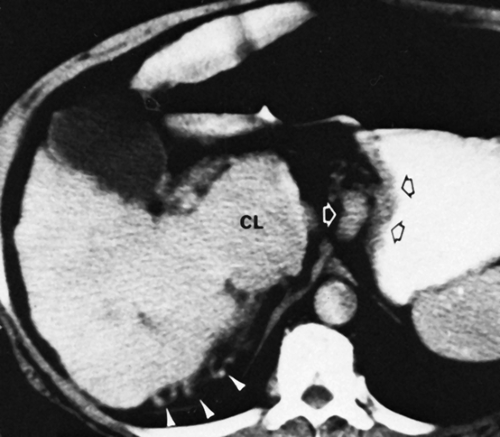 FIG. 14-3. Cirrhosis with esophageal varices and collaterals. Computed tomographic scan through the liver shows enlarged caudate lobe (CL), large gastric and esophageal varices (arrows), and other collateral channels that have developed on the under surface of the liver (arrowheads). |
Cirrhosis often causes portal hypertension secondary to fibrosis of the hepatic vascular bed. Ascites, splenomegaly, portosystemic venous collaterals, and eventually hepatofugal portal blood flow can result. Tortuous, tubular vessels may be seen in the mesentery, surrounding the distal esophagus, and in the gastrohepatic ligament, splenic hilum, and retroperitoneum. Occasionally a large periumbilical collateral vein can be identified arising in the falciform ligament (Fig. 14-4).5
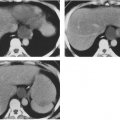
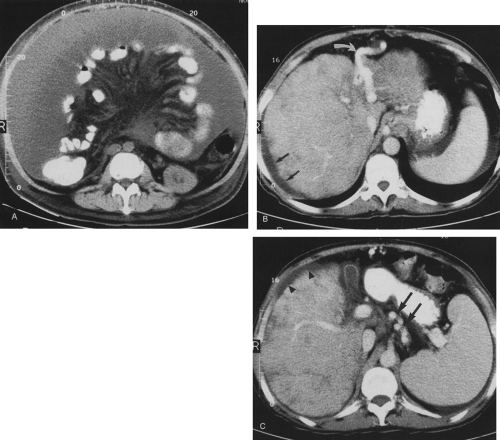 FIG. 14-4. Computed tomographic findings with cirrhosis and portal hypertension. A: Massive ascites displacing the bowel centrally. B: Periumbilical collateral vein (curved arrow). The liver is enhancing inhomogeneously and ascites is present (black arrows). C: The liver is nodular. Ascites (arrowheads), collateral veins (arrows), and splenomegaly are present. |
The US appearance of advanced cirrhosis typically reveals a small liver with coarse, increased echogenicity. The irregular surface of the liver is often well visualized because of concomitant ascites. Noncontrast-enhanced CT may demonstrate either a heterogeneous or a homogenous decreased attenuation. After IV administration of contrast material, areas of fibrosis and regeneration may become similar in density to the remaining parenchyma. The liver may be heterogeneous on MRI. In advanced cirrhosis, a nuclear medicine sulfur colloid scan shows “colloid shift,” or relatively increased activity in the bone marrow and spleen compared with the liver. Additional findings include splenomegaly, heterogeneous uptake in the liver, and displacement of the liver from the lateral body wall by ascites.3
Hepatitis
Acute inflammation from any cause prompts the hepatocytes to become swollen and edematous. Imaging modalities demonstrate very nonspecific findings, and clinical correlation is important. US may be normal in acute hepatitis, or it may show the classic findings of decreased echogenicity of the parenchyma with prominence of the portal venous system, causing a “starry sky” appearance. Chronic hepatitis may produce a coarse echogenic parenchymal pattern. CT and MRI are not typically used in the evaluation of patients with acute hepatitis.
Fatty Infiltration
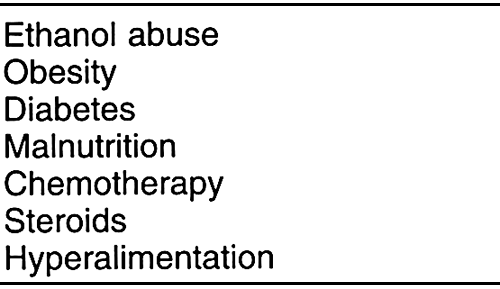
Deposition of fat in the liver is a reversible process caused by triglyceride accumulation within hepatocytes. It is common and represents a nonspecific reaction to injury or metabolic derangement. Common causes include excess alcohol intake, diabetes, obesity, hyperalimentation, steroid therapy, pregnancy, and chemotherapy. Removal of or correction of the underlying cause typically reverses the process (Table 14-1).
 |
The typical US appearance of fatty infiltration is increased liver echogenicity which can be diffuse, nonhomogeneous, or sometimes focal in nature. It is helpful to compare the echogenicity of the liver with that of the right kidney when evaluating for possible fatty deposition. On noncontrast-enhanced CT, fat causes decreased attenuation of the hepatic parenchyma. The liver is less dense than the spleen (normally the liver density is equal to or greater than that of the spleen). After IV administration of contrast material, the venous structures are easily seen against the low-density parenchyma (Fig. 14-5).9
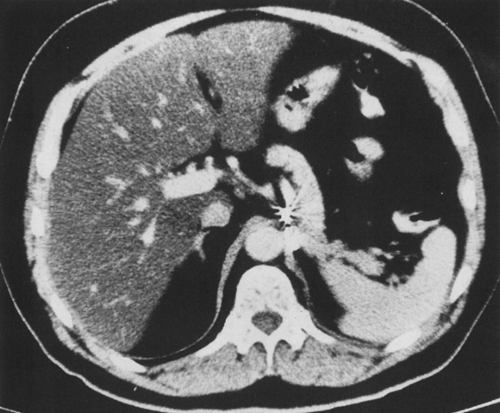 FIG. 14-5. Diffuse fatty infiltration of the liver. The liver density is much lower than that of the spleen. |
Budd-Chiari Syndrome
Budd-Chiari is a rare syndrome caused by obstruction of hepatic venous outflow, which may be either intrahepatic or extrahepatic in origin. There are numerous causes of Budd-Chiari, the most common being idiopathic. Other causes include tumor thrombus, pregnancy, hypercoagulable states, trauma, sepsis, dehydration, and some medications. It is more common in women, and patients may present acutely with abdominal pain or have an insidious onset.9
US with Doppler evaluation of flow in the hepatic veins and IVC is usually the initial imaging study. Findings include actual thrombus in the hepatic veins or IVC or nonvisualization of the hepatic veins. In cases of chronic Budd-Chiari there is often associated ascites and enlargement of the caudate lobe.10 On contrast-enhanced CT, the enlarged caudate lobe may have increased enhancement and there may be early central liver enhancement, subsequent central washout, and delayed enhancement of the periphery of the liver.9 MRI typically shows either absent flow or narrowing of the hepatic veins or IVC. A sulfur colloid scan may demonstrate a “hot” caudate lobe.
Iron Deposition
Deposition of iron in the liver may be either primary or secondary. Primary hemochromatosis is an autosomal recessive abnormality that causes iron deposition in hepatocytes, pancreas, and the myocardium. Patients have an increased incidence of cirrhosis and HCC. Secondary hemochromatosis results in deposition of iron in the reticuloendothelial cells of the liver and spleen, usually secondary to multiple blood transfusions.9,12
The echogenicity of the liver is usually normal. Noncontrast-enhanced CT demonstrates diffuse increased attenuation of liver parenchyma (Fig. 14-6). MRI demonstrates decreased signal on T2-weighted images. MRI can be useful if other modalities are equivocal.
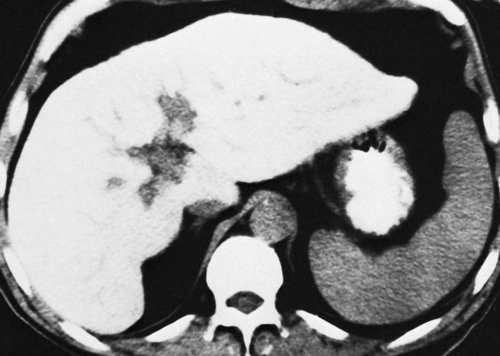 FIG. 14-6. Hemochromatosis. Computed tomographic (CT) scan through the liver shows “white” liver representing iron deposition. The liver should have a density on CT comparable to that of the spleen. |
Focal Liver Lesions
When considering the differential diagnosis of a focal liver lesion it is important to consider the clinical data. The patient’s age and sex are important considerations. In patients older than 50 years of age, metastases are common and it may be worthwhile to search for metastases elsewhere and for a possible primary tumor. Hepatic adenoma, hemangioma, hepatic cysts, and focal nodular hyperplasia are more
common in women. Other clinical data such as oral contraceptive use and α-fetoprotein levels may be useful.
common in women. Other clinical data such as oral contraceptive use and α-fetoprotein levels may be useful.
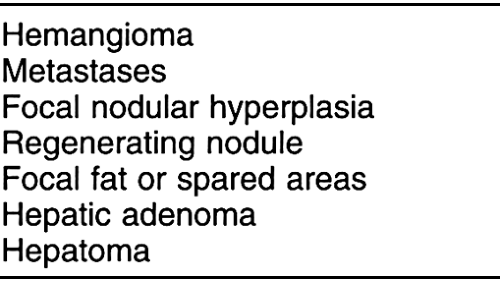
Imaging features that should be considered when evaluating a focal liver lesion include single versus multiple lesions; echogenicity, density, or signal intensity; sharpness of contour; homogeneity; and the enhancement pattern on CT and MRI (Table 14-2).
 |
Hemangioma
The cavernous hemangioma is the most common benign hepatic lesion; it may be either single or multiple (10%). The lesion is present in 4% to 20% of the population. Eighty percent occur in women, and incidence increases with age. Hemangiomas are usually asymptomatic and discovered incidentally.
The most common location of a hemangioma is the posterior segment of the right lobe of the liver. They are often subcapsular or peripheral. The usual sonographic appearance is a well-defined, round, homogeneous, hyperechoic lesion (Table 14-3). The larger the lesion, the more likely it is to be heterogeneous with areas of degeneration. The slow flow in the vascular channels is not detectable with color Doppler imaging.
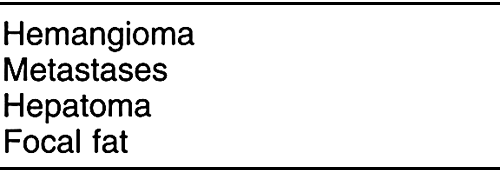 |
On noncontrast-enhanced CT, a hemangioma is usually well-circumscribed and of low density. The typical appearance after IV contrast administration is initial peripheral nodular enhancement (equal to vessels) with near-complete filling-in on delayed images (Fig. 14-7). Additionally, a hemangioma should retain contrast material for 20 to 30 minutes and not wash out when the portal vein is enhancing. Larger hemangiomas may demonstrate atypical enhancement (Fig. 14-8).
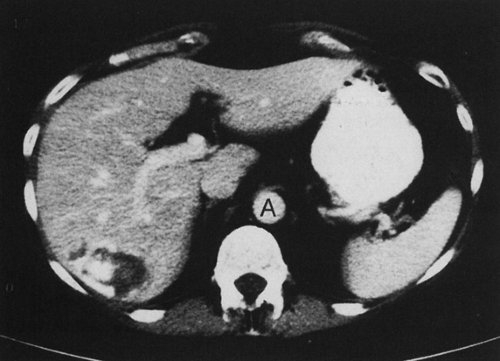 FIG. 14-7. Liver hemangioma in the posterior segment of the right lobe has peripheral, nodular contrast enhancement. The enhancement is similar to that of the aorta (A). |
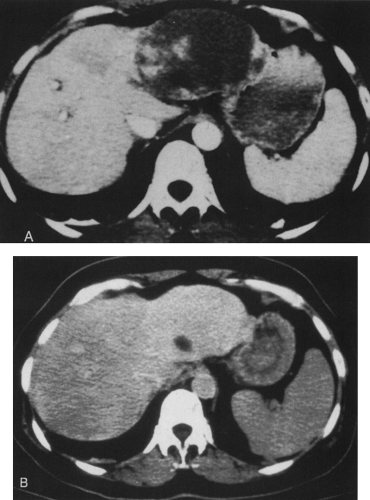 FIG. 14-8. Giant hemangioma. A: Areas of early contrast enhancement are seen in the large lesion in the left lobe. B: On delayed images, the lesion almost completely fills in. |
SPECT imaging with tagged RBCs is most useful if the suspected lesion is larger than 2 cm. The hemangioma demonstrates decreased activity on early images, with increased activity on delayed images. MRI is useful for lesions smaller than 2 cm and those that are atypical on CT. Hemangiomas are well defined, homogeneous, and markedly hyperintense on T2-weighted images. They enhance from peripheral to central after administration of a dynamic IV bolus of gadolinium, similar to the pattern seen on CT.
Hepatic Cyst
The second most common benign lesion
is a simple cyst. They can be single or multiple, and they occur in 2.5% to 10% of the population. Like hemangiomas, they are more common in women and increase in frequency with age. Cysts are usually asymptomatic. Cysts can be seen with disease processes such as tuberous sclerosis and polycystic kidney disease. Approximately 40% of patients with polycystic kidney disease have cysts in the liver, and 60% of patients with multiple hepatic cysts have polycystic kidney disease (Fig. 14-9).
is a simple cyst. They can be single or multiple, and they occur in 2.5% to 10% of the population. Like hemangiomas, they are more common in women and increase in frequency with age. Cysts are usually asymptomatic. Cysts can be seen with disease processes such as tuberous sclerosis and polycystic kidney disease. Approximately 40% of patients with polycystic kidney disease have cysts in the liver, and 60% of patients with multiple hepatic cysts have polycystic kidney disease (Fig. 14-9).
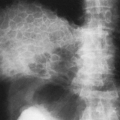
 FIG. 14-9. Numerous cysts in the liver and left kidney in a patient with polycystic kidney disease. |
The criteria for a simple cyst on US are anechoic or no internal echoes, sharp margins, imperceptible wall, and increased through transmission. The accuracy of US is 95% to 99% when these criteria are met. The typical appearance of a simple cyst on CT is that of a sharply defined, water-density lesion with no perceptible wall and no contrast enhancement. The density can be measured, or it can be compared with that of the normal gallbladder. Delayed images should show no contrast enhancement or change in density compared with noncontrast-enhanced images. MRI demonstrates a homogeneously low-signal-intensity lesion on T1-weighted images and a high-signal-intensity lesion on T2-weighted images (Table 14-4).
 |
Pyogenic Abscess
Liver abscesses can be bacterial, parasitic, or fungal in origin. Approximately 85% to 90% are bacterial or pyogenic. Bacteria access the liver via the biliary tree or portal vein. Causes include biliary obstruction, diverticulitis, trauma, inflammatory bowel disease, and iatrogenic causes. Patients present with pain, fever, diarrhea, leukocytosis, and abnormal liver function tests (LFTs). The most common location of a pyogenic abscess is the right lobe. Treatment consists of percutaneous or surgical drainage and
antibiotics. The mortality rate is almost 100% if the abscess remains untreated.
antibiotics. The mortality rate is almost 100% if the abscess remains untreated.
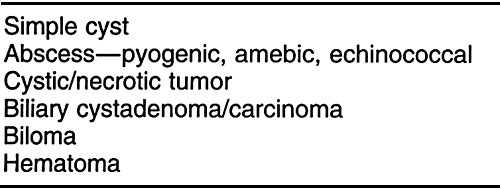
On US, the lesions are usually heterogeneous, round, hypoechoic collections with irregular thick walls. Internal echoes and fluid–fluid levels and debris are common. Acoustic shadowing suggests gas within the abscess. CT demonstrates a heterogeneous lesion with irregular margins and possibly peripheral contrast enhancement. Internal septations are common. Approximately 20% contain air (Fig. 14-10). The radiologic differential diagnosis includes cystic or necrotic metastases (ovarian or leiomyosarcoma), and hydatid and echinococcal cysts. Often the diagnosis of a bacterial abscess is suggested clinically. Nuclear medicine studies show a cold defect on sulfur colloid imaging and increased activity on a gallium scan. HCC and metastatic disease can have a similar appearance on nuclear medicine studies.
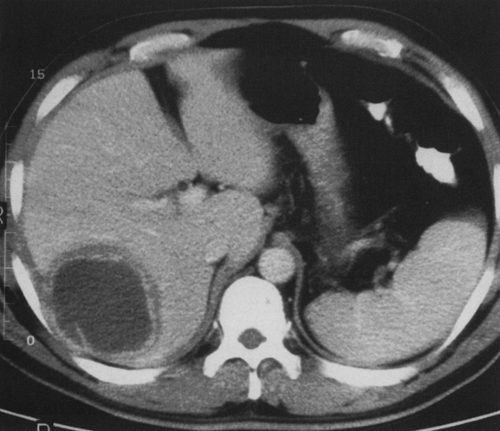 FIG. 14-10. Pyogenic liver abscess in the right lobe. The abscess has an enhancing rim surrounded by a low-density rind of edema. |
Amebic Abscess
Amebiasis is a primary infection of the colon by the parasite Entamoeba histolytica. The parasite is transmitted by the fecal–oral route. After colonization of the colon, the liver is accessed via the portal vein. Symptoms can be similar to those of a pyogenic abscess. The US and CT appearance is similar to that of a bacterial abscess, but the patient may have a history of travel. The abscesses are often peripheral and on aspiration or drainage classically contain “anchovy paste” material. The diagnosis can be confirmed with serology. Treatment is with metronidazole (Flagyl), frequently in combination with percutaneous drainage. Efficacy of therapy can be followed with US, but it may take up to 7 months for the lesions to resolve (Fig. 14-11).
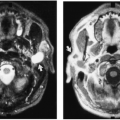
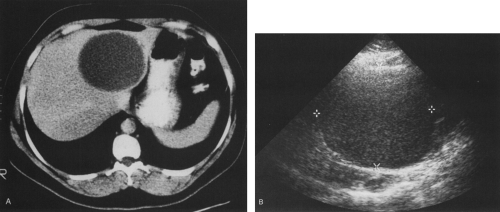 FIG. 14-11. Amebic abscess. A: On contrast-enhanced computed tomography, a fluid-density lesion is seen in the left lobe. B: Large amebic abscess marked by calipers on ultrasound. The lesion contains diffuse low-level echoes. |
Echinococcal Disease
Infections caused by Echinococcus granulosis (hydatid cyst disease) are more common worldwide than in North America. Echinococcal disease causes symptoms similar to those of pyogenic abscess, but the clinical demographics may suggest the diagnosis. Abscesses are more common in the right lobe; they may be multiple and may involve the chest. They grow slowly and are often cyst-like in appearance. On US, classic descriptive terms such as “double line sign,” “water lily sign,” and “racemose” are used to describe the cyst walls. There is a double-layered cyst with an inner germinal layer membrane that gives rise to “daughter cysts.” Daughter cysts are visualized within the parent cyst in 70%. Fifty percent have shell-like calcifications in the thick wall around the cyst on CT or plain films (Fig. 14-12). Controversy remains concerning whether the drainage should be percutaneous or surgical because of the possibility of anaphylactic shock.
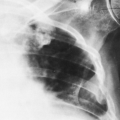
 FIG. 14-12. Peripherally calcified echinococcal (hydatid) cysts in the liver on plain film of the abdomen. |
Fungal Abscesses
With an increasing population of immunocompromised patients, there is an increasing frequency of fungal microabscesses of the liver and spleen. These are most commonly caused by Candida and other fungi. Other organisms include Pneumocystis carinii, cytomegalovirus, and mycobacteria (Fig. 14-13). In addition, immunocompromised patients may have hepatic involvement by Kaposi’s sarcoma and lymphoma which are variable in appearance (Fig. 14-14). Attempts to biopsy the lesions are often unrewarding. The patient’s CD4 count and findings elsewhere in the abdomen can be useful to narrow the radiologic differential diagnosis.
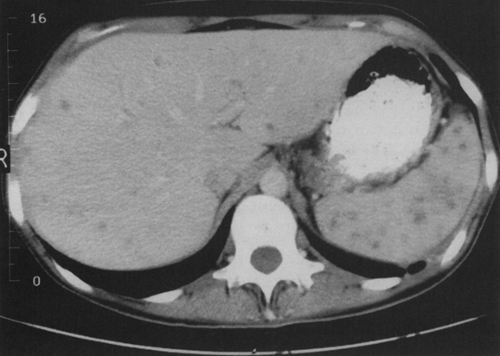 FIG. 14-13. Candida microabscesses in the liver and spleen in a leukemia patient with candidiasis. |
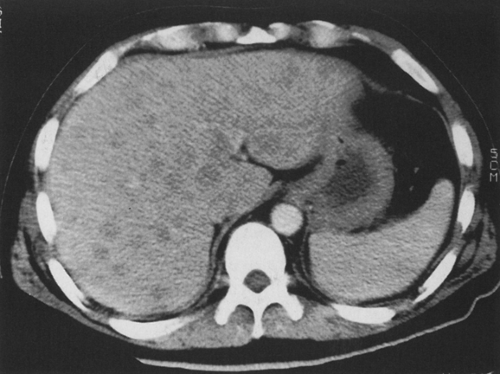 FIG. 14-14. Multiple liver masses caused by lymphoma. |
Hepatic Adenoma
Hepatic adenomas are seen almost exclusively in women of childbearing age (98%) and are linked to use of oral contraceptives, as well as use of anabolic steroids and glycogen storage disease. They are composed of atypical hepatocytes with increased amounts of fat and glycogen. They are usually asymptomatic but can cause pain if they hemorrhage. They are considered a clinically significant lesion because of the propensity for hemorrhage and a slight malignant transformation potential.
On US, they are typically well defined with variable echogenicity. They are virtually indistinguishable from focal nodular hyperplasia (FNH). On CT, they are discrete, low-density lesions with a mean size of 10 cm. They are multiple in 30% of patients. They can exhibit dense enhancement during early IV bolus injection. Half have areas of heterogeneity as a result of hemorrhage and necrosis. On MRI, hepatic adenomas are inhomogeneous on all pulse sequences, with some increased signal on T1-weighted images caused by increased amounts of glycogen and fat. Nuclear medicine
imaging shows a cold lesion with sulfur colloid in 80%; 20% are of normal activity when compared with the remainder of the liver.
imaging shows a cold lesion with sulfur colloid in 80%; 20% are of normal activity when compared with the remainder of the liver.
Focal Nodular Hyperplasia
FNH is a nonencapsulated lesion that is more common in women and is usually asymptomatic. The lesion is more common than hepatic adenoma, and it is being discovered more frequently with dynamic CT imaging. FNH is composed of normal hepatocytes, Kupffer cells, and bile ducts in an abnormal arrangement. The lesion is usually less than 5 cm in diameter and rarely multiple. The most common location is the periphery of the right lobe. The classic appearance is that of a solitary, well-circumscribed mass with a central stellate scar of fibrosis. However, the central scar is seen in only 20% of cases (Fig. 14-15).4
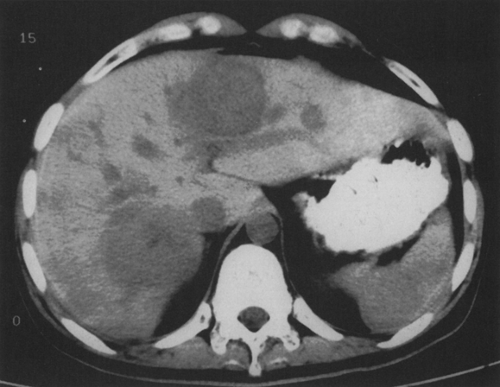 FIG. 14-15. Three focal nodular hyperplasia lesions. The lesions are of low density on noncontrast-enhanced computed tomograms. |
FNH is of variable echogenicity on US. It may be seen only during the hepatic arterial phase of enhancement on CT. The only clinical significance of FNH is in its differentiation from other liver lesions, particularly fibrolamellar carcinoma, which can also contain a central hypodense area. MRI may be of benefit. On T2-weighted images, the central scar is of high signal intensity in FNH, while it is of low signal intensity in fibrolamellar carcinoma. The sulfur colloid scan is normal in 50% of patients with FNH; a cold area is seen in 40%, and a focal area of increased activity is seen in 10% of cases.
Focal Fat Infiltration or Sparing
Focal fatty infiltration is more common in the right lobe of the liver and is associated with obesity, alcohol abuse, use of steroids, and hyperalimentation. It is an area of increased echogenicity on US in a lobar or segmental distribution. The margins are angulated, and there is no mass effect on adjacent vessels. CT shows a patchy or focal area of decreased attenuation. Typical areas occur adjacent to the falciform ligament or in the gallbladder fossa. There can also be areas that are spared of fatty infiltration. These can cause pseudomasses and should always be considered in patients with a fatty liver. The areas are hypoechoic on US and hyperdense on CT (Fig. 14-16). Characteristic locations for sparing are the caudate lobe, the periportal regions, and adjacent to the gallbladder fossa.
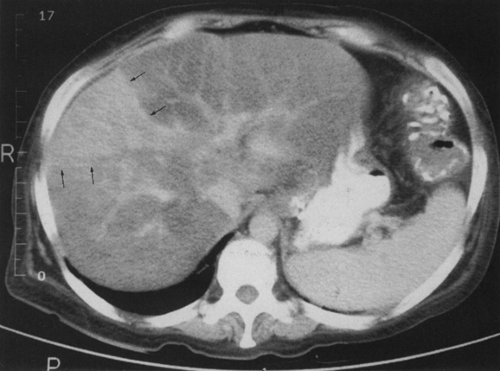 FIG. 14-16. Fatty infiltration of the liver with a large area of sparing, which is of higher density. |
Hepatocellular Carcinoma
The most common visceral malignancy worldwide is HCC or hepatoma. In the United States, the most common risk factor is alcoholic cirrhosis. Worldwide, hepatitis B is the most common cause. Other risk factors include hemochromatosis, Wilson’s disease, and glycogen storage disease. The disease is much more common in men.
The three patterns of hepatoma are solitary mass (50%), multifocal involvement, and diffuse infiltration. Eighty percent of patients have underlying cirrhosis, which is usually evident on imaging studies. Invasion of the portal vein is seen in 30% to 60% of cases. Associated clinical findings include increased α-fetoprotein levels in more than 70% of cases, increased LFTs, weight loss, right-upper-quadrant pain, ascites, and hepatomegaly. The prognosis is poor, with an average survival time of 6 months.
The US appearance of HCC is variable. A discrete hypoechoic mass may be present, or the tumor may be undetectable because of diffuse infiltration of the parenchyma. Hepatomas can be difficult to detect in a severely cirrhotic liver with a coarse echotexture.
On a noncontrast-enhanced CT, a hepatoma is usually a hypodense mass, but it can have areas of increased attenuation or even contain fat density. Eighty percent demonstrate some contrast enhancement during the hepatic arterial phase (Fig. 14-17).2,8 MRI demonstrates decreased signal intensity on T1-weighted images and increased signal on T2-weighted images relative to normal liver in most cases. A cold defect seen in a cirrhotic liver on a sulfur colloid scan is suggestive of HCC. The lesion has increased activity on a gallium scan.
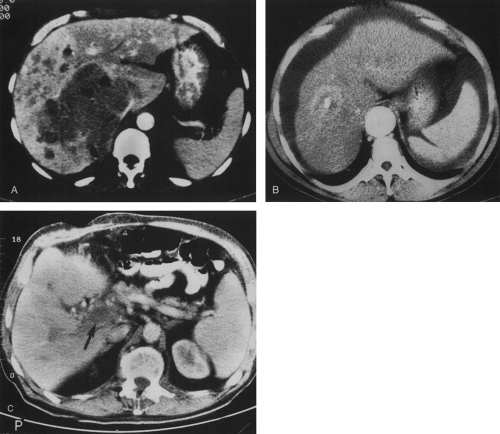 FIG. 14-17. Hepatoma. A: Multifocal hepatoma. A large mass occupies the right lobe. B: Hepatoma with peripheral and central enhancement on dynamic computed tomography. Most hepatomas can be detected in the hepatic arterial phase of enhancement. C: Portal vein thrombosis (arrow) is associated with hepatoma. |
Fibrolamellar Carcinoma
Fibrolamellar carcinoma is a subtype of HCC that occurs in younger patients without risk factors for HCC. The tumor has a better prognosis but can be large at diagnosis.13 α-Fetoprotein levels are not elevated. The sonographic appearance on CT is that of a well-defined mass with a central area of low density, similar to the stellate scar seen in FNH. MRI can be useful to differentiate the two abnormalities. The central scan is of low signal on both T1 and T2 with fibrolamellar carcinoma. Additionally, the presence of calcifications in the lesion is suggestive of fibrolamellar carcinoma (55%) rather than FNH (2%).
Metastatic Disease
Related posts:
Stay updated, free articles. Join our Telegram channel

Full access? Get Clinical Tree


