The Normal Brain Scan
Alfred Buck
Valerie Treyer
Bruno Weber
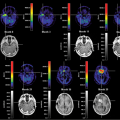
In order to interpret clinical brain positron emission tomography (PET) scans, it is important to know the appearance of the tracer distribution in the normal brain. For clinical purposes, the most commonly used tracer is fluorodeoxyglucose (FDG). An example of a normal FDG distribution is shown in Figure 21.2. In healthy tissue, the FDG distribution reflects cerebral glucose metabolism, which is most prominent in gray matter. The brain is the organ with the highest glucose consumption in the body. Consequently, there is high physiological FDG uptake in gray matter. FDG uptake in the brain is heavily dependent on the plasma glucose level, and with increasing plasma glucose levels, cerebral FDG accumulation decreases. This can be a problem in PET scans of diabetics. The high physiological FDG uptake in gray matter is a problem if lesions close to or within gray matter structures have to be identified or evaluated, especially if they demonstrate FDG uptake similar to that of gray matter. In such cases, it is mandatory to compare the FDG scan with an MR scan, which ideally should be available in digital format for image coregistration.
Cerebral perfusion can be measured with H215O and PET; because of the tight coupling of glucose metabolism and blood flow in the brain, FDG and H215O have the same qualitative appearance. With SPECT, there is no tracer to visualize glucose metabolism; however, blood flow imaging using technetium 99m [99mTc]HMPAO or [99mTc]ECD is very common.
In tumor imaging, amino acid analogs and choline derivates open interesting perspectives.
Specific Tracers
FDG
The great majority of the clinical brain scans are performed with fluorodeoxyglucose (FDG). It is important to bear in mind that FDG traces glucose metabolism and that all structures with high glucose demand will demonstrate high FDG uptake. In the head, not only the brain but also muscles, glands, and lymphatic tissue may display high FDG accumulation (see Fig. 33.21). An example of increased FDG uptake in the eye muscles is shown in Figure 21.1, and when searching for tumor metastases, the high uptake of FDG may be an imaging pitfall. In a healthy brain, it is actually possible to determine glucose metabolism quantitatively. The method was introduced by Sokoloff et al. (1). However, quantification of glucose metabolism is complex and usually not required for clinical purposes. Luckily, simple FDG uptake after a certain period is sufficient for clinical diagnosis. Typically, scanning is initiated 40 minutes following injection of FDG. In 3-D mode, enough counts are acquired during a 10-minute scanning period if the injected activity was on the order of 100 to 200 MBq. With lower activity, the scanning duration has to be extended accordingly.
Although the mass of the brain is only a small fraction of the mass of the whole human body, it utilizes about 25% of the total metabolic energy. Most of the energy demand is believed to be necessary for the maintenance of intra-extracellular ionic gradients by active sodium–potassium pumps. Moreover, the highest glucose consumption is believed to be localized around the pre- and postsynaptic zone. An excellent introduction on brain energy metabolism is given by Magistretti (2). Only in particular circumstances can substrates other than glucose be utilized by the brain.
A typical normal brain scan, together with a T1-weighted MR image, is shown in Figure 21.2. The resolution of the PET scanner used was around 6 mm (full width
at half maximum [FWHM]), while the cortex is approximately 2 to 4 mm thick. As a result, the actual concentration of FDG in the cortex is somewhat underestimated. Nevertheless, there is reasonable delineation of anatomic structures. It is easy to identify the cortex, the putamen, the head of the caudate, the thalamus, the cerebellum, and the brain stem. The high physiological FDG uptake in the brain is ideal for the study of brain metabolism.
at half maximum [FWHM]), while the cortex is approximately 2 to 4 mm thick. As a result, the actual concentration of FDG in the cortex is somewhat underestimated. Nevertheless, there is reasonable delineation of anatomic structures. It is easy to identify the cortex, the putamen, the head of the caudate, the thalamus, the cerebellum, and the brain stem. The high physiological FDG uptake in the brain is ideal for the study of brain metabolism.
Related posts:
 PET Radiopharmaceuticals: Perfusion Compounds [13N]Ammonia, [15O]Water, [82RB]Rubidium, and Other Generator Products of Clinical Relevance
 Brain Tumors: Astrocytoma, Oligodendroglioma, and Glioblastoma Images with PET and SPECT
 Sentinel Node Imaging in Head and Neck Tumors
 PET-CT and SPECT-CT of Bone Metastases
 SPECT and PET in Benign Thyroid and Parathyroid Disease
Stay updated, free articles. Join our Telegram channel

Full access? Get Clinical Tree


