, Leonid Tiutin2 and Thomas Schwarz3
(1)
Russian Research Center for Radiology and Surgery, St. Petersburg, Russia
(2)
Department of Radiology and Nuclear Medicine, Russian Research Center for Radiology, St. Petersburg, Russia
(3)
Department of Nuclear Medicine Division of Radiology, Medical University Graz, Graz, Austria
Abstract
The method of positron emission tomography (PET) is based on the phenomenon of spontaneous positron emission by the nuclei of some unstable ultra-short-lived radionuclides (USLRs), in which the number of protons exceeds that of neutrons. The positron annihilates with an electron, releasing two gamma-photons having the same amount of energy (511 keV) and moving in opposite directions at almost 180° apart (close to collinearly) (Kukekov and Fadeev 1986). Annihilation does not take place in the orbit of its own atom since the positron must first lose its kinetic energy. The length of the flight of the positron from the emission point to the annihilation point depends on its own energy and on the density of the environment. It can fluctuate within a wide range. For example, in the muscle it varies from 1 to 8 mm. This is one of the reasons why PET has a smaller resolving capacity than some other radiodiagnostical methods (MRI, CT). Probably in modern positron emission scanners in which space resolution is 1–6 mm (FWNM), the physical limit of the method’s resolving capacity has been reached (Phelps 2004; Gevorski and Plotkin 2006).
1.1 Characteristics of Positron Emission
The method of positron emission tomography (PET) is based on the phenomenon of spontaneous positron emission by the nuclei of some unstable ultra-short-lived radionuclides (USLRs), in which the number of protons exceeds that of neutrons. The positron annihilates with an electron, releasing two gamma-photons having the same amount of energy (511 keV) and moving in opposite directions at almost 180° apart (close to collinearly) (Kukekov and Fadeev 1986). Annihilation does not take place in the orbit of its own atom since the positron must first lose its kinetic energy. The length of the flight of the positron from the emission point to the annihilation point depends on its own energy and on the density of the environment. It can fluctuate within a wide range. For example, in the muscle it varies from 1 to 8 mm. This is one of the reasons why PET has a smaller resolving capacity than some other radiodiagnostical methods (MRI, CT). Probably in modern positron emission scanners in which space resolution is 1–6 mm (FWNM), the physical limit of the method’s resolving capacity has been reached (Phelps 2004; Gevorski and Plotkin 2006).
1.2 Principles of Detection of Positron Decay
The main components of a PET scanner are: gantry, movable support (bed) to position a patient in the ring, computer stations to collect and store raw data (the so called sinograms), as well as to reconstruct, process and store images and to obtain hard copies. An important component of the detector ring is the detector block, composed of several crystals connected with a group of photomultipliers in one case. The physical characteristics of the scanner depend to a great extent on the size, form and properties of the materials composing the crystals in the detector block as well as on the diameter of the detector ring.
The interaction between the gamma-photon and the crystal induces scintillation of the latter. As a reaction to scintillation, an electric pulse occurs in the photomultiplier, which can be detected and processed by a computer complex (Gevorski and Plotkin 2006; Khmelev et al. 2004).
In the detector ring of the PET scanner, pairs of highly sensitive detectors, housed in rings, work for coincidence. If a pair of detectors located opposite each other detect two gamma photons within the range of coincidence, we can state that the annihilation point is on the line that unites them (coincidence line) (Fig. 1.1). Annihilation need not necessarily occur exactly in the middle between the detectors. That is why the so called “coincidence window” is used for PET, admitting a temporary deflection of the detection of radiation by pairs of detectors from 4.2 to 12 ns. The event is detected and recorded in the form of polar coordinates (the angle and the radius) in a sinogram. A sinogram is a curve representing the number of recorded events for every coincidence line. The location of every crystal has a space representation in the electronic matrix of the computer which sets the space coordinates of the radiation point. The detection of several lines going through a given annihilation point permits to precisely determine its coordinates (Fig. 1.2). The number of pulses obtained in a given crystal depends on the physical properties of the radioactive source and reflects its qualitative characteristics. The sinogram is processed (reconstructed) by the computer in order to determine the distribution of radioactivity in the slice and to visualize the examined object (Khmelev et al. 2004; Phelps 2004).
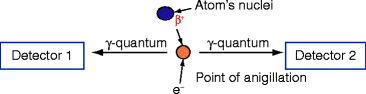
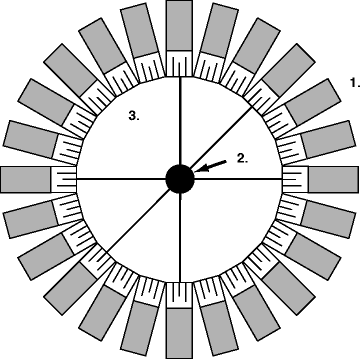
Fig. 1.1
Scheme of positron decay detection
Fig. 1.2
Mechanism of positron (two-photon) emission. Note: 1 the ring of detector-blocks, 2 radiation source, 3 lines going through the radiation source and connecting pairs of detector-blocks
Besides genuine coincidences, scattered and random coincidences resulting from different annihilations are detected. Scattered coincidences are related to the Compton effect, according to which they change their movement directions. To separate genuine radiation from scattered and random photons with lower energy, an energy window is used with a center of 511 keV (Khmelev et al. 2004; Phelps 2004; Gevorski and Plotkin 2006).
The above-mentioned characteristics of PET permit a genuine signal to be singled out and detected, satisfying energy and time demands. The indicated way of detecting the signal realized in positron tomographs was called “electronic collimation”. Electronic collimation has replaced the use of physical collimators. Consequently, the sensitivity of PET became higher by a factor of a hundred or thousand compared with single photon emission computer tomography and correct measurements of fast biochemical processes on tomographic slices of any organ or tissue became possible (Khmelev et al. 2004; Gevorski and Plotkin 2006).
To process a signal, some (although not much) time is required during which the detector is not able to detect new events – the so-called “dead time”. The degree of signal loss due to the dead time depends on the speed of the scanner and on the value of radioactivity in the field of view of the tomograph. Contemporary PET scanners are able to maintain a wide range of computing rates without significant losses in resolving capacity (Phelps 2004; Gevorski and Plotkin 2006).
To reduce the number of scattered and random coincidences in PET scanners, limiting screens of lead or tungsten (septa) are used. The radiation detection process using a septum is called a two-dimensional (2D) regime; without a septum it is called a three-dimensional (3D) regime (Fig. 1.3). Using a 2D mode permits images with a low-level noise and the highest resolving capacity to be obtained. However, in this case the sensitivity of the tomograph (i.e., the relation of the number of annihilation acts detected in the field of view of the tomograph with regard to their genuine number in the field of vision) decreases several times; scanner sensitivity being defined by the properties of detector blocks, the diameter of the detector ring, the mode of data acquisition (2D or 3D) and the duration of scanning. The maximum positron scanner sensitivity is achieved by scanning without a septum in the 3D mode (Fig. 1.3b). However, in this case the noise level grows twice and dead time losses increase. The 2D mode, compared with 3D mode, permits a greater accuracy in quantitative analysis and treatment efficiency control to be attained. So, the choice of the scanning mode is conditioned by a particular clinical task. Presently, hybrid PET-CT scanners are produced where there is no septum and only the 3D mode is used.
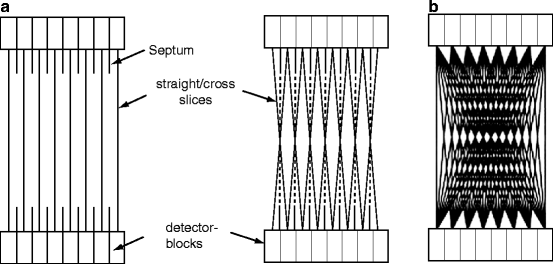
Fig. 1.3
(a) Two-dimensional scanning mode. (b) Three-dimensional scanning mode
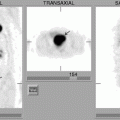
In PET scanners, photon absorption correction is provided – that is correction for the irregularity of absorption of ionizing radiation by tissues (attenuation correction) from radioactive transmission sources of 68Ge and 137Cs (Ruhlmann et al. 1999; Phelps 2004; Gevorski and Plotkin 2006). This attenuation correction is necessary to compensate for radiation distortion and to attain a higher accuracy of reproducing the distribution of the radionuclide label in tissues. In contemporary tomographs, transmission sources are built into the detector ring. The control is remote, which ensures security and lessens exposure to radiation of the personnel. For example, in Fig. 1.4 we show images of a homogeneous photon of 68Ge with attenuation and without it. The picture shows that the accurate reproduction of radioactive label distribution in a tomographic slice is impossible without absorption irregularity correction. The correction of the irregularity of radiation absorption by tissues is also a necessary component of the quantitative analysis of PET images. In PET-CT combined scanners, digital data are used for this purpose, which are obtained by means of CT. The efficient beam energy of X-rays in CT is 70–80 keV. Consequently, PET images corrected with help of CT attenuation correction differ from images obtained by using radioactive sources with an energy of 511 keV. For the same reason, PET-CT data processing results in non-linear attenuation coefficients which induce a distortion of the genuine distribution and leads, to overstating radiation accumulation in dense tissues, particularly in the bones. As a result, quantitative measurements of the same formations and tissues done by means of PET and PET-CT scanners can differ by 1.5–2 times (Khmelev et al. 2004; Gevorski and Plotkin 2006). Using contrast agents in CT brings about additional distortions and results in the appearance of artifacts on PET-images, significantly overstating the real radioactivity value in the focus of accumulation of the contrast agent (Gevorski and Plotkin 2006).
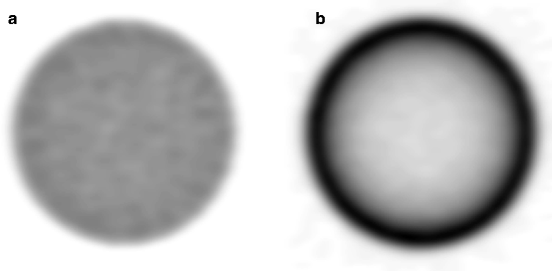
Fig. 1.4
Attenuation correction. (a) Image of the homogeneous 68Ge phantom performed with attenuation correction. (b) The same image performed without attenuation correction
In first-generation PET scanners, some part of the equipment was situated outside the tomograph due to its large size and required separate rooms. There were problems concerning speed, screening, and conditioning. The improvement of hardware and video technique and the appearance of personal computers permitted to significantly lessen the size of the main components of PET scanners and to optimize their construction. As a result, the most important parts of modern scanners are located directly in the detector ring. Owing to this circumstance, tomographs became more compact; their speed increased and so did their stability, protection and reliability.
1.3 Reconstruction of Images, Data Processing and Analysis
The initial raw PET data concerning the examined object are collected in the computer in the form of sinograms. The reconstruction procedure permits an image based on sinograms to be obtained. Reconstruction can be performed in several ways. The choice of the particular way of reconstruction depends on the task and on the examined organ. For image reconstructions of such organs as brain or heart, the method of filtered back-projection (FBP or iterative method) is usually used. The iterative method has several modifications, such as MLE, OSE, and RAMLA. In case of whole-body examination, the iterative reconstruction algorithm OSEM is most frequently used, since it ensures the optimal quality of the image owing to smoothing. When brain and heart are examined, it is preferred to use simpler filters which distort least the genuine distribution of radiopharmaceuticals (RPs) in the slices. However, it should be noted that insufficient smoothing, especially when combined with low statistics can increase image heterogeneity, which provides more difficulty in interpreting the results. Too much smoothing can reduce resolution and finally bring about a loss of informativity of the image. Most scanner manufacturers recommend using factory protocols and reconstruction installations, as most are elaborate. A number of reports contain detailed descriptions of the image reconstruction principles and other physical characteristics of the PET method (Khmelev et al. 2004; Phelps 2004; Gevorski and Plotkin 2006).
The course of further image processing (postprocessing) and the obtention of the hard copies of images depend on the particular clinical task. At the first stage, PET-image processing includes their visual analysis in three projections (axial, sagittal and coronal projections). In the case of the whole-body examination, 3D image analysis is applied, which provides a more accurate idea of the localization and anatomical links of the examined area. The image standardization procedure is described separately for each organ in the corresponding chapters of the present book.
A necessary condition of a successful analysis is the precise knowledge of the normal distribution and pharmacokinetics of the RPs which are used. The notion of the physiologic (normal) distribution is specific for each RP and depends on its properties. Therefore the presentation of the results obtained comprises both the visualization of the state of the unaffected organs examined or of the whole body and the characteristics of the lesion area, including its localization, scintigraphic size, and regularity of RP distribution, contour accuracy and its relation to unaffected tissues. These tasks are solved as a rule by using image contrast range, colour scales and threshold level. The absence of anatomic reference points in the functional images provides certain problems concerning the interpretation of scintigraphic images. This is why in a number of cases accurate matching or fusion of images with different modalities is needed. Matching of functional PET images and the data of structural imaging (CT, MRI) is first of all required for an accurate anatomic localization of the revealed changes; it is also needed in the presence of significant physiological (individual) fluctuations of the levels of RP uptake in tissues. Besides, superimposing is necessary when the formation’s size is small and close to the resolving capacity of the tomograph and also when the formation has a high structural heterogeneity.
At the second stage, quantitative or semiquantitative PET-image analysis in absolute and relative values are applied. For semiquantitative analysis of the objects examined in whole-body examination, and since recently also in brain examination, a dimensionless value is used – the so-called standardized uptake value (SUV). SUV is defined as the relation of specific radioactivity in the measured zone (kBq/cm3) to the value of the introduced radioactivity per body mass MBq/kg. SUV is automatically calculated by the software of the scanner, taking into account the physical half-life period of the radionuclide. In image analysis using SUV, it should be noted that imprecise information on the patient’s weight and stature, the value of the introduced radioactivity and the time of its introduction as well as on the detector drift can induce serious errors. This is why it is accepted to consider as significant an SUV change during treatment which is more than 25% of the initial value.
Tumor/nontumor (T/NT) ratio is used to express the relation of radioactivity accumulated in the affected area to radioactivity in unaffected tissues (referent zones). In some cases it is appropriate to apply mathematical models implying dynamic scanning of the examined organ to calculate the “input function” – a curve of activity-time in arterial blood. To measure blood radioactivity, it is most convenient to scan the left ventricular cavity. Mathematical models are widely used in heart examinations: on the one hand, the high variability of metabolic processes in this organ limits the possibility of using simple quantitative analysis methods; on the other hand, the presence of the left ventricular cavity in the field of view of the tomograph makes it simpler to obtain the inline function.
1.4 Pet Data Quality Control
PET data quality control methods are divided into acceptance trials, regular control and parameter change of the tomograph during its exploitation. Acceptance trials are done during the installation of the equipment. In the process of trials, initial data on the operation factors of the scanner are obtained, which then serve as a model in daily or recurrent technical state control. Modern scanners are provided with reliable and easy-to-use means of control and image quality correction as well as of quantitative data reproducibility: normalization, cross-calibration and other procedures. During daily control, the deviation of the readings of detectors from the mean is automatically calculated, which permits evaluation of their state, revealing deviations from the admissible parameters and identifying and localizing faults. Normalization is carried out if the admissible deviation of the sensitivity of the opposite pairs of detectors is exceeded by more than 2.5%. For this purpose, a standard calibration phantom with determined specific radioactivity is brought into the field of view of the scanner. During normalization, the so-called “blank scan” is created which is necessary to align as much as possible the field of view of the scanner during image reconstruction. During normalization, the calibration factor (ECF) is also calculated, which is an integrated factor reflecting detector drift, physical decay of calibration sources and some other parameters having impact on the precision of the measurement. The value of ECF is specific for a given model of tomograph and depends on its construction. This factor is used also as a criterion of quantitative data reproducibility. For example, an ECF value deviation of more than 5% from its previous value requires aligning the field of vision of each of the detector blocks (set up). Homogenous calibration phantoms are fabricated using positron-emitting radionuclides (68Ge, 137Cs) with a half-life of 1–10 years. Radionuclides should be evenly distributed in the phantom. Measurement of a radionuclide is possible only before its introduction into the phantom and is carried out by means of a curiemeter. RPs are injected to the patient in the form of aqueous solutions; their radioactivity measurement is done in a given PET center. For matching of factory 68Ge phantom and a water phantom of known specific activity prepared in the PET center when changing calibration sources recalibration is performed. The accuracy of recalibrating the sources has an impact on the calibration factor (ECF) and on the outcome of the quantitative analysis in a given scanner (Khmelev et al. 2004; Phelps 2004; Townsend et al. 2004; Gevorski and Plotkin 2006).
Consequently, the available hardware arsenal ensures reliable PET data image and reproducibility quality control, which is crucial for clinical application of the method.
There can be hardware, software, control, biological and mixed artifacts. As a rule, hardware malfunctions are revealed during the daily checkup, which enables details of the damage to be determined. Sinogram analysis is also used for this purpose. The most frequent cause of hardware malfunctions is due to analog processors or bucket controllers getting out of order. When an analog processor gets out of order a stripe appears on the sinogram which corresponds exactly to the damaged processor. If a controller is damaged, the stripe is wider and it embraces all the processors of the controller. Damage to the detector block is revealed during daily calibration. The damaged block is identified by scanning according to a special program or by a “set-up” procedure. Identifying program or mixed errors is a more difficult problem. For example, the procedure of pulling out radioactive calibration sources from containers is carried out by applying a special programme. An error in its working makes the radioactive sources stop. This can look like a breakdown of the mechanism making them move out.
The operator’s errors (entering wrong information on the patient or on the introduced radioactivity) can be corrected by introducing the necessary amendments into the sinogram header with its subsequent repeated reconstruction. At the same time, errors in the data collection protocol or in positioning patients cannot be corrected retrospectively.
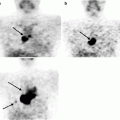
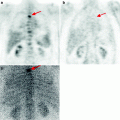
The causes of artifacts may also be due to injection errors, whereby some part or all of the RP is left in the injection spot, the radioactive substance flowing out from the vein together with blood and onto a soiled dressing; they may also be due to contamination with radioactive urine. When a radioactive substance gets to the patient’s arms and clothes it can be also transferred to the scanner; for example, to the patient bed of the tomograph. In this situation, one or several superficially located uptake foci appear on the image which can induce false-positive diagnostics of some diseases, for example in melanoma. Contamination detection always provides some difficulty. This is why an important way of dealing with artifacts is observing the methodology and having an accurate idea on the possibility and place of their appearance. In case of a suspicion of a contamination artifact, one can try to wash the radioactive substance off the skin surface, take off the contaminated clothes, change linen on the tomograph and wipe its surface. Another cause of artifacts is the patient’s displacement during scanning or moving organs (e.g., heart or lung excursion), which bring about a fuzzy image.
Related posts:
Stay updated, free articles. Join our Telegram channel

Full access? Get Clinical Tree


