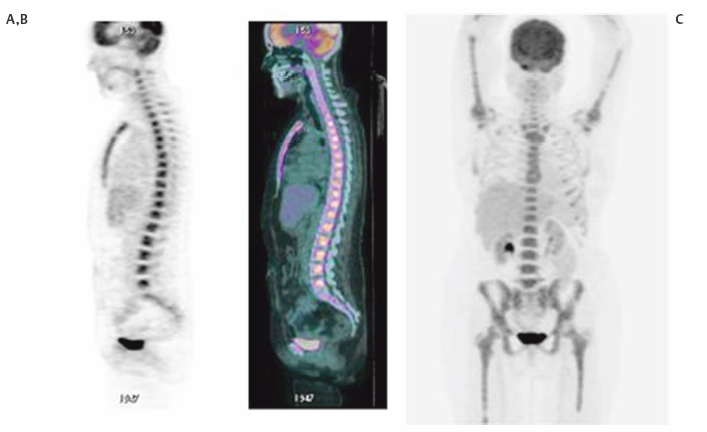
3 Ask most physicians to recall the enzymatic pathways of glucose metabolism, and you will likely provoke memories of premedical or medical school biochemistry classes where the common dictum was, “Glucose metabolism? Why do I need to know this stuff? I will never use this information again!” Fortunately, a few students of science and medicine have had the astuteness to realize that even the most mundane and obscure fact could someday come in handy. Such is the story of glucose metabolism and its relationship to [fluorine 18]fluorodeoxyglucose ([18F]FDG) positron emission tomography (PET) imaging. In 1924, Otto Warburg, a famous German biochemist, made a fundamental observation that would forever change the course of our understanding of the role of glucose metabolism in cancer biology. In an article published in the journal Biochemische Zeitschrift,1 he and his colleagues noted that cancer cells consume more glucose and produce more lactic acid than normal (resting) cells. This straightforward observation, later termed the Warburg effect in his honor, was apparent even under aerobic conditions. Because of his pioneering work, Warburg was awarded the Nobel Prize for Medicine and is considered one of the central figures in positron emission tomography (PET) imaging. One glucose molecule metabolized in the presence of adequate oxygen can lead to the production of 36 adenosine triphosphate (ATP) molecules with CO2 and H20 as its byproducts (so-called tricarboxylic acid, or TCA, cycle). However, in hypoxic conditions and in many cancer cell types, only two ATPs are formed from glucose metabolism, with lactic acid (glycolysis) produced as its by-product. These observations have given rise to several theories about the survival and tenacity of cancer even under the most formidable conditions.2–8 Yet it is the rather simplified pathway of glucose metabolism through the glycolytic pathway that has been responsible for the explosion of FDG PET imaging over the last few decades. Although a detailed understanding of the role of glucose metabolism in the context of the critical changes that occur to transform a normal cell into a malignant one is beyond the scope of this chapter, we will briefly focus on the biology of FDG imaging in the framework of what the clinician needs to know for everyday interpretation of FDG PET studies. We will attempt to provide a basic understanding of the changes that occur at the molecular level that account for the increased glucose metabolism in cancer cells and other benign inflammatory conditions. It is hoped that this chapter will serve as a starting point for our readers to delve further into the complex biology of glucose and FDG metabolism and to begin to appreciate the central role of glucose metabolism as a molecular probe in oncology imaging. Furthermore, this chapter will focus almost exclusively on the biology of FDG oncology imaging, but it will not address the biological changes that occur in cardiac or neurologic diseases. Finally, we hope that this chapter will help answer question the age-old question of “why you need to know this stuff.” The importance of glucose metabolism in malignancy has provided a foundation for understanding cancer biology. A decisive advantage of FDG in oncology imaging is that it behaves in so many ways like glucose. For example, glucose metabolism in most organs like the brain, heart, and visceral structures is closely coupled to blood flow. In some malignancies, such as breast cancer,9 there is an uncoupling of the flow-metabolism cycle with subsequent elevated glucose metabolism compared with surrounding normal tissue. This elevated glucose metabolic rate seems to be a vital mechanism needed to feed the various biological alterations that have transformed the host cell into a malignant one. Sanjiv Gambhir, in his chapter on the quantitative assay development for PET,10 directs his readers to pretend to be a molecule of FDG and then asks the readers to think about all of the different directions that they can go once they are injected into the body. If we play along with his thought experiment, we would begin our journey from the syringe into the bloodstream (plasma). Once in the blood, we would either leave the plasma space to enter the interstitium or travel in the blood to the kidneys, where we would be excreted because of our 18F atom on the 2-carbon position of the deoxyglucose molecule. If not excreted by the kidneys, we would be transported into the cell, and then we would proceed down the chemical reaction pathway of our journey. Once in the cell, most of us would be phosphorylated and chemically trapped by the glycolytic pathway and end up with our 18F moiety decaying; some of us would be kicked back out of the cell into the interstitium, eventually migrating back into the bloodstream and kidneys. If we brought a PET scanner to take pictures of our journey, we would inevitably find that many of us are congregating in a tumor against a low background of FDG in host tissues due to the rapid clearance of FDG from the bloodstream and body. When thought about in this way, we can begin to divide our journey into at least four different phases or spaces: (1) the vascular space, (2) the interstitial space, (3) the intra-cellular space, and (4) the FDG-6-phosphate (FDG-6-P) or glucose-6-phosphate (Gluc-6-P) space. The concentration (or, more precisely, the mass) of FDG in each of these compartments can be accurately measured by the PET scanner through kinetic analysis for detailed quantitative PET imaging, a feature that is unique to this modality. As kinetic analysis is cumbersome in routine clinical practice, a semiquantitative estimate of FDG concentration also exists in the form of the standardized uptake value (SUV). The interested reader is referred to many excellent review articles on this subject.11–14 It is very fortunate, if not fortuitous, that FDG behaves very similarly if not identically to glucose in the first three phases or compartments of the journey. FDG is circulated in the blood like glucose (vascular space). It migrates from the plasma space into the interstitium similarly to glucose (interstitial space). It is transported into the cells (intracellular space) via facilitated transport (whether malignant or not) just like glucose, utilizing a family of glucose transport proteins (GLUT). Although there are approximately 13 GLUTs,15 it is GLUT1 that is found in most noncardiac tissue, including tumors. This is important to remember because the translocation of GLUT1 from the cytosol to the cell membrane in tumors is an insulin independent process, whereas GLUT4 (whose presence predominates on the cell membrane in myocytes) requires insulin for it to translocate on the cell membrane. This phenomenon helps to explain why one needs to either inject a patient with insulin to perform myocardial viability PET studies with FDG or give an exogenous glucose load (initiates a spike in endogenous insulin production) to drive the tracer into the myocytes; however, this is not required for oncology or neurology PET imaging. Once glucose or FDG is internalized into the cell, it is acted upon by hexokinase II (HK II) in a similar way to glucose. HK II phosphorylates both glucose and FDG to glucose-6-phosphate (G-6-P) or FDG-6-phosphate (FDG-6-P), respectively. Once in the G-6-P form, this moiety can be further degraded through the glycolysis or TCA cycle to produce ATP for cellular energy and metabolism. However, FDG-6-P cannot undergo further metabolism. Furthermore, the negative charge from the phosphate group on FDG-6-P serves to trap it in the cell. Because cancer cells metabolize more glucose than host cells, they will accumulate more FDG, thus paving the way for detection on PET (Fig. 3.1). Fig. 3.1 Metabolism of [fluorine 18]fluorodeoxyglucose ([18F]FDG). Cartoon depicts the metabolism of FDG at a very basic level. FDG (stick figure in cartoon with blue head and FDG backbone body) in the extracellular space is taken up by the cell via facilitated transport through the glucose transport protein [GLUT; This difference in glucose metabolism between host cells and cancer cells is not the only explanation for elevated FDG-6-P activity in the malignant cell. Some cells, such as hepatocytes, have increased glucose-6-phosphatase activity (G-6-Pase). This enzyme is responsible for dephosphorylating both G-6-P and FDG-6-P back into their respective native forms, which then allows them to diffuse back out of the cell. Indeed, some tumors, like low-grade hepatocellular carcinomas, have increased G-6-Pase, which might account for their low metabolic potential (relative lack of FDG accumulation; see next section).16 The presence of FDG in a particular cell, tissue, or organ—and even in the whole body—is dependent on multiple factors and cannot be simplified to a single mechanism. Much of the FDG uptake, however, is dependent upon the balance of local factors and the metabolic behavior occurring at the organ and whole body level. At the cellular level, the following components have been implicated in promoting elevated FDG uptake in malignant cells compared with host cells. All these different mechanisms contribute to FDG uptake in tumors, making PET very sensitive for many tumor types; however, these processes also occur in nonmalignant tissues. For example, inflammatory cells also demonstrate increased GLUT1, which can simulate malignancy when associated FDG uptake is intense.17 The inflammatory-type uptake has been especially noted in macrophages, neutrophils, histiocytes, and lymphocytes. As noted before, some tumors have higher than average G-6-Pase compared with other tumors, which favors egress of FDG activity out of the cell and, subsequently, diminished lesion conspicuity on the PET scan. In short, the mechanism for increased glucose metabolism can be different for different cells. Thus, FDG uptake can be dependent upon blood flow (cardiac tissue), HK II activity (most tumors), and dephosphorylating activity (brain tissue and hepatocytes).18,19 At the tissue level, FDG uptake is closely linked to the number of viable cells, proliferation activity, tissue perfusion (or neovascularity), hypoxia, and presence of inflammatory cells.20–22 It is the balance of these factors that can control the overall activity and even heterogeneity of FDG activity in the tissue. For example, some early studies demonstrated a significant FDG accumulation in macrophages and granulation tissue over the tumor cells in patients with non-small cell lung cancers.23 Finally, there is some preliminary evidence that endothelial cells in tumor vessels can have enhanced FDG metabolism and account for some of the FDG activity observed on PET scans.24 At the organ level, the amount of FDG uptake is closely linked to organ perfusion, tumor volume, intrinsic glucose metabolism, and presence of inflammatory responses such as concurrent chemotherapy and radiation therapy or stimulated glucose metabolic activity from the use of medications (e.g., colony-stimulating factors) (Fig. 3.2). In addition, some tumors, like well-differentiated thyroid and prostate cancers, have FDG uptake based on their endocrine responsiveness. As these tumors dedifferentiate, their hormone responsiveness decreases while their FDG uptake increases and is an indicator of poor prognosis.25,26
The Role of Glucose and FDG
Metabolism in the Interpretation
of PET Studies
Ronald L. Korn, Alison Coates, and John Millstine
 The Breakdown of Glucose/FDG from Injection to Cell Entry
Similarities between Glucose and FDG
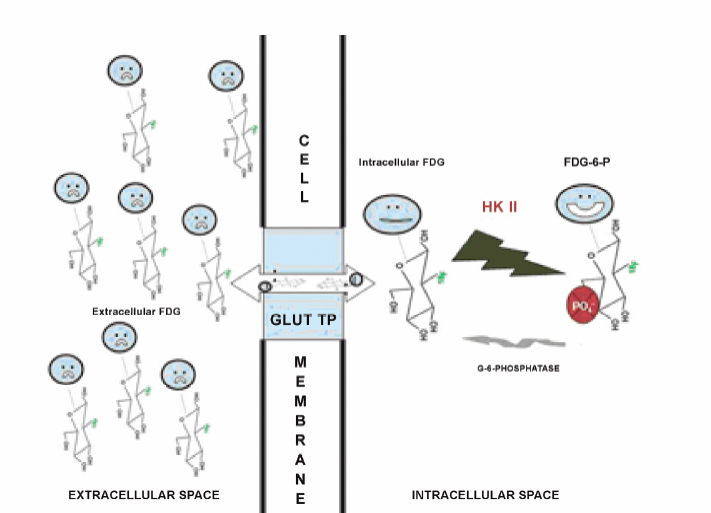
 ]. There are at least 13 different types of GLUTs. GLUT1 is the prominent protein that is responsible for most of the FDG uptake in malignant and many inflammatory cells. Once in the cytosol, FDG is phosphorylated by hexokinase II [HK II;
  ] to form FDG-6-P. The FDG-6-P is essentially trapped in the cytosol of the cell and cannot either participate further in metabolism or diffuse out of the cell due to the negative charge on the phosphate group. A small fraction of the intracellular FDG-6-P can be dephosphorylated back to FDG by the action of glucose-6-phosphatase (
 ). This “free” fraction of FDG can diffuse back out of the cell via GLUT. It is the relative balance of these processes that determines the overall FDG activity in a cell.
 FDG Activity in Different Cells, Tissues, Organs, and Bodies
Cellular Level
Tissue Level
Organ Level
Radiology Key
Fastest Radiology Insight Engine

