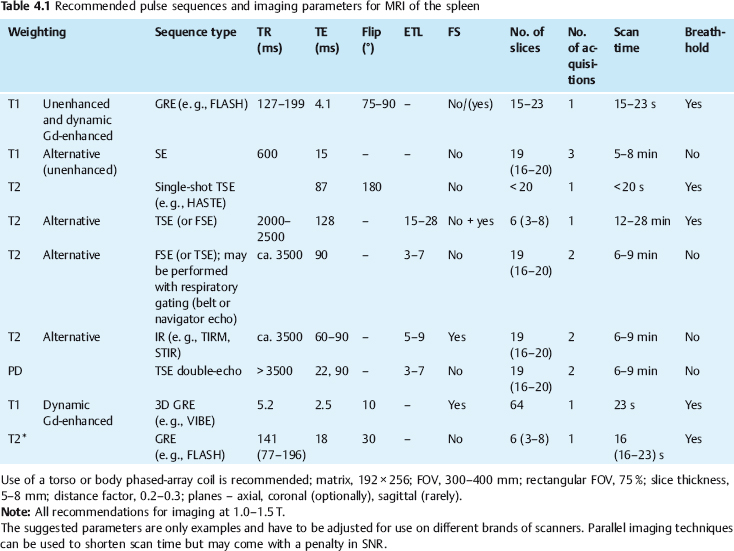
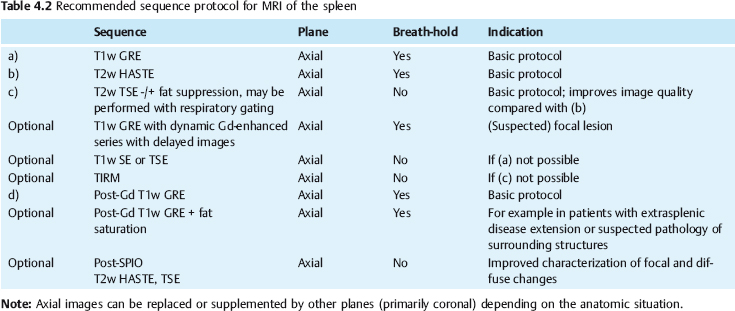
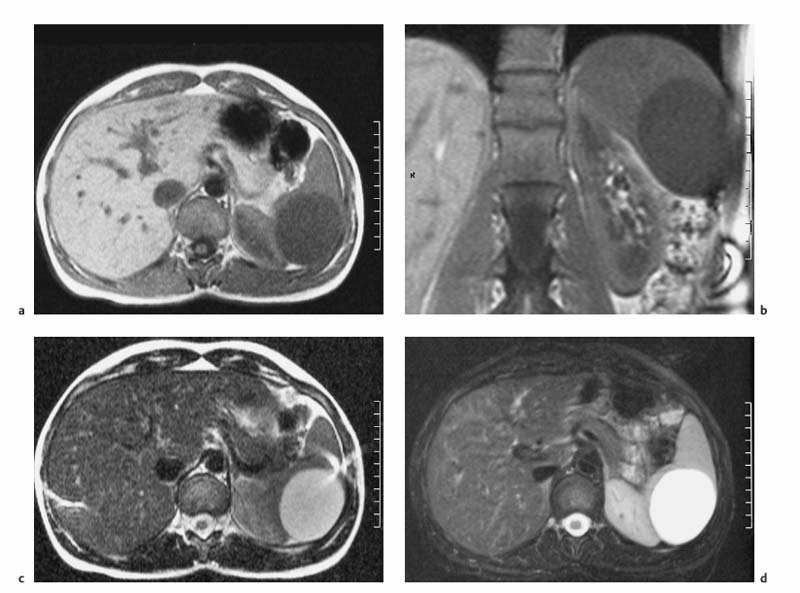
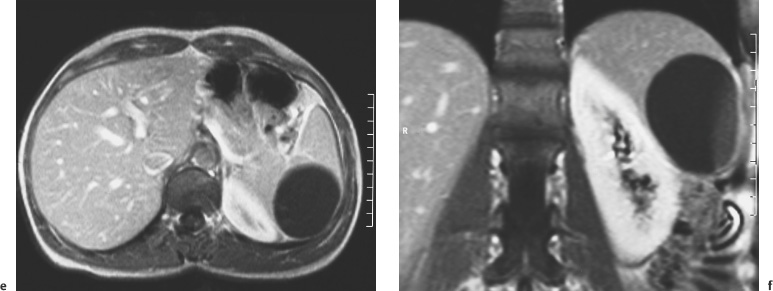
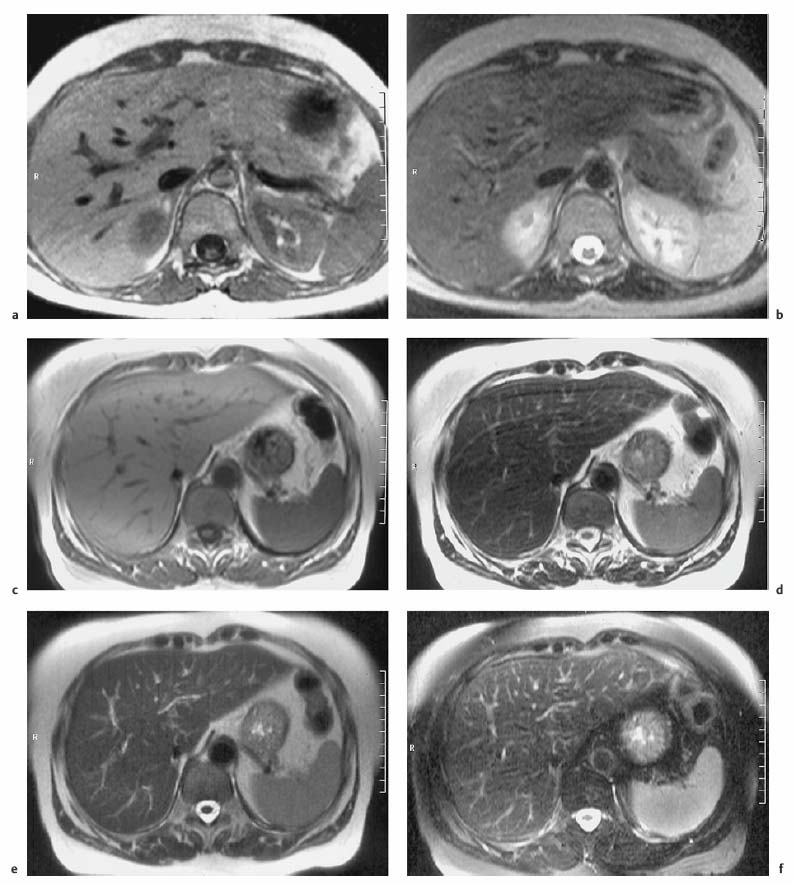
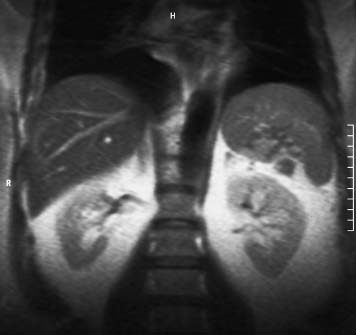
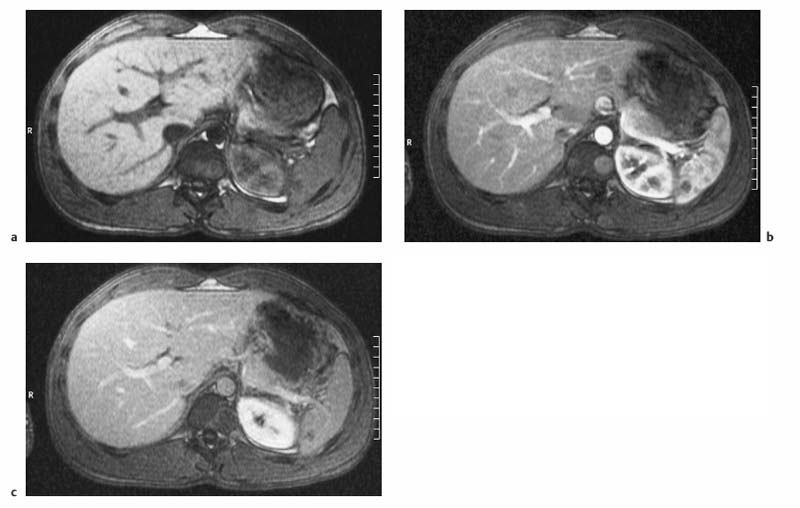
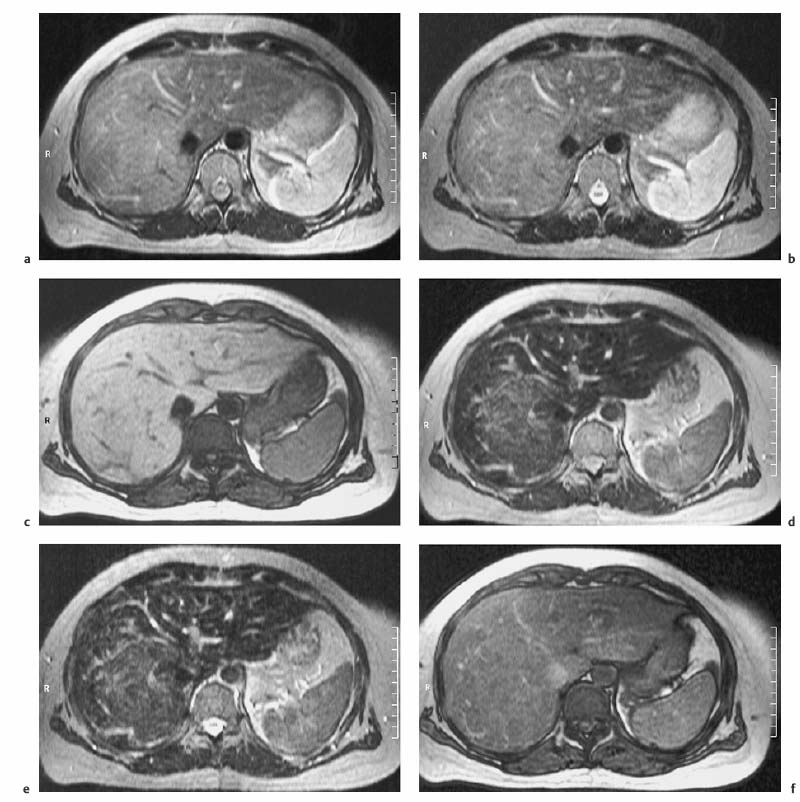
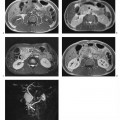
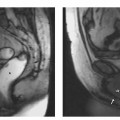
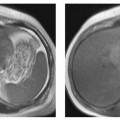
4 The Spleen The spleen is a lymphatic organ that can be regarded as a large lymph node integrated into the blood circulatory system. At the same time, with its special vascular architecture, the spleen also affects the nonlymphatic cells in the blood. As a functionally complex organ, the spleen thus has a central, though not vital, role in adult life, which is why many disease processes involve the spleen, while primary splenic disease is fairly uncommon.1,2 There are no established indications for MRI of the spleen because ultrasound and CT allow excellent diagnostic evaluation of this organ. Relative indications for MRI exist in the staging of lymphoproliferative disease (Hodgkin and non-Hodgkin lymphoma) and characterization of focal splenic lesions. MRI is also a suitable imaging modality for planning infradiaphragmatic radiotherapy in patients with lymphoproliferative disease as coronal sequences give an excellent overview of the vascular anatomy in the splenic hilum. Another relative indication is the follow-up of posttraumatic splenic hematoma in pediatric patients with inconclusive sonographic findings after nonsurgical treatment. Before the examination, the patient is given a general explanation of the procedure (e. g., duration of breath-holds) including information about placement of an intravenous line for contrast injection–either Gd-based extracellular contrast medium or SPIO particles (superparamagnetic iron oxide)–and the need for administering an antispasmodic drug (e. g., butylscopolamine or glucagon). Oral contrast is not required for MRI examinations of the spleen. Coil selection depends on the equipment available (e. g., torso or body phased-array coil). Scanning is performed with the splenic hilum in the isocenter of the magnet. To this end, the patient is positioned supine with the alignment light of the scanner centered at the level of the xiphoid process. The axial plane is the backbone of a dedicated examination of the spleen (Fig. 4.1). Additional coronal imaging is helpful if the patient’s breath-hold capacity and the MR equipment allow acquisition of good-quality images during breath-hold (Fig. 4.2). The spleen is imaged with a slice thickness of 6–8 mm and an interslice gap of 2 mm. The basic protocol consists of unenhanced T1w and T2w sequences. T1w images are acquired with an SE or TSE sequence but preferably with a 2D GRE sequence during breath-hold. All of these sequences are acquired with the shortest possible TE to optimize image contrast. Unenhanced T2w imaging is performed with a breath-hold single-shot TSE sequence (e. g., HASTE). Because these 2D sequences have short acquisition times, basic imaging in the axial plane can be supplemented by a coronal sequence, or even sagittal images if needed, with only a minimum of additional time. A free-breathing TSE sequence with fat suppression (e. g., inversion recovery technique, spectral fat saturation) may improve image quality but takes longer to acquire. The image quality of free-breathing T2w sequences can be improved by using respiratory gating (respiratory bellows, navigator echo technique), which will markedly reduce motion artifacts. (Tables 4.1 and 4.2). Intravenous bolus injection of extracellular Gd-based contrast medium (e. g., Magnevist, Dotarem) with dynamic acquisition of serial contrast-enhanced T1w images is recommended to detect and characterize focal lesions in the spleen. The dynamic images are acquired with a GRE sequence during breath-holds before and 15 s, 45 s, 90 s, and ca. 3 min after injection of the contrast medium at a dose of 0.1 mmol Gd per kg body weight. Immediate postcontrast T1w GRE images allow sensitive detection of focal splenic lesions3,4 (Fig. 4.3). Additional late postcontrast images should be acquired after ca. 6–10 min using a fat-suppressed SE or TSE sequence or fat-suppressed GRE sequence. Alternatively, the dynamic T1w series can be acquired with a 3D GRE sequence (e. g., VIBE), which has higher spatial resolution and produces an angiographic effect while slightly reducing soft tissue contrast. Instead of an extracellular Gd-based contrast medium, an SPIO preparation can be infused or injected. Examples of commercially available SPIO preparations are Endorem and Resovist (Europe) and Feridex (e. g., USA), which are approved for liver imaging and can therefore be used in patients whose spleen is imaged as part of an MRI examination of the liver (see Chapter 1, Contrast Media, p. 8 ff.). In this case, the precontrast protocol is supplemented by a proton density (PD) sequence.5,6 Identical T2w, PD, and T1w sequences are obtained before and after SPIO administration. The pre- and postcontrast PD images are ideally acquired with a double-echo TSE sequence, producing a T2w image with the second echo. The spleen has longer T1 and T2 relaxation times than the liver, resulting in lower signal intensity on T1w images and higher signal intensity on T2w images compared with the liver7,8 (see Fig. 4.1). However, the two organs may be of similar signal intensity when fast T2w techniques are used (Fig. 4.4). After bolus injection of Gd-based contrast medium, the spleen shows early heterogeneous enhancement (arciform, mottled, or peripheral) and within a few minutes becomes uniformly hyperintense 4,9–12 (Fig. 4.5). Occasionally, there may be immediate uniform enhancement.4,10 Following SPIO injection, ca. 10 % of the dose reaches the spleen, resulting in a marked signal decrease on PD and T2w images.5 On SPIO-enhanced T1w GRE images, the spleen is slightly hypointense or hyperintense compared with precontrast images (Fig. 4.6). Fig. 4.4a, b Effects of imaging parameters on T2 contrast illustrated in a 53-year-old woman with central liver metastasis (segments III/ IVa) and subcapsular liver cyst (segment IVa) but normal spleen (1.0 T). a On T2w FSE image (TR/TE 3000/90; turbo factor, 5), the spleen is of high SI similar to that of the liver metastasis. b On breath-hold image (FSE 2500/138; turbo factor, 29), the spleen and liver are isointense. Fig. 4.5a–c Normal dynamic contrast-enhanced MRI of the spleen in a 63-year-old man with portal vein thrombosis (1.0 T). a Shadowing in the unenhanced T1w image is due to the use of a phased-array body coil. b Immediately after bolus injection of Gd-based contrast medium (0.1 mmol/kg Gd), there is arciform enhancement of the spleen. c Uniform enhancement of the spleen after 1 min (GRE 106/ 5;70°). The neonatal spleen is isointense or slightly hypointense relative to the liver on T2w images in the first week of life and then gradually becomes hyperintense until 8 months of age. On T1w images, the spleen is iso-intense or slightly hypointense to the liver during the first 2 weeks of life, only later becoming more markedly hypo-intense.13 Most splenic cysts are pseudocysts secondary to trauma or splenic infarction (80 % of all splenic cysts), epidermoid cysts (true congenital cysts with an epithelial lining), and hydatid (echinococcal) cysts (splenic echinococcosis < 2 %). In rare cases, splenic pseudocysts may arise in patients with pancreatitis. Cysts appear as well-defined lesions with low signal intensity on T1w images and high signal intensity on T2w images and do not enhance after contrast administration14 (Fig. 4.7). Only intracystic septa, which are common in hydatid cysts, may increase in signal intensity on postcontrast images.15 Calcifications can occur in hydatid, posttraumatic, and epidermoid cysts and are characterized by uniform low signal intensity on all pulse sequences. When the cyst fluid has a high cell or protein content or contains blood, signal intensity is higher on T1w images (Fig. 4.8), which may help differentiate secondary from primary cysts. While common in the liver, hemangiomas are very rare in the spleen but constitute the majority of primary splenic tumors. The most common type in the spleen is cavernous hemangioma, which often has cystic spaces containing serous or hemorrhagic fluid.16 Capillary hemangioma of the spleen is rare. Spontaneous splenic rupture occurs in up to 25 % of patients. If the entire splenic parenchyma is replaced by multiple hemangiomas, the condition is referred to as hemangiomatosis and may be a sign of generalized angiomatosis (Klippel-Trenaunay-Weber syndrome). Hemangiomas are characterized by uniform high signal intensity on T2w images and typically have smooth margins17–19 (Fig. 4.9). An inhomogeneous appearance suggests the presence of cystic and solid components (e. g., hemangiomatosis) or infarction within a large hemangioma17,19,20 (Fig. 4.10). On T1w images, they have the same or lower signal intensity compared with the spleen but may be hyperintense in the presence of intralesional hemorrhage.20–22 On contrast-enhanced dynamic images acquired after injection of extracellular Gd-based contrast medium, hemangiomas characteristically show peripheral enhancement with progression to uniform enhancement, resulting in hyperintensity relative to the spleen on late images (Fig. 4.9).20 Other enhancement patterns are immediate and persistent homogeneous enhancement and initial peripheral enhancement with centripetal progression but persistent nonenhancement of the center on delayed images, consistent with a central fibrous scar. Mixed high and low signal intensity is seen in hemangiomatosis19,23 (Fig. 4.10) and littoral cell angioma, an extremely rare vascular tumor of the spleen24,25 (Fig. 4.11). Fig. 4.7a–f Epidermoid cyst in a 34-year-old woman (1.5 T). a, b On T1w images, the cyst has lower SI than the spleen (GRE 126/5;75°). c On the breath-hold T2w image, the cyst is seen as a well circumscribed lesion of uniform high SI (FSE 2500/138; turbo factor, 23). d The cyst is even more conspicuous on fat-suppressed image (FSE 5000/108). e, f There is no signal enhancement of the cyst after injection of Gd-based contrast medium (0.1 mmol/kg Gd; GRE 126/ 5;75°). Note wraparound artifacts in c and f.
M. Laniado and F. Dammann
Introduction
Indications
Imaging Technique
Imaging Planes
Pulse Sequences
Contrast Media
MRI Appearance of Normal Anatomy
MRI Appearance of Pathologic Entities
Benign Tumors
Related posts:

Stay updated, free articles. Join our Telegram channel

Full access? Get Clinical Tree


