Figure 4.1
A-lines: Normal lung findings include horizontal A-lines (arrows) throughout the lung caused by reverberation artifact from the pleural line

Figure 4.2
B-lines: B-lines extend from the pleural line down to the bottom of the screen without fading. Up to three B-lines per lung field is considered normal

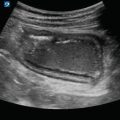
Figure 4.3
Hepatization: Lung tissue above the diaphragm (left side) appears similar to liver tissue below the diaphragm (right side). Also noted is a pleural effusion
Image Acquisition
Transducer Selection
Linear array: allows best visualization of the pleura and superficial lung fields
Curvilinear: allows visualization of multiple rib spaces at once, good for viewing deep lung fields
Phased array: allows the ability to image between rib spaces and view deeper lung fields
Patient Position
Ideally, the patient should be imaged while sitting upright to obtain optimal views, especially to evaluate for pleural effusion.
If the patient is unable to sit up, they can be imaged supine for anterior and lateral views and in a lateral recumbent position for posterior views.
Standard Exam Views
A complete lung scan includes at least eight zones:
Anterior, lateral, posterior, and costophrenic angles on each side.
If concern for effusion, you can obtain similar views on the posterior aspect to better visualize fluid.
Figure 4.4—Lung zones (photo of chest with locations outlined)

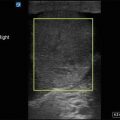
Figure 4.4
Lung zones: Anterior and lateral lung zones are outlined here. When imaging the lung, it is important to evaluate multiple zones for completeness
Image Acquisition
- (a)
Lung Fields
Place the transducer vertically with the marker pointed cephalad.
Begin by evaluating for lung sliding.
Lung sliding occurs due to the visceral pleura sliding against the parietal pleura during normal respirations.
Adjust the depth so that the lung pleura are optimally visualized in the middle of the screen.
Visualize at least two ribs with a hyperechoic horizontal line between them representing the pleural line.
Figure 4.5—Normal pleural line view
Lung sliding will appear as two thin hyperechoic lines moving horizontally against each other in a to-and-fro movement.
Video 4.3—Lung sliding.
Decrease the gain to help visualize pleura.
If unable to determine if the pleura is sliding, utilize M-mode for further evaluation.
Next, increase the depth to obtain views of the entire lung.
Image each lung field (see above for recommended scanning locations).
Evaluate for A-lines, B-lines, and signs of pathology such as consolidation.
Figure 4.8—Lung fields with depth increased
- (b)
Costophrenic Angles
Place the transducer inferior and posterolaterally where the diaphragm meets the liver or spleen with the transducer marker pointed cephalad.
Figure 4.9—Photo of transducer location for costophrenic angle
Visualize the hyperechoic diaphragm superior to the liver or spleen.

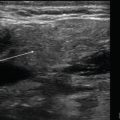
Figure 4.5
Normal pleural line: Normal pleural line is hyperechoic and linear (A) located between rib shadows (B)

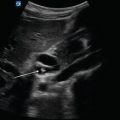
Figure 4.6
M-mode with correct spike position: The M-mode spike should be placed between the two rib shadows overlying the hyperechoic pleural line

Figure 4.7


Normal sliding lung M-mode “seashore sign”: M-mode ultrasonography of a normal lung demonstrates the static chest wall in the top half of image and movement of the lungs in the bottom half consistent with normal respiration. Sometimes referred to as “seashore” sign
Related posts:
Stay updated, free articles. Join our Telegram channel
Full access? Get Clinical Tree
