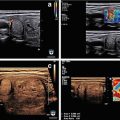
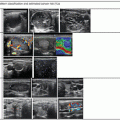
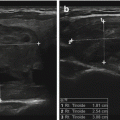
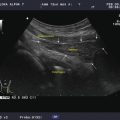
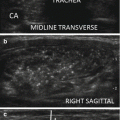
Figure. 2.1
Speed of sound . The speed of sound is constant for a specific material and does not vary with frequency. Speed of sound for various biological tissues is illustrated
Sound waves propagate by compression and rarefaction of molecules in space (Fig. 2.2). Molecules of the propagating medium vibrate around their resting position and transfer their energy to neighboring molecules. Sound waves carry energy rather than matter through space.
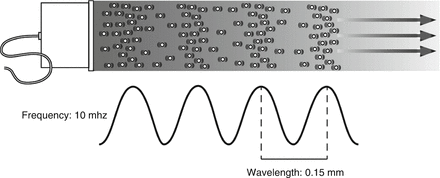

Figure. 2.2
Sound waves propagate in a longitudinal direction but are typically represented by a sine wave where the peak corresponds to the maximum compression of molecules in space, and the trough corresponds to the maximum rarefaction
As shown in Fig. 2.2, sound waves propagate in a longitudinal direction but are typically represented graphically by a sine wave where the peak corresponds to the maximum compression of molecules in space, and the trough corresponds to the maximum rarefaction. Frequency is defined as the number of cycles per time of the vibration of the sound waves. A Hertz (Hz) is defined as one cycle per second. The audible spectrum is between 30 and 20,000 Hz. Ultrasound is defined as sound waves at a higher frequency than the audible spectrum. Typical frequencies used in diagnostic ultrasound vary between five million and sixteen million cycles per second (5 and 16 MHz) [1, 3].
Diagnostic ultrasound uses pulsed waves, allowing for an interval of sound transmission, followed by an interval during which reflected sounds are received and analyzed. Typically three cycles of sound are transmitted as a pulse. The spatial pulse length is the length in space filled by three cycles (Fig. 2.3). Spatial pulse length is one of the determinants of resolution. Since higher frequencies have a smaller pulse length, higher frequencies are associated with improved resolution . As illustrated in Fig. 2.3, at a frequency of 15 MHz, the wavelength in biological tissues is approximately 0.1 mm, allowing an axial resolution of 0.15 mm. Although resolution improves with increased frequency, the depth of penetration of the ultrasound waves decreases, limiting the visualization of deeper structures.
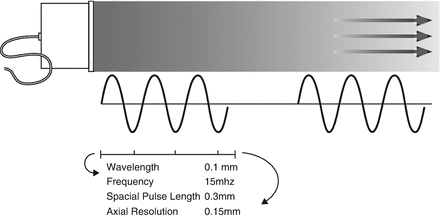

Figure. 2.3
Diagnostic ultrasound uses pulsed waves , allowing for an interval of sound transmission, followed by an interval during which reflected sounds are received and analyzed. Typically three cycles of sound are transmitted as a pulse
As mentioned above, the speed of sound is constant for a given material or biological tissue. It is not affected by frequency or wavelength. It increases with stiffness and decreases with density of the material. As seen in Fig. 2.1, common biologic tissues have different propagation velocities. Bone, as a very dense and stiff tissue, has a high propagation velocity of 4080 meters per second (m/s). Fat tissue, with low stiffness and low density, has a relatively low speed of sound of 1450 m/s. Most soft tissues have a speed of sound near 1540 m/s. Muscle, liver, and thyroid have a slightly faster speed of sound. By convention, all ultrasound equipment uses an average speed of 1540 m/s. The distance to an object displayed on an ultrasound image is calculated by multiplying the speed of sound by half of the time interval for a sound signal to return to the transducer [2, 3]. By using the accepted 1540 m/s as the assumed speed of sound, all ultrasound equipment will provide identical distance or size measurements.
Reflection is the redirection of a portion of a sound wave from the interface of tissues with unequal acoustic impedance. Larger differences in impedance will result in greater amounts of reflection. A material that is homogeneous in acoustic impedance does not generate any internal echoes. A pure cyst is a typical example of an anechoic (echoless) structure. Most biological tissues have varying degrees of inhomogeneity both on a cellular and macroscopic level. Connective tissue, blood vessels, and cellular structure all provide mismatches of acoustic impedance, which lead to the generation of characteristic ultrasonographic patterns (Figs. 2.4, 2.5, and 2.6).
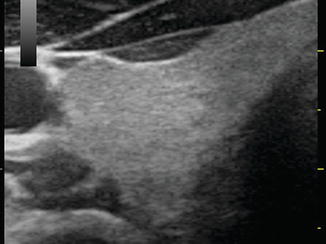
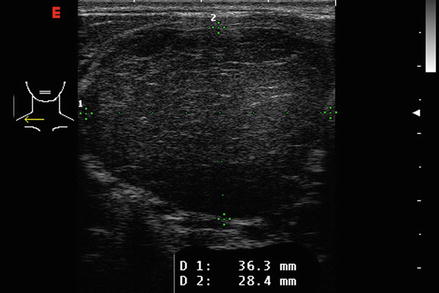
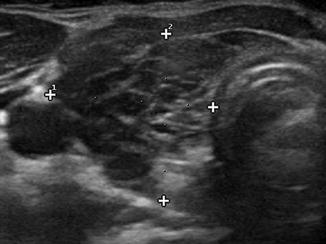

Figure. 2.4
The echotexture of normal thyroid tissue. It has a ground glass appearance and is brighter than muscle tissue

Figure. 2.5
The thyroid from a patient with the acutely swollen inflammatory phase of Hashimoto’s thyroiditis . Massive infiltration by lymphocytes has decreased the echogenicity of the tissue resulting in a more homogeneous hypoechoic pattern

Figure. 2.6
A typical heterogeneous and hypoechoic pattern from Hashimoto’s thyroiditis with hypoechoic inflammatory regions separated by hyperechoic fibrous tissue
Creation of an Ultrasound Image
The earliest ultrasound imaging consisted of a sound transmitted into the body, with the reflected sound waves displayed on an oscilloscope. Referred to as A-mode ultrasound, these images in the 1960s and 1970s were capable of providing measurements of internal structures such as thyroid lobes, nodules, and cysts. Figure 2.7a shows an A-mode ultrasound image of a solid thyroid nodule. Scattered echoes are present from throughout the nodule. Figure 2.7b shows an image from a cystic nodule. The initial reflection is from the proximal wall of the cyst, with no significant signal reflected by the cyst fluid. The second reflection originates from the posterior wall. Figure 2.7c shows the A-mode image from a complex nodule with solid and cystic components. A-mode ultrasound was capable of providing size measurements in one dimension but did not provide a visual image of the structure [1].
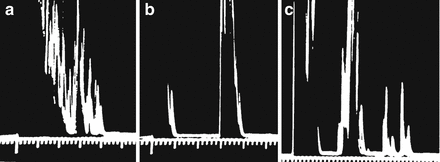

Figure. 2.7
A-mode ultrasound images. (a) An A-mode ultrasound image of a solid thyroid nodule. Scattered echoes are present from throughout the nodule. (b) The image from a cystic nodule. The initial reflection is from the proximal wall of the cyst, with no significant signal reflected by the cyst fluid. The second reflection originates from the posterior wall. (c) The A-mode image from a complex nodule with solid and cystic components
In order to provide a visual two-dimensional image, a series of one-dimensional A-mode images are aligned as a transducer is swept across the structure being imaged. Early thyroid ultrasound images were created by slowly moving a transducer across the neck. By scanning over a structure and aligning the A-mode images, a two-dimensional image is formed. The two-dimensional image formed in this manner is referred to as a B-Mode scan (brightness mode) (Fig. 2.8). Most ultrasound transducers used for thyroid imaging use a series of piezo-electric crystals in a linear array to electronically simulate a sweep of the transducer. Firing sequentially, each crystal sends a pulse of sound wave into the tissue and receives subsequent reflections.
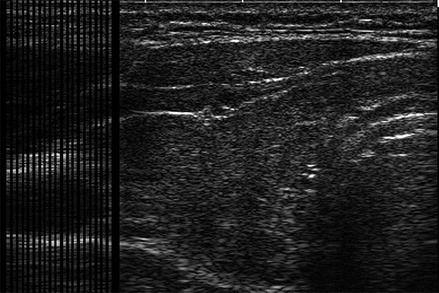

Figure. 2.8
A B-mode ultrasound image is composed of a series of A-mode images aligned to provide a two-dimensional image
The final ultrasound image shows a cross sectional image through the tissue defined by the thin flat beam of sound emitted from the transducer. Resolution is the ability to distinguish between two separate, adjacent objects. For example, with a resolution of 0.2 mm, two adjacent objects measuring <0.2 mm would be shown as a single object. Objects smaller than the resolution will not be realistically imaged. Lateral resolution refers to the ability to discriminate in a transverse, or side to side, direction. Azimuthal resolution refers to the image perpendicular to the axis of the ultrasound beam; this is inherent to the transducer and cannot be adjusted. Axial resolution is the ability to discriminate objects along the path of the ultrasound beam. Axial resolution is determined by the spatial pulse length and therefore frequency. Lateral and azimuthal resolutions are dependent on the quality and focusing of the ultrasound beam.
The Usefulness of Artifacts in Ultrasound Imaging
A number of artifacts commonly occur in ultrasound images. Unlike most other imaging techniques, such as CT scanning, artifacts are very helpful in interpreting ultrasound images. Artifacts such as shadows behind objects or unexpected areas of brightness can provide additional understanding of the properties of the materials being imaged.
When sound waves impact on an area of extreme mismatch of acoustic impedance, such as a tissue-air interface or a calcification within soft tissue, the vast majority of the sound waves are reflected, providing a very bright signal from the object’s surface and an absence of imaging beyond the structure. Figure 2.9 demonstrates acoustic shadowing behind a calcified nodule. Figure 2.10 illustrates a coarse calcification within the thyroid parenchyma with acoustic shadowing behind the calcification. Figure 2.11 shows the typical appearance of the trachea on an ultrasound image. Because there is virtually no transmission of sound through the air-tissue interface of the anterior wall of the trachea, no imaging of structures posterior to the trachea occurs. As explained below the reflections seen behind the trachea represent reverberation artifact.
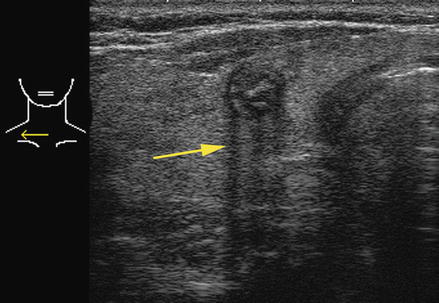
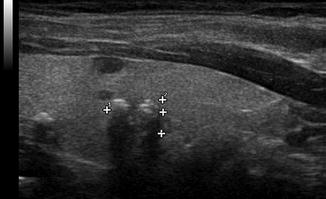
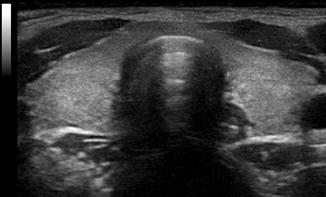

Figure. 2.9
Acoustic shadowing . When sound waves impact on an area of extreme mismatch of acoustic impedance, such as a calcification, the vast majority of the sound waves are reflected, resulting in the shadow beyond the structure. This calcified nodule is from a patient with familial papillary carcinoma

Figure. 2.10
Acoustic shadowing . A shadow is observed behind a coarse calcification within the thyroid parenchyma. Unlike calcification within a nodule, amorphic calcification within the parenchyma is not typically associated with malignancy

Figure. 2.11
Acoustic shadowing . Due to the extreme reflection from the tissue-air interface of the trachea, no image is seen behind the trachea on an anterior ultrasound
Conversely, a cystic structure transmits sound with very little attenuation, resulting in a greater intensity of sound waves behind it, compared to adjacent structures. This “through transmission” results in acoustic enhancement with a brighter signal behind a cystic or anechoic structure. This enhancement can be used to distinguish between a cystic and solid nodule within the thyroid. Figure 2.12 illustrates enhancement behind a cystic nodule. Enhancement is not limited to cystic nodules, however. Any structure that causes minimal attenuation of the ultrasound signal will have enhancement posterior to it. Figure 2.13 illustrates enhancement behind a solid parathyroid adenoma . Figure 2.14 illustrates enhancement behind a benign colloid nodule . Due to the high content of fluid and colloid within the nodule, and resultant decrease in cellularity, there is less attenuation of signal within the nodule than within the surrounding thyroid tissue. To establish that a structure is cystic, use Doppler (as described in Chap. 3) to confirm there is no internal flow as would be seen in a vascular solid nodule with which posterior enhancement can also be seen.
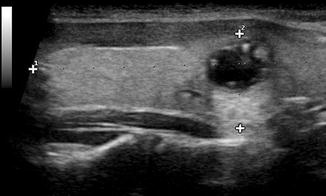

Figure. 2.12


Enhancement . A cystic structure transmits sound with very little attenuation, resulting in a greater intensity of sound waves behind it. Enhancement is typical behind a cystic nodule
Stay updated, free articles. Join our Telegram channel

Full access? Get Clinical Tree


